2835
Peak ventricular transit time with first pass perfusion on cardiac MRI is a new marker of right ventricular dysfunction and pulmonary hypertension1Diagnostic and Interventional Radiology, Hokkaido University Hospital, Sapporo, Japan, 2Nuclear Medicine, Hokkaido University Hospital, 3First Department of Medicine, Hokkaido University Hospital, 4Department of Cardiovascular Medicine, Hokkaido University Hospital
Synopsis
Thirty-three patients with pulmonary hypertension (PH) and 16 controls were retrospectively evaluated. The right-to-left peak ventricular transit time (PVTT) determined using cardiac first-pass perfusion MRI was prolonged in patients with PH without left ventricular dysfunction. The degree of PVTT prolongation showed a modest association with right ventricular dilatation and dysfunction. Significant positive correlations were observed between PVTT and pulmonary artery pressures. The PVTT showed moderate sensitivity (65%) and high specificity (90%) for detection of PH. PVTT may be an additional simple tool to evaluate right ventricular dysfunction and pulmonary artery pressure in patients with PH.
PURPOSE
Cardiac magnetic resonance imaging (CMRI) can quantify ventricular volumes and ejection fraction1, and dynamic CMRI with first-pass perfusion (FPP) can visualize and record the transit time of gadolinium from the right to the left ventricular cavity. The right-to-left peak ventricular transit time (PVTT) measured with CMRI was prolonged in patients with heart failure and associated with the degree of LV dysfunction2. However, there are no reports investigating the correlation between PVTT and RV dysfunction in pulmonary hypertension (PH). This study aimed to investigate the clinical utility of PVTT using CMRI in PH patients. We correlated PVTT with RV functional parameters (RV end-diastolic volume (EDV), end-systolic volume (ESV), and ejection fraction (EF)) and the results of right heart catheterization (RHC).METHODS
The institutional review board approved the retrospective study and waived the requirement for informed consent. Forty-nine patients with PH (mean pulmonary artery pressure (PAP) > 25 mmHg) between December 2009 and December 2015 were enrolled in this study. CMRI was performed as a part of clinical routine. Sixteen patients with LV dysfunction (LVEF < 55%) were excluded. Thirty-three PH patients (men 10, age 57 ± 15 years) without LV dysfunction were included in this study. Nineteen age- and sex-matched patients with normal LV function (LVEF ≧ 55%) and no cardiac disease (no late gadolinium enhancement) were enrolled as the control group. CMRI was performed with a 1.5 T whole-body scanner Achieva (Philips Medical System, Best, The Netherlands) equipped with a 32-channel phased-array coil. Functional cardiac imaging was performed by breath-hold segmented k-space steady-state free precession (SSFP) techniques (TR/TE/FA, 3.5/1.75 ms/60°; spatial resolution, 2.97×2.86×8 mm; slice thickness, 10 mm; matrix, 128×108; 20 phases). Myocardial FPP imaging was performed by an ECG-gated turbo field echo technique (TR/TE/FA, 4.0/1.91 ms/18°; spatial resolution, 1.7×2.41×8 mm; slice thickness, 8 mm; matrix, 224×158) with an intravenous bolus of gadolinium (Gd-DTPA, Magnevist®, Bayer Schering Pharma, Berlin, Germany; 0.03 mmol/kg body weight), followed by a 20-mL saline flush, at 4.0 mL/s. Representative images of the FPP are given in Fig. 1. LV and RV endocardial borders were semi-automatically traced from the stack of cine images to obtain EDV and ESV. The PVTT was defined as the interval between the first peak of an intravenously injected bolus of gadolinium in each RV and LV cavity (see Fig. 2). All CMRI measurements were performed by a blinded cardiovascular radiologist using View Forum (Extended MR Work Space: ver. 2.6.3; Philips Medical Systems, Best, The Netherlands). RHC was performed within 2 weeks in patients with PH. One-way ANOVA was used to test the differences in RV volume parameters and PVTT between the PH and control groups. Correlations between PVTT and results of RV volume and RHC were evaluated by linear regression analysis. Sensitivity and specificity of PVTT for detection of PH were verified by an ROC-curve analysis. All statistical analyses were performed using JMP 12.0.1 (SAS institute, Cary, NC, USA)RESULTS
CMRI and RHC results are summarized in Fig.3. RV volumes and RVEF differed between PH and control groups (p < 0.0001), while LV volumes and LVEF did not differ between groups (p > 0.05). The PVTT in PH patients (8.5± 0.4 sec) was significantly longer than that in control subjects (6.2 ± 0.5 sec, p = 0.0009). The PVTT showed significant correlations to RHC results (to pulmonary vascular resistance (PVR): r = 0.66, p < 0.0001; to systolic PAP: r = 0.59, p = 0.002; to mean PAP: r = 0.63, p = 0.0006; and to diastolic PAP: r = 0.46, p = 0.04)(Fig.4). Furthermore, the PVTT presented a significant positive correlation to RVEDV (r = 0.42, p = 0.002), RVESV (r = 0.46, p = 0.0007), and a significant negative correlation to RVEF (r = −0.49, p = 0.0002). The PVTT showed moderate sensitivity (65%) and high specificity (90%) with a cut-off of 8.0 s (p = 0.004) for the detection of PH.DISCUSSION
This is the first study to investigate the clinical utility of the PVTT as a marker of RV dysfunction. The PVTT was significantly prolonged in PH patients and the degree of prolongation showed a modest association with RV dilatation, RVEF, PAP, and PVR. The PVTT obtained using CMRI with FPP is an easy tool for the functional description of RV dysfunction in PH patients with normal LV function.CONCLUSION
The PVTT determined by CMRI was prolonged in PH patients and the degree of its prolongation significantly correlated with RV dysfunction and pulmonary artery pressures.Acknowledgements
NoneReferences
1) Marcu CB, Beek AM, van Rossum AC. Clinical applications of cardiovascular magnetic resonance imaging. CMAJ 2006;175(8):911–917.
2) Hansch A, Heyne JP, Jung C, et al. Quantitative first pass perfusion in cardiovascular magnetic resonance for determination of peak ventricular transit time-A technique for evaluation of heart function. Eur J Radiol. 2012;81(11):e996-e1001.
Figures
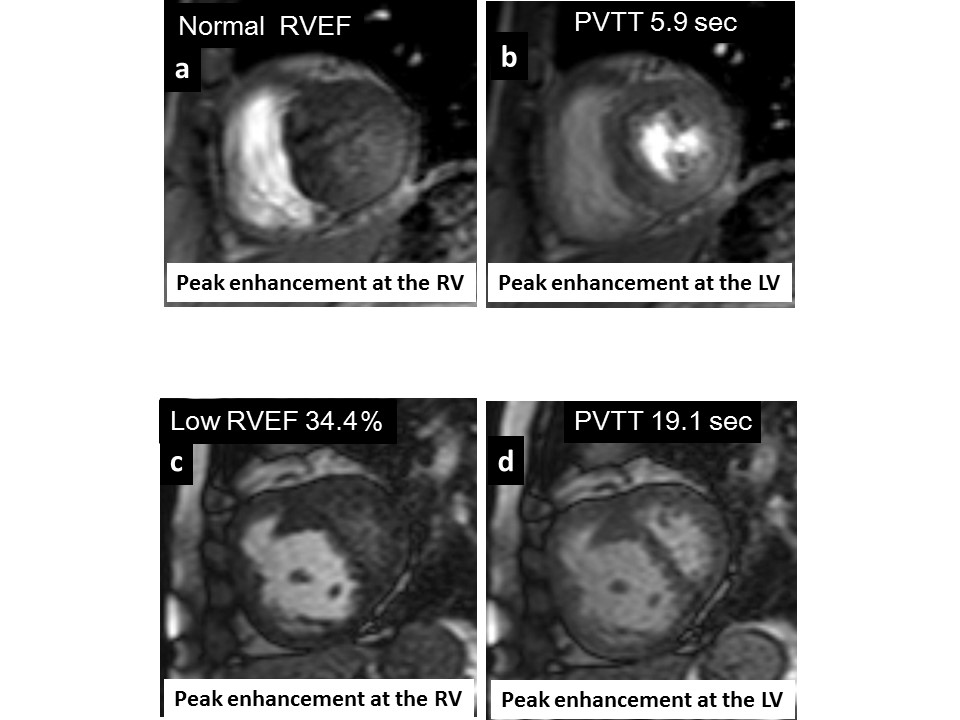
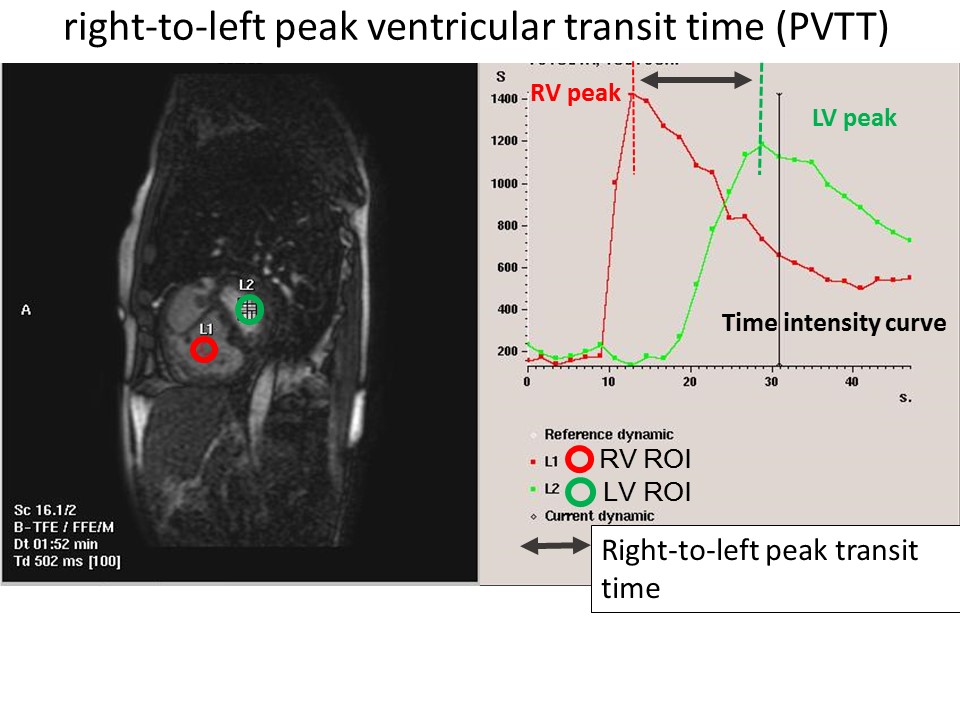
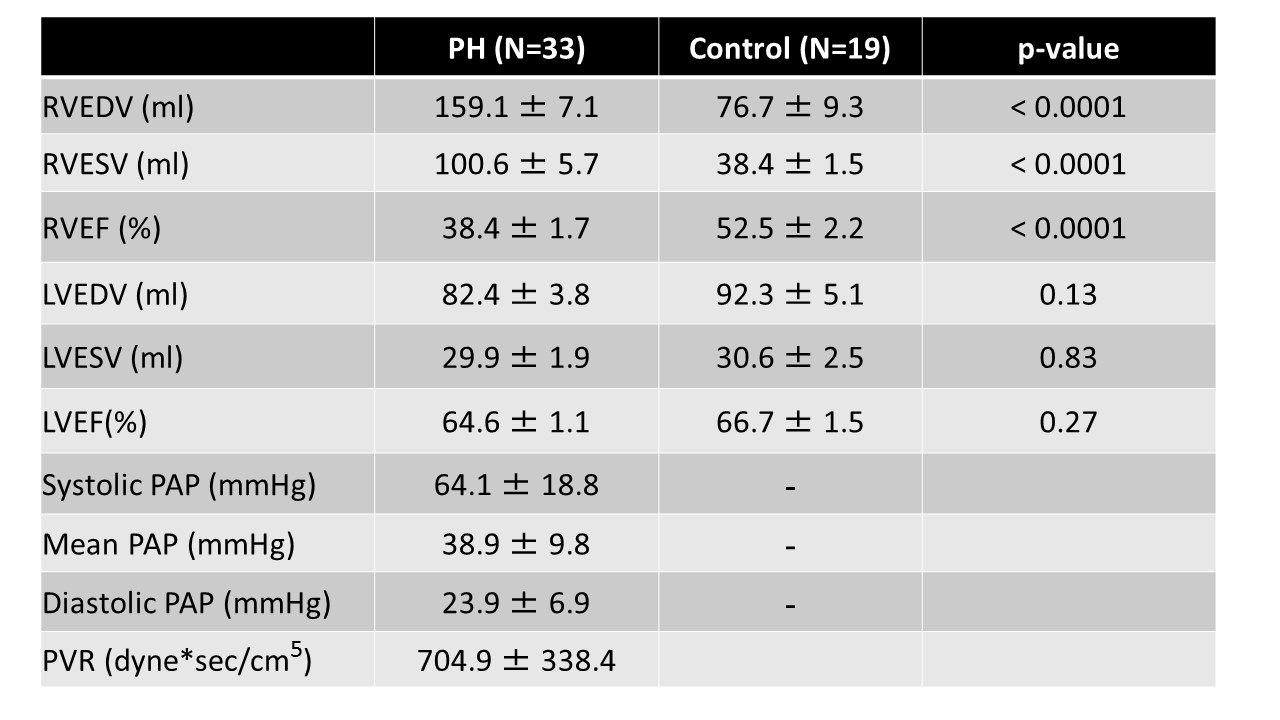
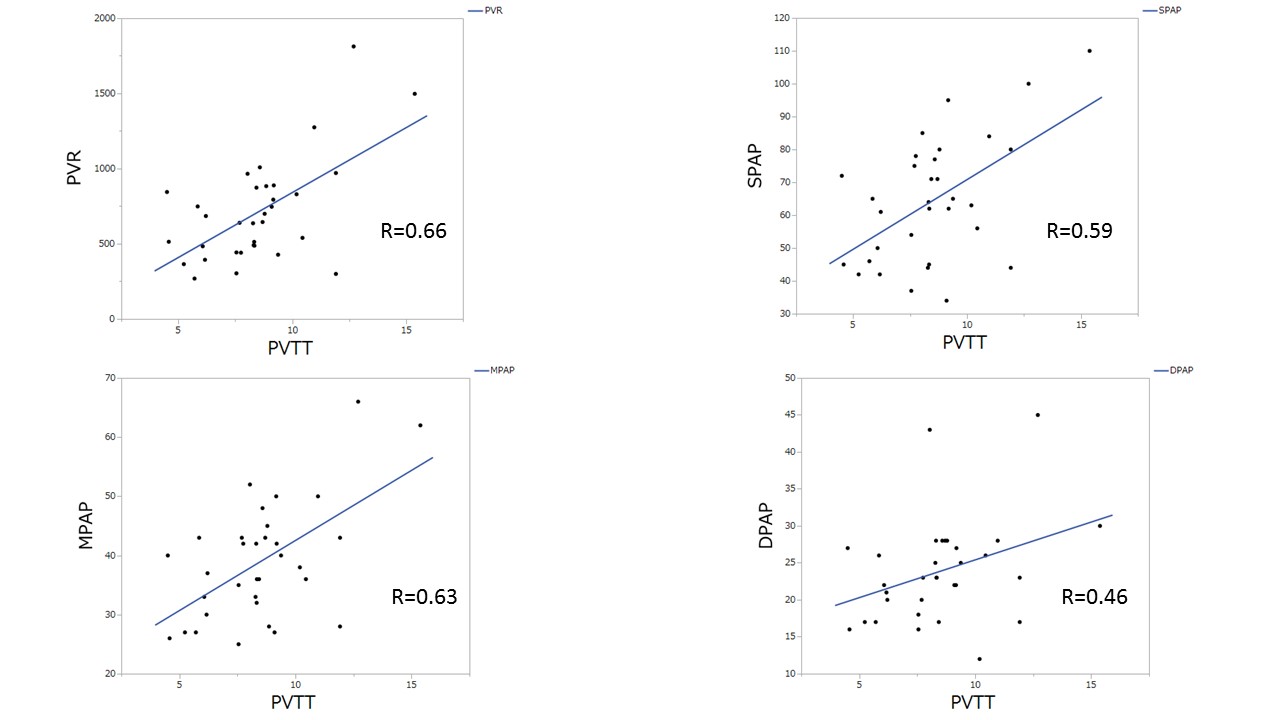
Fig.4. Linear regression analyses.
Scatter plots show the significant correlations between PVTT and results of right heart catheterization.