2833
4D Flow MRI and lumped parameter modelling for subject-specific assessment of cardiovascular function1Division of Cardiovascular Medicine, Department of Medical and Health Sciences, Linköping University, Linköping, Sweden, 2Center for Medical Image Science and Visualization (CMIV), Linköping University, Linköping, Sweden, 3Department of Medicine, University of California San Francisco, San Francisco, CA, United States, 4Department of Clinical Physiology, Department of Medical and Health Sciences, Linköping University, Linköping, Sweden, 5Division of Applied Thermodynamics and Fluid Mechanics, Department of Management and Engineering, Linköping University, Linköping, Sweden
Synopsis
Lumped-parameter models of the cardiovascular system can improve the understanding of cardiovascular function and assist treatment planning. The clinical applicability of these models improves when they are subject-specific. This work proposes an approach to personalizing a model of the heart and the systemic circulation using exclusively non-invasive measurements from routine cardiovascular MRI and 4D Flow MRI. Personalized models were constructed for eight healthy volunteers. The model-based pressures and flows agreed well with the in-vivo measurements for each subject. The proposed approach can be used to synthesize medical data into clinically relevant information and estimate parameters that cannot be measured clinically.
Purpose
Lumped-parameter models of the cardiovascular system have the potential to improve the understanding of cardiovascular function and assist treatment planning. Personalization, which consists of tailoring the model to represent a specific subject, is paramount to bringing these models closer to routine clinical use. However, most approaches to personalizing lumped-parameter models require invasive measurements1,2 or can only estimate a small subset of parameters3,4. This work proposes a framework for constructing a personalized, lumped-parameter model of the heart and the systemic circulation using exclusively non-invasive data from routine cardiovascular MR scans and 4D Flow MRI.Methods
Personalized models were created for eight healthy subjects (mean age: 26±4 years, range 20-32 years, 2 men) representing a spectrum of heart rates (mean 67±10 bpm, range 55-82 bpm) and systolic and diastolic blood pressures (SBP 113±10 mmHg, DBP 63±9 mmHg). All subjects underwent MRI examinations on a 3T scanner (Philips Ingenia, Philips Healthcare, Best, the Netherlands) to acquire 4D Flow data and 2D cine balanced steady-state free-precession (bSSFP) morphological data. Scan parameters were as follows: VENC 140 cm/s, flip angle 5°, TE 3.0 ms, TR 5.2 ms, SENSE factors of 3 (AP direction) and 1.6 (RL direction), k-space segmentation factor 3, spatial resolution 2.8 × 2.8 × 2.8 mm3 and temporal resolution approximately 40 ms. Brachial artery SBP and DBP were measured non-invasively five to ten minutes before the MRI procedure.
The lumped-parameter model includes three main compartments: the pulmonary venous system, the left side of the heart (including the left atrium, the mitral valve, the left ventricle and the aortic valve) and the systemic arterial system. The model of the systemic arterial system is divided into the ascending aorta, the supra-aortic vessels, the descending thoracic aorta, the intercostal arteries, the abdominal aorta and the peripheral tree to the level of the capillary bed. The heart chambers were modeled using a time-varying elastance function, which provides the pressure in the chamber given that the chamber volume is known5. Vessel segments were modeled by a combination of electrical elements representing frictional losses, mass flow inertia and the viscoelastic properties of the vessel wall6.
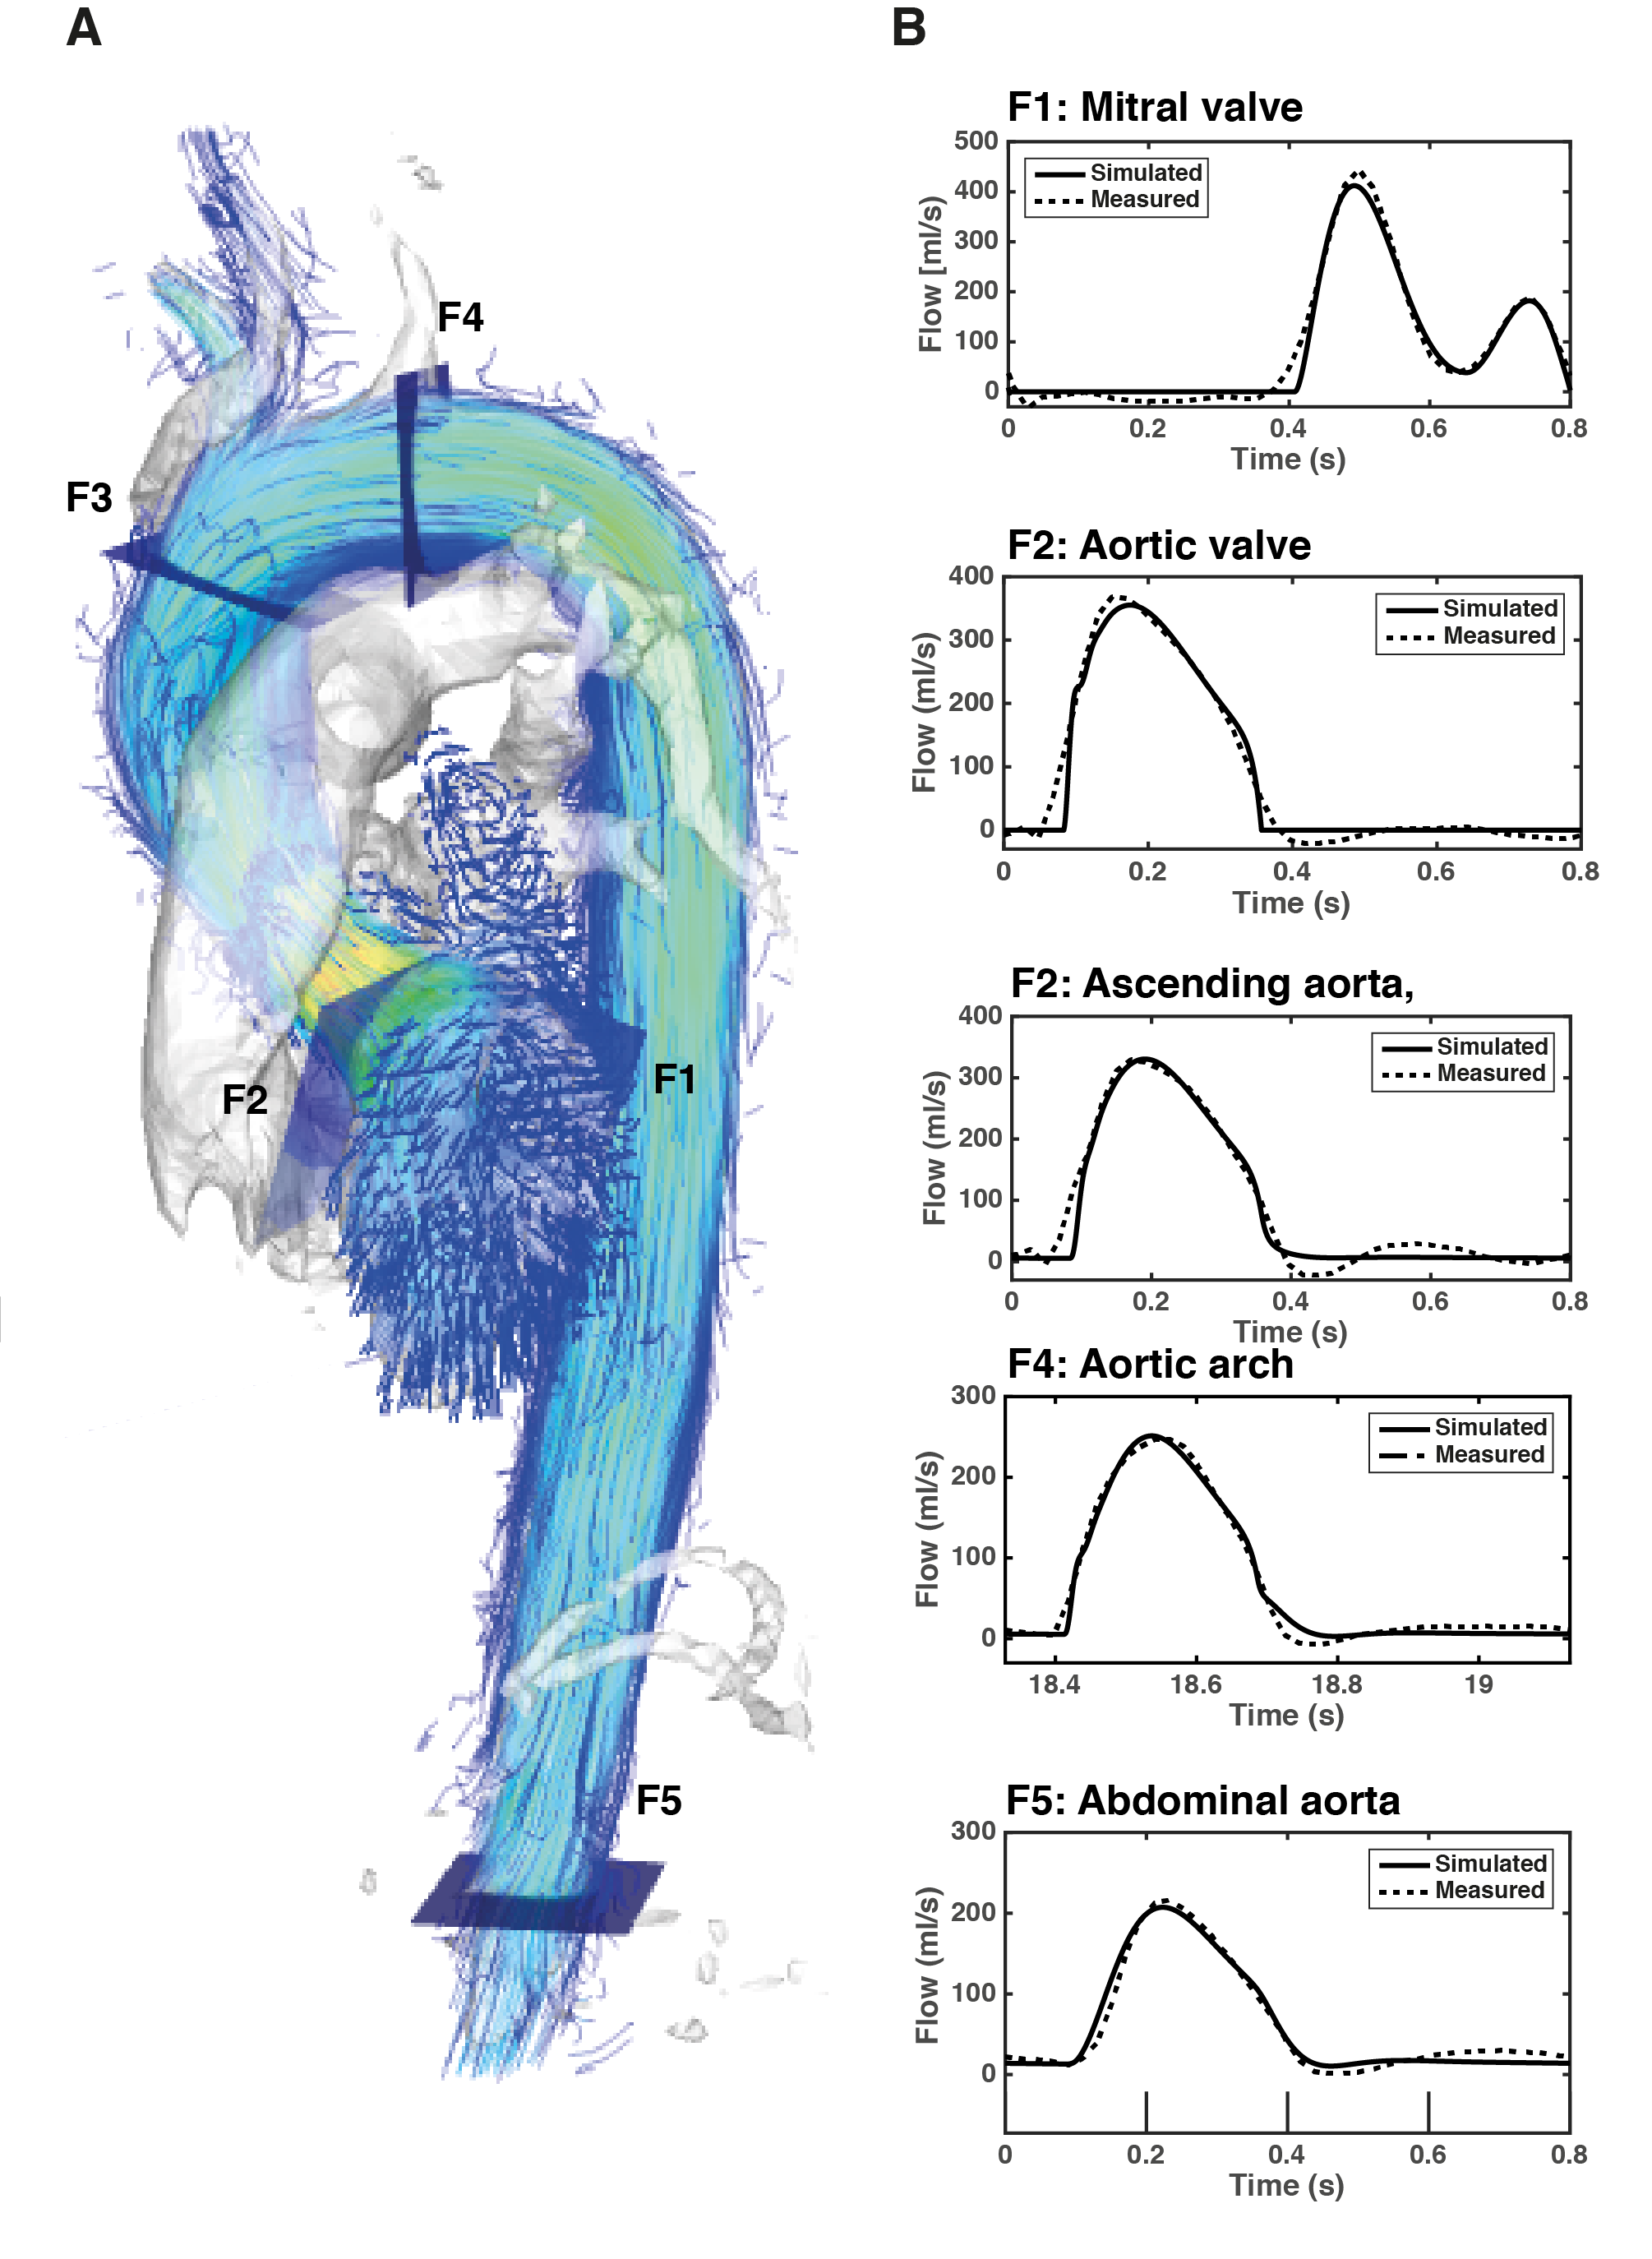
Estimation of the parameters requires 4D Flow-derived measurements to characterize the morphology and function of the left ventricle and the aortic valve, as well as volumetric flow waveforms from five locations (F1 to F5 in Figure 1). The end-systolic volume of the left ventricle was computed by manual segmentation of the short-axis images at the time of end systole. This volume was used to estimate the maximal elastance of the left ventricle. The aortic valve was described according to the energy loss index formulation7. The cross sectional area of the aorta was calculated by manually segmenting the aortic lumen contour in the 4D Flow data at peak systole and the effective orifice area was approximated using the continuity equation. The remaining parameters were estimated using nonlinear optimization8, by minimizing the error between the 4D Flow waveforms and those generated by the model at locations F1 to F5.
Results
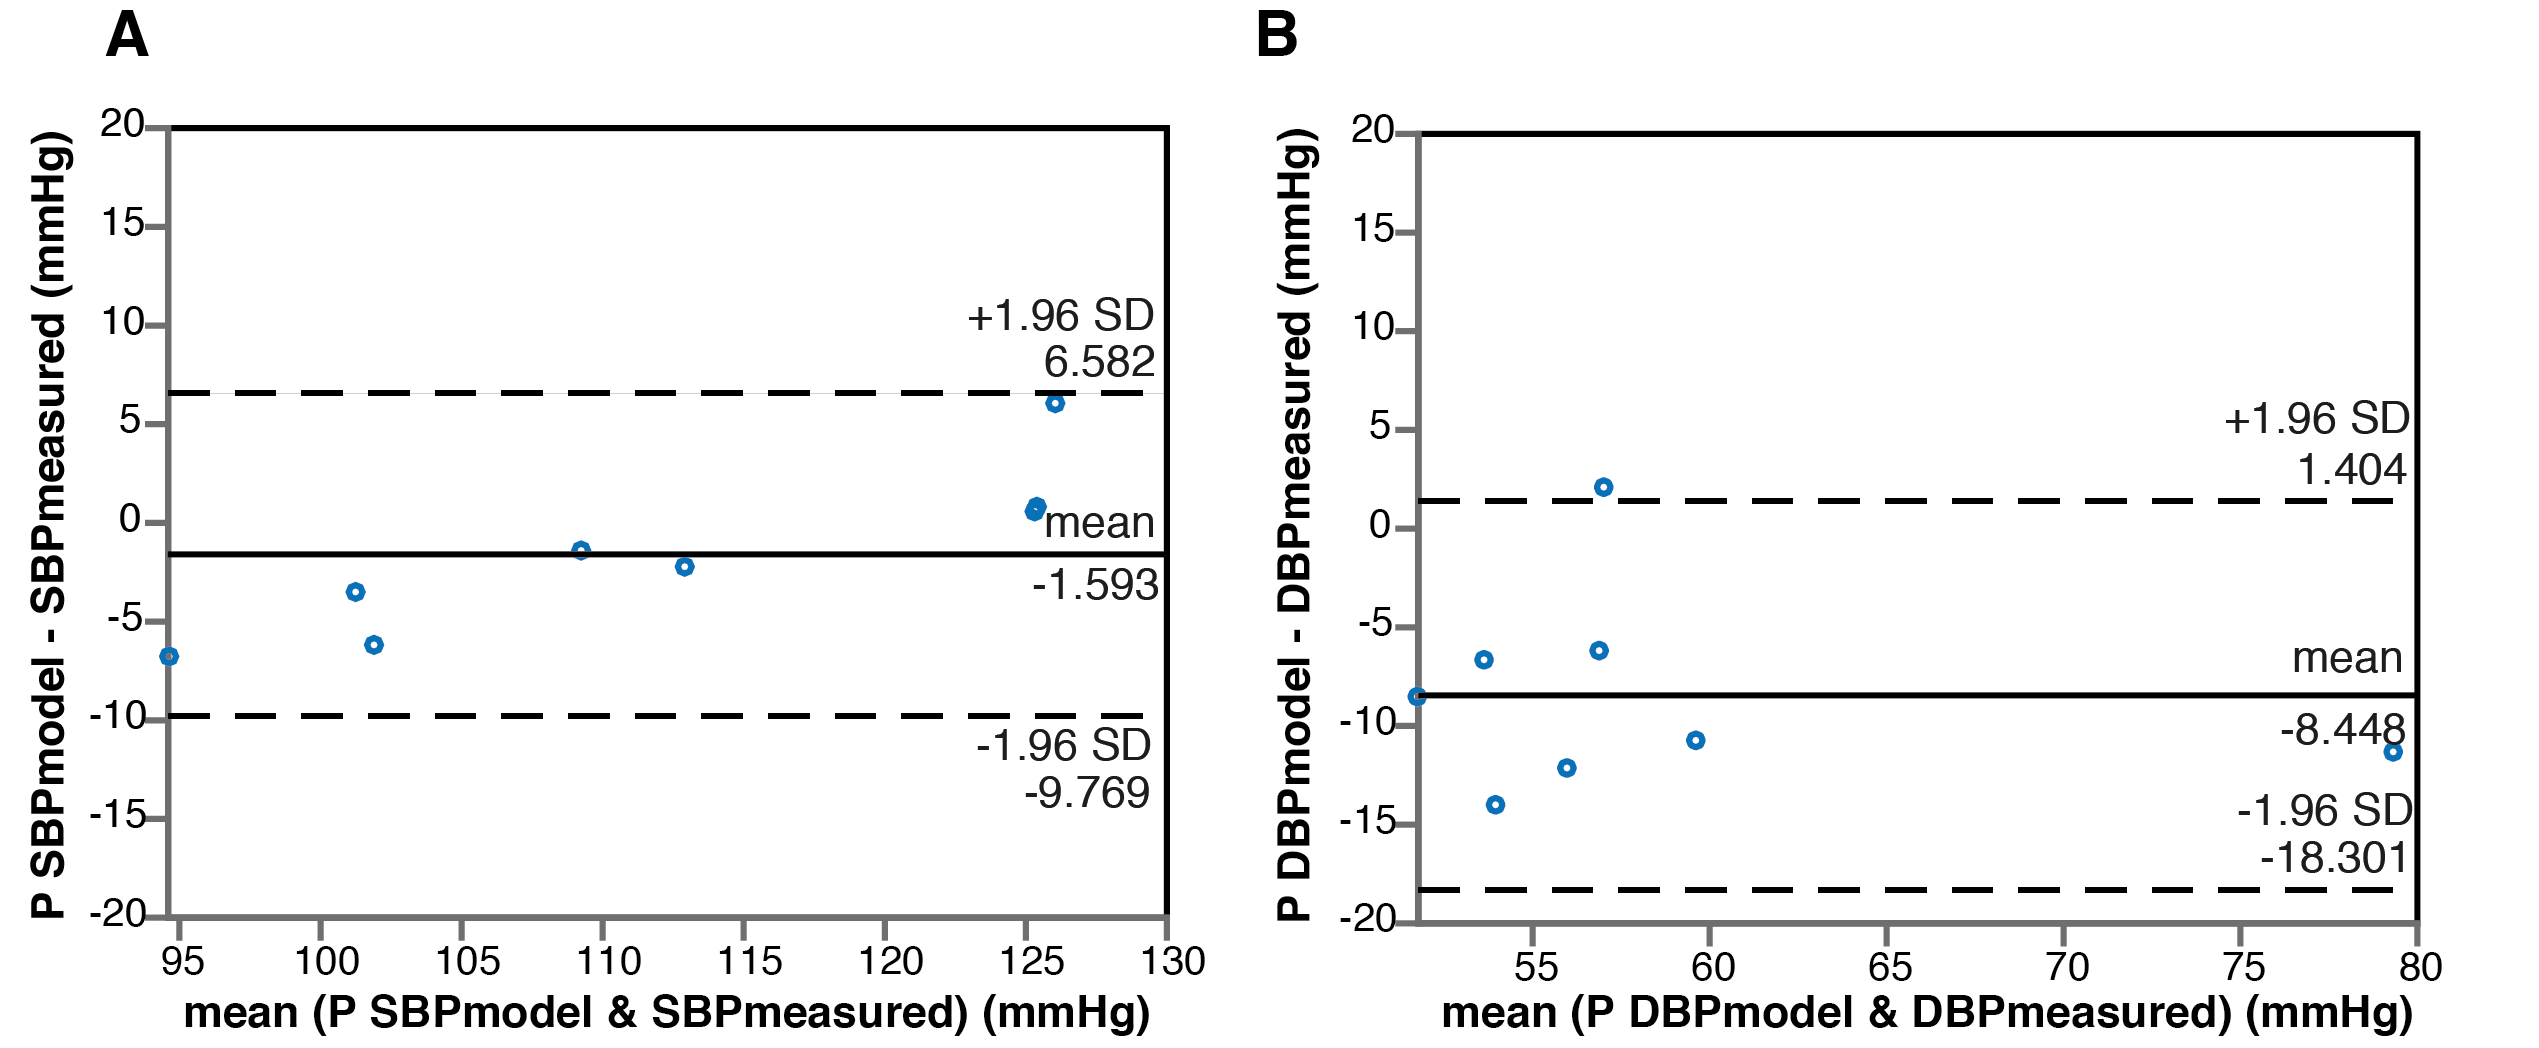
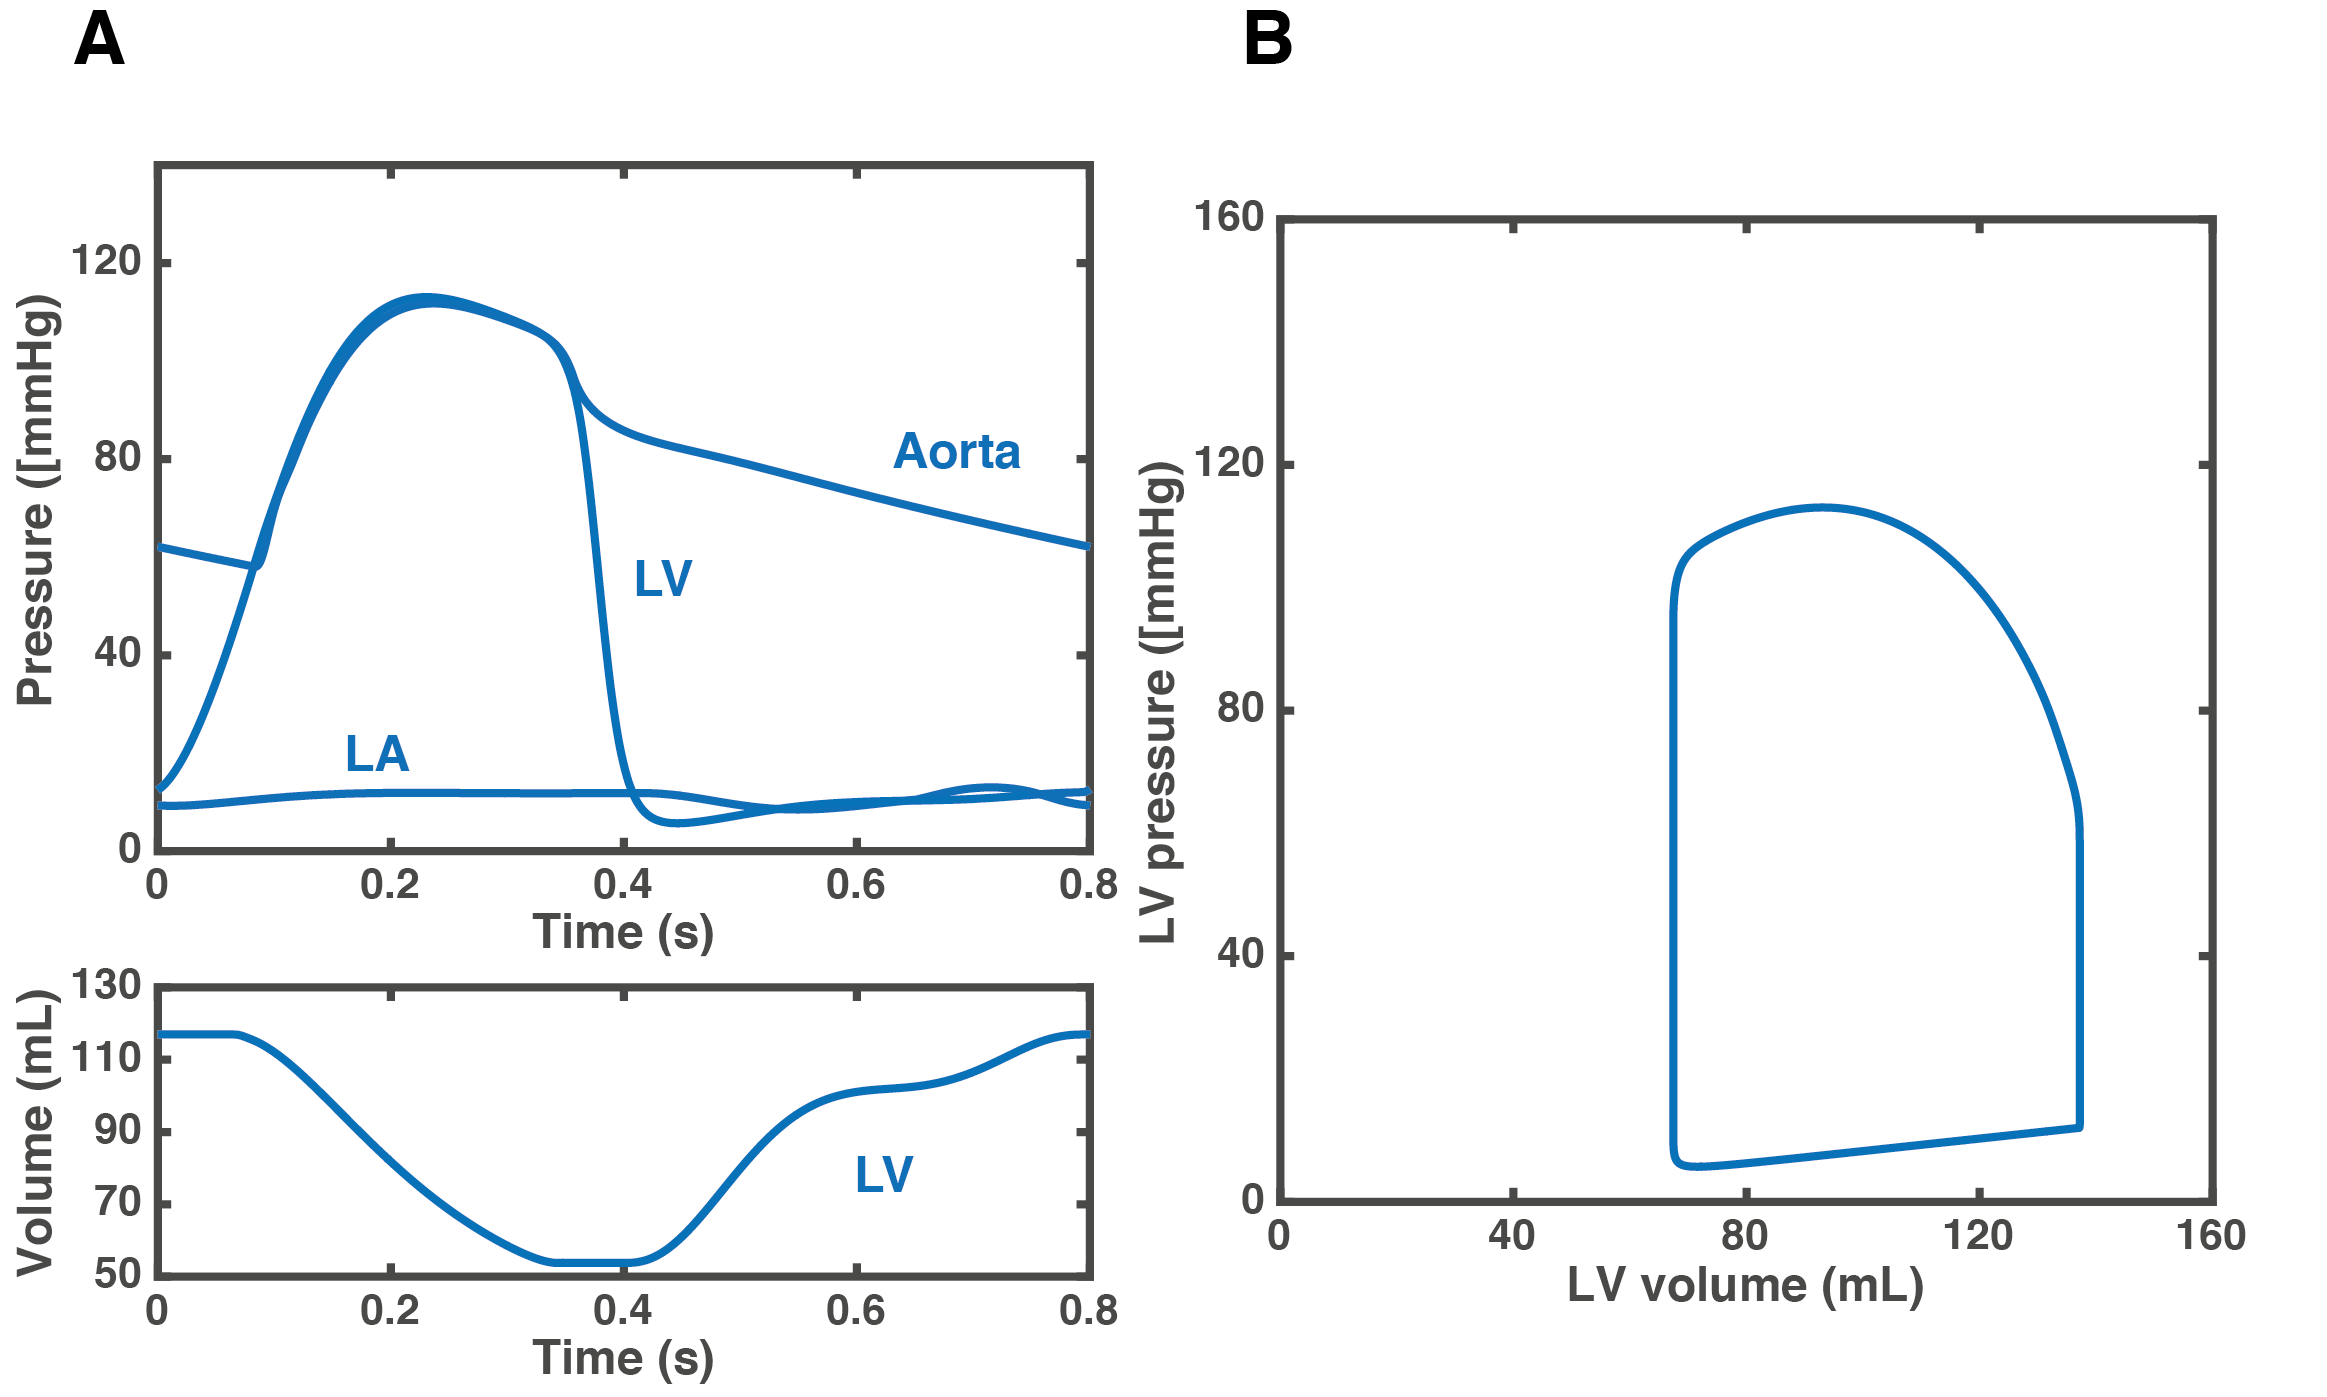
Figure 1 shows a comparison between the flow waveforms generated by the model after personalization and the 4D Flow measurements for one representative subject. Across all subjects, the mean relative differences in net flow between model-based and the measurements were 8%, 10%, 10%, 6% and 5% at locations F1 to F5, respectively. Figure 2 compares the SBP and DBP values predicted by the model with the non-invasive measurements. The predictions of SBP were in close agreement with the measurements (bias= -1.593 mmHg and limits of agreement -9.769 and 6.582 mmHg), while predictions of DBP were, on average, underestimated (bias= -8.448 mmHg and limits of agreement -18.301 and 1.404 mmHg). Changes in some of the simulated hemodynamic variables during a cardiac cycle are shown in Figure 3.Discussion
The
proposed imaging-modelling approach represents an improvement relative to
previous methods for personalizing lumped-parameter models which often require
invasive measurements or only provide a small subset of subject-specific
parameters. The flow waveforms and pressures generated by the model using
exclusively noninvasive data were in good agreement with the 4D Flow
measurements. The model allows for computing variables, such as the
pressure-volume loop, that cannot be obtained non-invasively. Further studies
should focus on validating the model in a larger group of subjects, preferably including
a comparison with invasive measurements.Conclusion
With further validation, the proposed approach could be used to provide decision-support through its integration of large volumes of patient-specific medical information and prediction of clinically important metrics that cannot be measured noninvasively.Acknowledgements
This work was supported by grants from the European Research Council; Grant number 3106121 and the Swedish Research Council; Grant number: 2014-6191References
1 Hann, C. E. et al. Unique parameter identification for cardiac diagnosis in critical care using minimal data sets. Comput Methods Programs Biomed 99, 75-87,(2010).
2 Sughimoto, K. et al. Assessment of cardiovascular function by combining clinical data with a computational model of the cardiovascular system. J Thorac Cardiovasc Surg 145, 1367-1372,(2013).
3 Pant, S. et al. Data assimilation and modelling of patient-specific single-ventricle physiology with and without valve regurgitation. J Biomech 49, 2162-2173,(2016).
4 Keshavarz-Motamed, Z. et al. Non-Invasive Determination of Left Ventricular Workload in Patients with Aortic Stenosis Using Magnetic Resonance Imaging and Doppler Echocardiography. PLoS One 9, e86793,(2014).
5 Suga, H., Sagawa, K. & Shoukas, A. A. Load Independence of the Instantaneous Pressure-Volume Ratio of the Canine Left Ventricle and Effects of Epinephrine and Heart Rate on the Ratio. Circ Res 32, 314-322,(1973).
6 Sun, Y., Sjoberg, B. J., Ask, P., Loyd, D. & Wranne, B. Mathematical model that characterizes transmitral and pulmonary venous flow velocity patterns. Am J Physiol 268, H476-489,(1995).
7 Garcia, D., Pibarot, P., Dumesnil, J. G., Sakr, F. & Durand, L.-G. Assessment of Aortic Valve Stenosis Severity: A New Index Based on the Energy Loss Concept. Circulation 101, 765-771,(2000).
8 Moré, J. J. in Numerical Analysis: Proceedings of the Biennial Conference Held at Dundee, June 28–July 1, 1977 (ed G. A. Watson) 105-116 (Springer Berlin Heidelberg, 1978).
Figures