2832
The feasibility of correcting for through-plane heart motion on phase contrast aortic blood flow measurements using feature tracking cine-MRIAlexander Johansson1, Frida Svensson2,3, Åse Johnsson3,4, and Kerstin Magdalena Lagerstrand2,3
1Dept of Radiology, Sahlgrenska University Hospital, Gothenburg, Sweden, Sahlgrenska University Hospital, Gothenburg, Sweden, 2Dept. of Medical Physics and Techniques, Sahlgrenska University Hospital, Gothenburg, Sweden, Sahlgrenska University Hospital, Gothenburg, Sweden, 3Institute of Clinical Sciences, Sahlgrenska Academy, University of Gothenburg, Gothenburg, Sweden, 4Dept of Radiology, Sahlgrenska University Hospital, Gothenburg, Sweden, Sahlgrenska University Hospital
Synopsis
Phase contrast measurements are prone to velocity offsets due to through-plane motion of the heart. Here we present a promising method for correction of through-plane heart motion on phase contrast aortic blood flow measurements. The method, which utilizes the inherent information in conventional cine MR images for tracking of the aortic valve, was shown to be both robust and accurate. The reliability, but also the availability of the method makes it an attractive tool for correction of velocity offsets due to through-plane heart motion.
Purpose
Phase contrast (PC) aortic blood flow measurements are prone to velocity offsets due to through-plane motion of the heart, which may be of clinical significance for the grading of aortic valve regurgitation [1]. This work aim to investigate the feasibility of correcting for through-plane heart motion on PC aortic blood flow measurements using feature tracking cine-MRI.Methods
Ten healthy volunteers were examined with cardiac MRI on a 1.5T scanner (Achieva, Philips Healthcare, Best, The Netherlands). The examination protocol included PC blood flow and cardiac measurements at the level of the ST-junction and at the basal section of the septum (FOV=320x260mm2, voxel=2.5x2.5mm2, slice=6mm, flip=12°, TR=4.8ms, TE=2.9ms, frames=40, acc=2), and high-time-resolved cine-MRI measurements in 3CH- and LVOT-views (FOV=320x260mm, voxel=1.7x1.7mm, slice=8mm, flip=60°, TR=3.4ms, TE=1.7ms, frames=30, acc=2). The velocity of the heart was derived using manual tracking of the aortic valve in the 3CH and LVOT cine-MR images. Differences in the position of the tracking points between consecutive time frames were divided by the frame rate to calculate the through-plane heart velocity (Figure 1). The difference in the position of the tracking points was calculated using a reference to a point at the apex of the heart. From a subsample of the data (n=6), the repeatability of the tracking method was determined by one observer at two tracking sessions (separated by one month). Also, the reliability of the tracking method was determined by comparing the velocity data acquired from feature tracking cine-MRI with velocity data derived from the PC cardiac measurements. The peak heart velocities at systole and diastole were determined. Finally, the effect of through-plane motion on PC aortic blood flow measurements was visualized in flow-rate-time-curves and presented as flow volume errors.Results
Through-plane-heart-velocity-curves derived from feature tracking cine-MRI displayed similar appearance as curves derived from the direct measurements of heart velocity using PC cardiac MRI. The curves clearly displayed the isovolumetric contraction and relaxation of the heart as one broad peak of negative velocity during systole (peak heart velocity = 8 ± 2 cm/s) and as two narrow peaks of positive velocity at early (12 ± 3 cm/s) and late diastole (7 ± 2 cm/s). The relaxation of the heart was also seen in the blood flow rate curves (Figure 2). The variation in the peak heart velocity at repeated time instances was 10 ± 6%. The flow volume error from through-plane heart motion to the aortic flow volume was estimated from the through-plane heart velocity time curve and the number of pixels over the aortic vessel area to 8 ± 2 ml at systole and 8 ± 2 ml at diastole.Discussion
Results show that trough-plane motion affects the appearance of the blood flow rate curve and, hence, the quantification of aortic regurgitation using PC blood flow measurements. Results further show that correction of though-plane heart motion is feasible using feature tracking cine-MRI. The retrospective method, which relies on the inherent information in conventional cardiac MR images and therefore does not increase the load on the patient by additional scanning, showed both high reliability and reproducibility. The heart velocity data extracted from the cine-MRI images closely approximated the direct measurements of heart velocity, i.e. the PC cardiac measurements, and the variation in the heart velocity between tracking at repeated time instances was too small to be of clinical significance. Future work should focus on automatizing the feature tracking tool for improved workflow and robustness. Future studies are also warranted to indicate whether the method can be used to improve the MRI assessment of patients with valve insufficiency. We present such study in a separate abstract (“The importance of correcting for through-plane heart motion in the assessment of aortic regurgitation using PC-MRI as estimated by feature tracking cine-MRI”).Conclusion
This work presents a promising method for quantification and correction of through-plane heart motion in PC aortic blood flow measurements. The tracking method, which utilizes conventional cine-sequences normally included in the cardiac MRI protocol, was shown to be both robust and accurate. The reliability and the availability of the method makes it an attractive tool for correction of velocity offsets due to through-plane heart motion.Acknowledgements
No acknowledgement found.References
1. Kozerke S, Schwitter J, Pederson E, Boesiger P. Aortic and Mitral Regurgitation: Quantification Using Moving Slice Velocity Mapping. JMRI 14:106–112 (2001).Figures
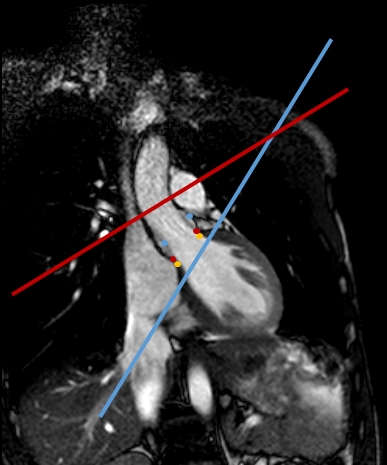
Figure 1. An image of the left ventricular outflow tract (LVOT) of the
heart acquired with cine-MRI during systole at the time frame of the highest heart
velocity. The red line represents the position of the PC blood flow image
plane, the blue line the PC cardiac image plane, and the red circles the
tracking points at the aortic valve for the actual time frame. The blue and
yellow circles represent the position of the valve at two other time frames, i.e. at early systole and at end systole.
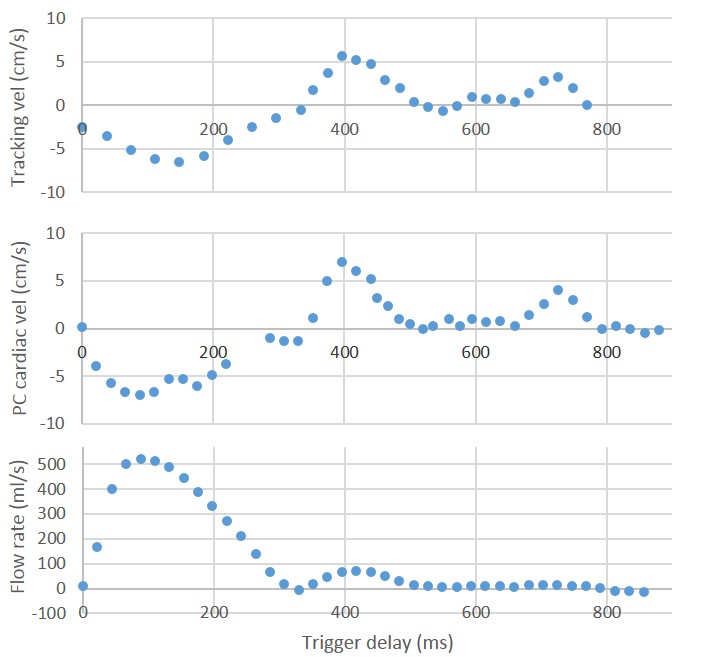
Figure
2. Through-plane heart velocity
curves derived from feature tracking cine-MRI and direct measurement of heart
velocity using PC cardiac MRI displaying the isovolumetric contraction during
systole and the relaxation of heart during diastole. The flow rate curves
displayed the blood outflow during systole and the coronary blood at end
systole, but also the relaxation of the heart as two discrete peaks at early
and late diastole.