2831
Distribution of 4D flow MRI-derived wall shear stress and oscillatory shear index and its relation with the ascending aorta dilation in bicuspid valve patients.1Hospital Universitari Vall d´Hebron, Department of Cardiology. Vall d’Hebron Institut de Recerca (VHIR). Universitat Autònoma de Barcelona. Barcelona. Spain, barcelona, Spain, 2Hospital Universitari Vall d´Hebron, Department of Cardiology. Vall d’Hebron Institut de Recerca (VHIR). Universitat Autònoma de Barcelona. Barcelona. Spain, 3Biomedical Imaging Center, Pontificia Universidad Católica de Chile, Department of Electrical Engineering, Pontificia Universidad Católica de Chile, 4Department of Structural and Geotechnical Engineering, Pontificia Universidad Católica de Chile, 5Biomedical Imaging Center, Pontificia Universidad Católica de Chile, Department of Electrical Engineering, Pontificia Universidad Católica de Chile.
Synopsis
Elevated WSS is atheroprotective but implies greater medial degradation. Lower WSS degenerates endothelium and determines aneurysm area with lower dilation and rupture risk. OSI distinguishes aneurysm for rupture. Through 4D-flow MRI we analyze WSS and OSI ascending aortic regional differences in 27 BAV patients and 11 controls. Despite average WSS and OSI do not different among TAV and BAV, RL-BAV and RN-BAV and dilated and non-dilated BAV, regional differences have been found. Of most interest, dilated BAVs have partially overlapping regions of lower WSS and high OSI in the distal-anterior ascending aorta which may explain ascending aorta dilation morphotype
PURPOSE
Although, wall shear stress (WSS) is the most investigated fluid dynamics parameter in clinical medicine there is still controversy about its role in the vascular disease. Elevated WSS induces an atheroprotective gene expression profile1, and degradation of the ascending aortic (AAo) tunica media2 that induces aneurysms formation. Low WSS has a negative effect on endothelial cells1 and it has proven to unveil areas with higher dilation3 and higher risk of rupture4 in cerebral aneurysm. Due to these discrepancies of the WSS, other risk factors have been identified. Atherosclerosis-susceptible vascular areas have demonstrated to correspond to regions slow and highly-variable in time blood flow1. The oscillatory shear index (OSI) has been proposed as a new risk marker, and high values were associated with an increased risk of aneurysm rupture4. The aim of the present study is to analyze regional differences in WSS magnitude and OSI in a population of bicuspid aortic valve patients (BAV) and their role in the presence of aortopathy.METHODS
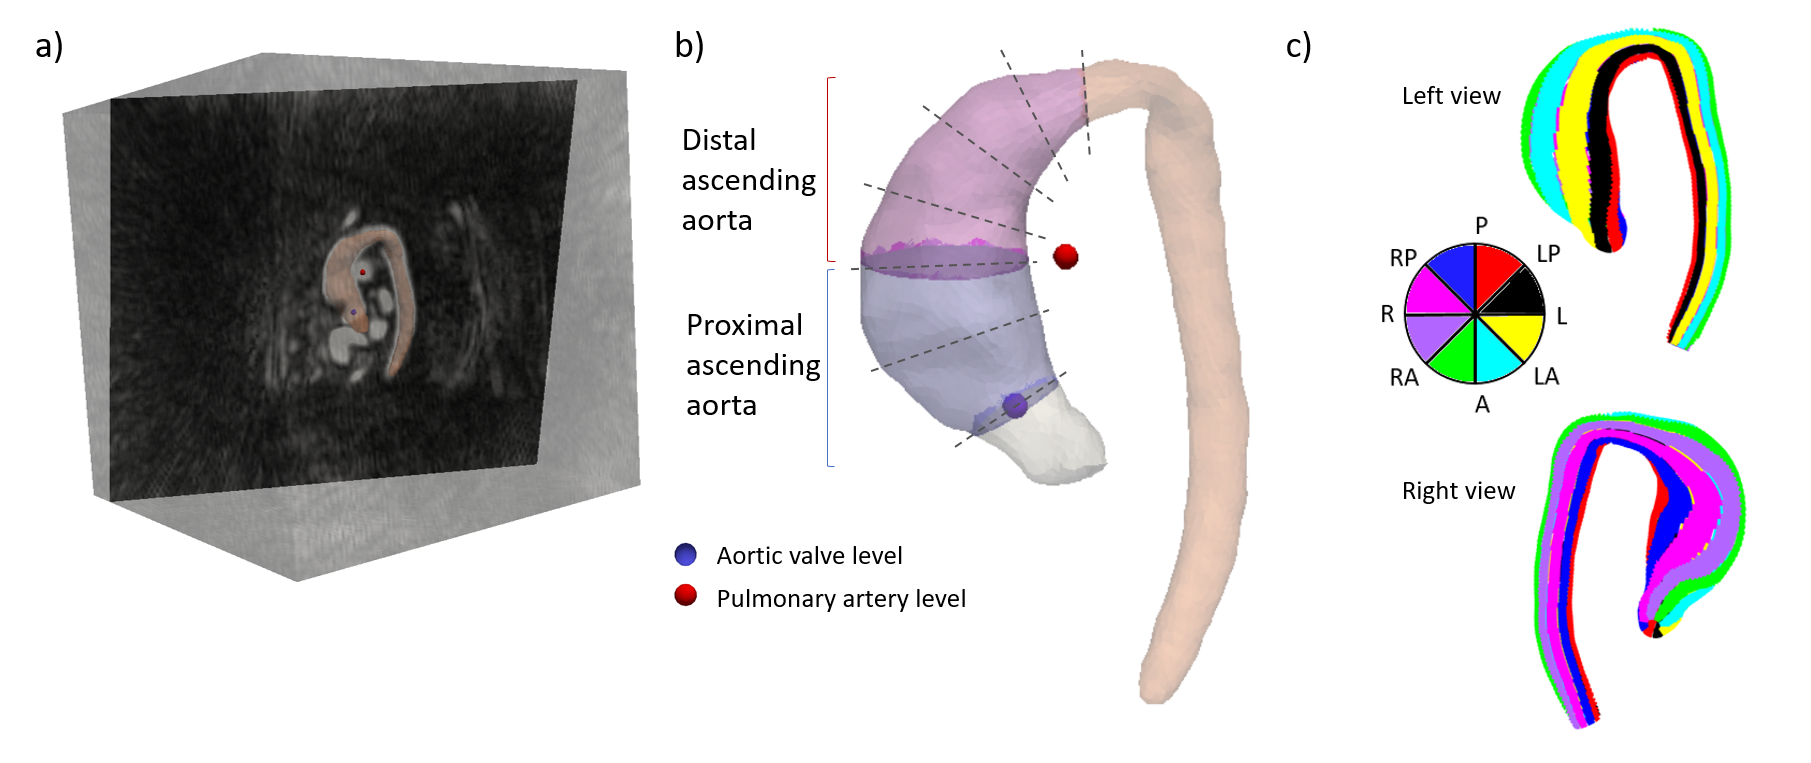
Twenty-seven patients with RL- or RN-BAV phenotype, aortic root and AAo diameters ≤46 mm and no severe valvular disease were prospectively recruited. Eleven age- and aortic diameter-matched tricuspid valve (TAV) volunteers were studied. CMR studies were performed on a GE 1.5T Signa scanner (GE Healthcare, Waukesha, WI, USA). The protocol included 2D bSSFP cine imaging and a 4D phase-contrast CMR acquisition with retrospective ECG-gating during free-breathing. For 4D-flow CMR, PCVIPR sequence5, a radially undersampled acquisition with 5-point balanced velocity encoding was used6. The acquisition volume included the entire thoracic aorta. WSS magnitude and OSI maps were computed for all the subjects from 4D-flow MRI images. A recently-proposed technique for WSS and OSI quantifications from 3D cine PC-MRI7 through a semi-automatic FE technique was improved to spam all three dimensions. We analyzed the AAo starting from the aortic root until the mid-aortic arch. This volume was divided in 2 parts based on a plane crossing the center of the pulmonary artery: proximal and distal ascending aorta (Figure 1). Afterwards, we divided the proximal part in 2 equally-spaced regions and the distal part in 4. Each region was further divided in 8 segments along the circunference. Figure 1 summarizes the methods.RESULTS
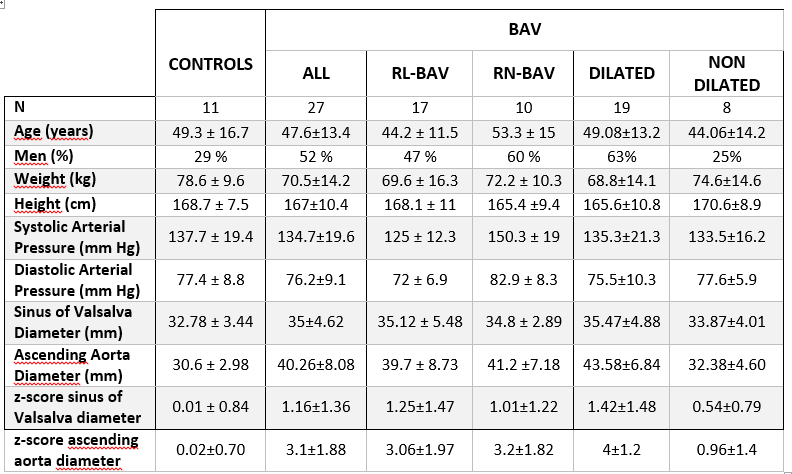
Demographic characteristics and aortic diameters among groups are shown in Table 1.
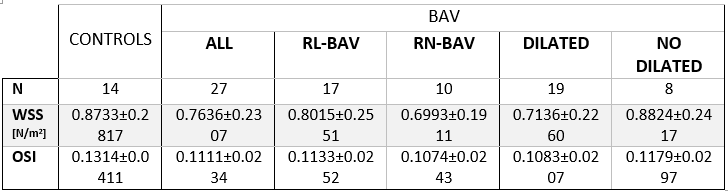
Mean AAo WSS magnitude and OSI in controls and BAV depending on BAV phenotype and AAomorphotype are reported in table 2. A two-tailed P value < 0.05 was considered statistically significant.
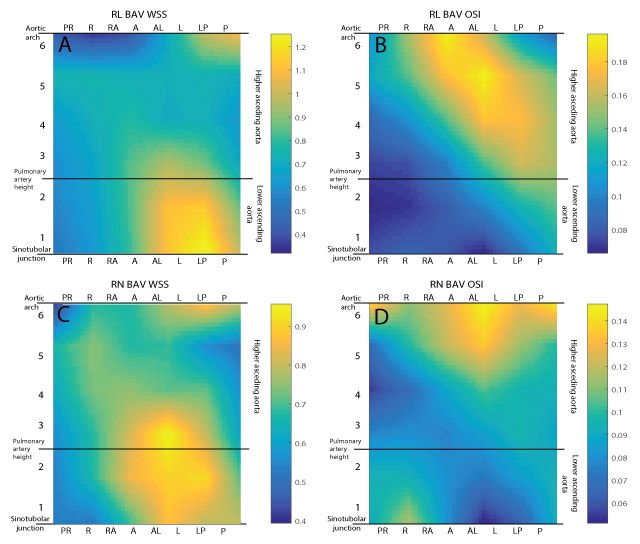
Compared to BAV patients, controls presented higher WSS magnitude (0.8733 vs 0.7636 [N/m2]) and OSI in the AAo (0.1314 vs 0.1111) but differences were not statistically significant (P=0.23 and P=0.055, respectively). RL-BAV patients compared to RN- presented higher, but not statistically significant, systolic WSS magnitude (0.8015 vs 0.6993 N/m2; P=0.284) and OSI (0.1133 vs 0.1074; P=0.553). Average values of WSS and OSI presented no significant differences between dilated and non-dilated BAV patients (see table 2). RL- and RN-BAV patients presented similar patterns of WSS magnitude (figure 2A -C). Differently, OSI was higher in the proximal and distal AAo in RN-BAV, whereas it was high in the mid-to-distal in RL-BAV patients (figure 2B-D).
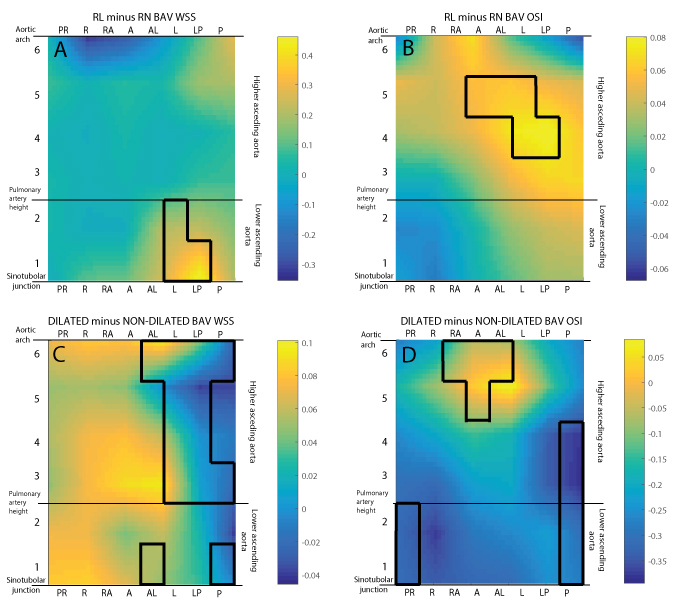
These differences were statistically significant in the proximal left AAo for the WSS magnitude and in the mid-to-distal left AAo for the OSI (see figure 4A-B).
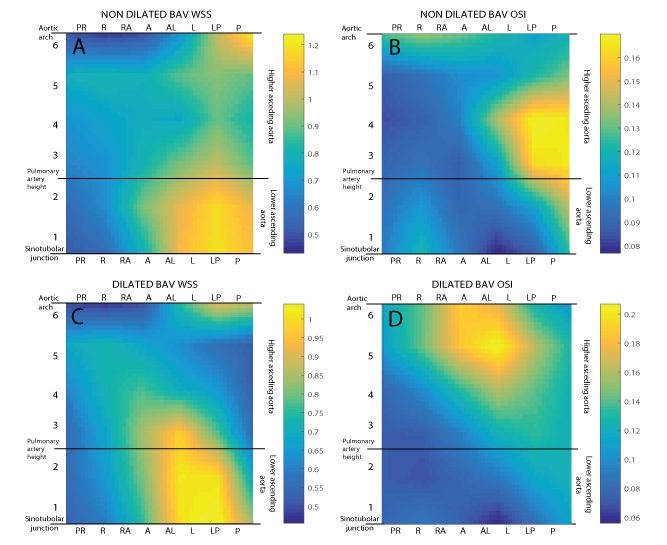
Patients with aortic dilation presented higher WSS magnitude in the proximal and mid left AAo with high OSI in the distal anterior area (see figure 3C-D). Non-dilated BAV presented high WSS in the proximal and distal left-posterior AAo and high OSI in the mid posterior part (see figure 3A-B). Statistically significant differences were observed, with a marked reduction in WSS magnitude in the left-posterior AAo and a higher OSI in the distal anterior AAO in dilated BAV (see figure 4C-D).
DISCUSSION
RL-BAV patients
presented higher WSS magnitude in the proximal-left
AAo and OSI in the mid-to-distal left AAo. Patients with aortic dilation
presented low WSS magnitude in the mid and distal
left-posterior AAo and an increase OSI in the distal-anterior AAO. In the
distal-anterior AAo, dilated BAV patients presented an area with both
statistically significant lower WSS magnitude and higher OSI.
The pattern of
locally low WSS magnitude and high OSI observed in our study in patient with AAo
dilation may explain ascending aorta dilation morphotype. A deeper analysis of
our population may unveil the correlation between these results and morphotypic
expression.CONCLUSION
In the distal-anterior AAo, dilated BAV patients presented an area with both low WSS magnitude and high OSI which may explain ascending aorta dilation morphotype.Acknowledgements
Guala A. has received funding from the European Union Seventh Framework Programme FP7/People under grant agreement n° 267128References
1. Malek, AM, SL Alper, y S Izumo. «Hemodynamic shear stress and its role in atherosclerosis.» JAMA, nº 21 (1999): 2035-2042.
2.
Guzzardi, DG, y
otros. «Valve-Related Hemodynamics Mediate Human Bicuspid Aortopathy: Insights
From Wall Shear Stress Mapping.» JACC 66, nº 8 (2015): 892-900.
3. Boussel, L. «Aneurysm growth occurs at region of low wall shear stress: Patient-specific correlation of hemodynamics and growth in a longitudinal study.» Stroke 39, nº 11 (2008): 2997-3002
4. Miura, Y. «Low wall shear stress is independently associated with the rupture status of middle cerebral artery aneurysms.» Stroke 44, nº 2 (2013): 519-521.
5. Gu, T, et al. «PC VIPR: a high-speed 3D phase-contrast method for flow quantification and high-resolution angiography.» AJNR Am J Neuroradiol 26 (2005): 743-9.
6. Johnson, KM, y M Markl. «Improved SNR in phase contrast velocimetry with five-point balanced flow encoding.» Magn Reson Med. 63 (2010): 349-55.
7.
Sotelo, J, et al
«3D quantification of wall shear stress and oscillatory shear index using a
finite-element method in 3D CINE PC-MRI data of the thoracic aorta.» IEEE Transactions on Medical Imaging, 2016.
Figures