2830
A novel platform to study hemodynamics and morphology in an ex vivo carotid artery model under pulsatile flow conditions1Medizinische Klinik und Poliklinik I, Universitätsklinikum Würzburg, Würzburg, Germany, 2Experimentelle Physik V, Universität Würzburg, Würzburg, Germany, 3Institut für Diagnostische und Interventionelle Neuroradiologie, Universitätsklinikum Würzburg, Würzburg, Germany, 4Deptartment of Tissue Engineering and Regenerative Medicine, Universitätsklinikum Würzburg, Würzburg, Germany, 5Fraunhofer IIS, Fraunhofer EZRT, Magnetresonanz- und Röntgenbildgebung (MRB), Würzburg, Germany
Synopsis
Biological artery models, cultured in a bioreactor-platform with adjustable pulsatile flow conditions, represent a potential in vitro test system for atherosclerosis research and provide a suitable tool for the development of new flow quantification techniques as well as studies of arterial elasticity and flow dynamics ex vivo and in vitro. A major requirement for these studies is viable motion synchronization in order to achieve time-resolved flow measurements. We present a new platform that uses self-navigation instead of external trigger signals for measurements of 2D- and 4D flow dynamics, vessel wall morphology and quantifications of arterial pulse-wave-velocity and wall shear stress.
Purpose
The knowledge of the correlation between arterial pulse-wave-velocity (PWV) and endothelial wall shear stress (WSS) is of great relevance to understand the interaction of arterial stiffness with pathologic flow patterns. Non-invasive measurements of these parameters using flow MRI in vivo are challenging due to long measurement times and limited spatiotemporal resolution. Flow phantoms are a major requirement for the development of fast and robust flow quantification techniques. However, artificial vessel phantoms often consider only the flow patterns but neglect the elastic properties of the blood vessels. At this point, tissue engineering poses a potential alternative to conventional flow phantoms since tissue-engineered arteries have similar physical properties than native arteries1 and enable the study of pathologies in controlled environments. In this abstract we present a setup for studying arterial hemodynamics ex vivo under realistic conditions. A modular bioreactor platform with a pulsatile perfusion pump2 was used to mimic the in vivo blood circulation. Radial acquisitions and self-navigation were applied for retrospective cine reconstructions.Materials and Methods
Experimental setup
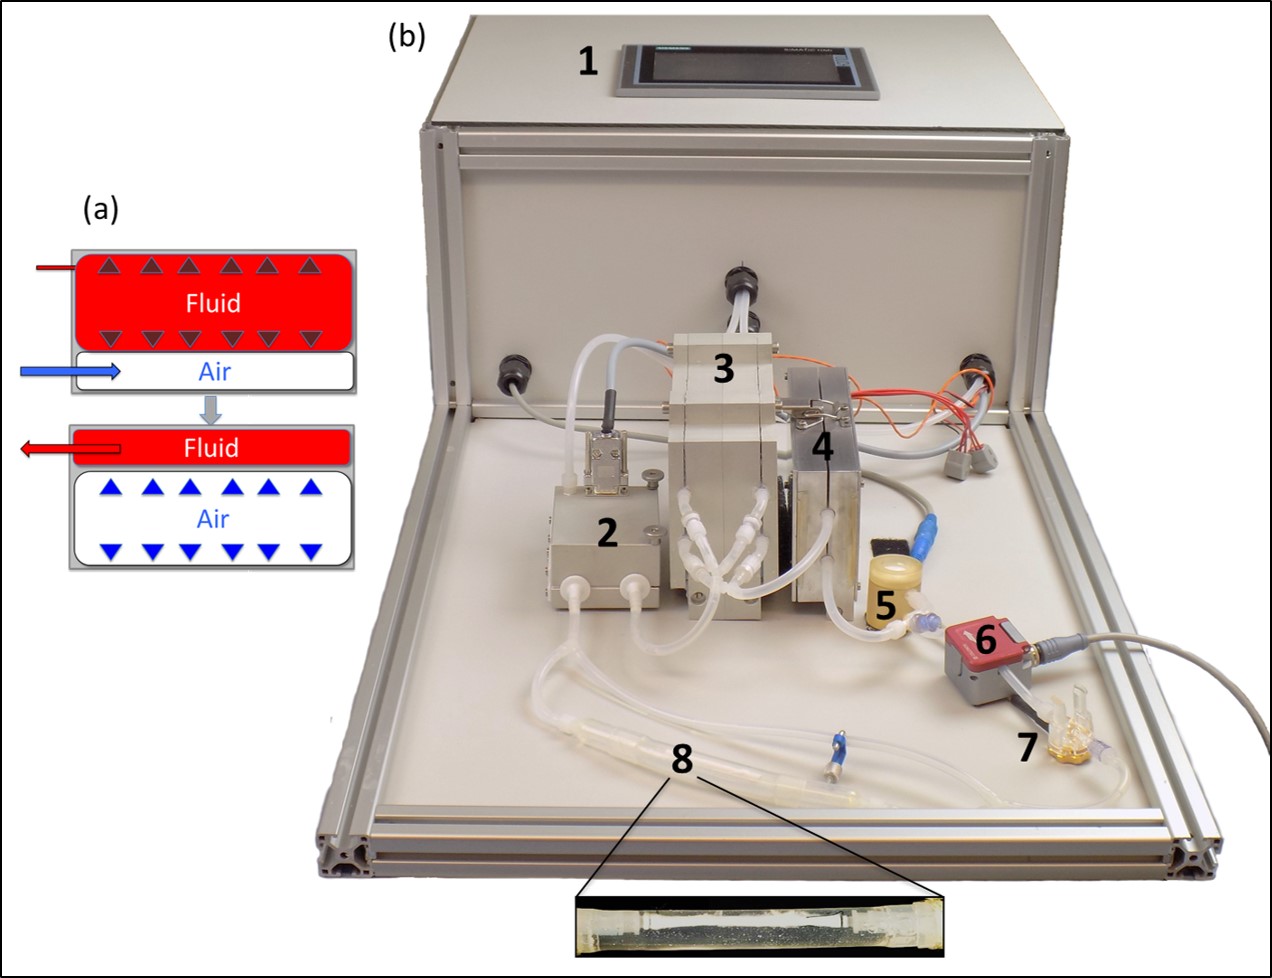
Carotid arteries were obtained from German landrace pigs and were inserted into a tissue chamber (Fig. 1). A pulsatile flow with a pressure of 120/80 mmHg, adjustable flow rates and pump frequencies was realized with an air-driven perfusion pump2 (Fig. 1 a&b). As fluid VascuLife® Medium (CellSystems Biotechnologie Vertrieb GmbH) was used.
MR measurements
Measurements were conducted on a 17.6T MRI scanner with a 1 T/m gradient system and a 24 mm birdcage coil. For flow measurements radial 2D- and 4D-PC MRI sequences were used. The scan parameters were: VENC=150 cm/s (2D)/167 cm/s (4D). TR/TE=3.0/1.1 ms, FOV = 25x25x10 mm3 (4D). Morphology was imaged with a flow compensated radial 3D-FLASH sequence (TR/TE=4/1.5 ms, FOV = 25x25x10 mm3). The total measurement time was 2.4 minutes (2D) and 32 minutes (4D) for flow measurements and 4 minutes for morphology measurement. Self-navigation signals extracted from the radial MR signal were used for retrospective reconstructions, as described previously3. Flow cines were reconstructed with a frame rate of 120 frames (2D) and 30 frames (4D) per pump cycle. The spatial resolution was 100 µm (isotropic) for the flow measurements and 98 µm (isotropic) for the morphology measurement. All reconstructions were conducted with MATLAB (The MathWorks, Inc., Natick, USA).
PWV and WSS calculation
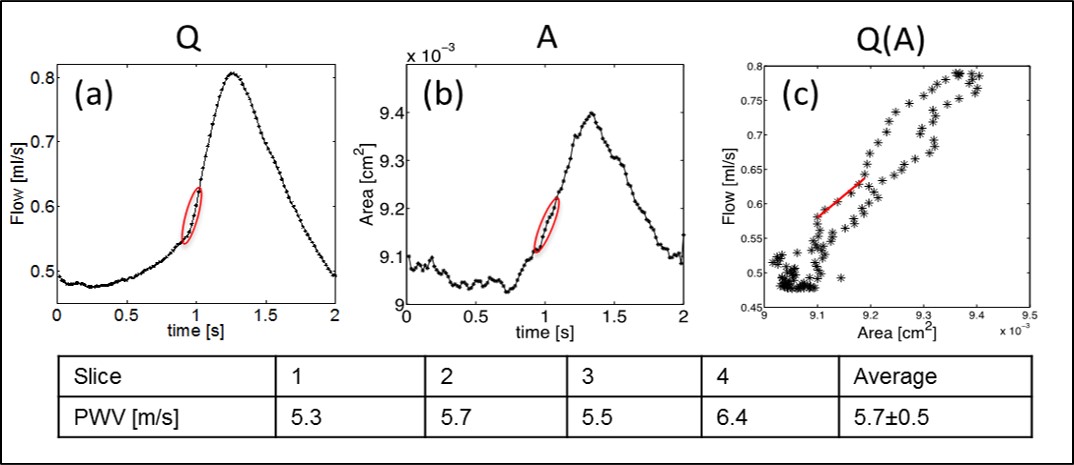
The local PWV was determined from the 2D flow measurements using the Q-A method described previously4. Using the data points of the early upstroke of the flow pulse, the PWV value can be assessed as the slope of a linear fit of the Q(A) curve, where Q(t) represents the volume flow and A(t) is the cross-sectional area of the artery. WSS was calculated from the 3D-velocity derivations at the vessel wall, which were determined with the 4D flow measurement using EnSight (CEI Systems, USA) for data processing5.
Results
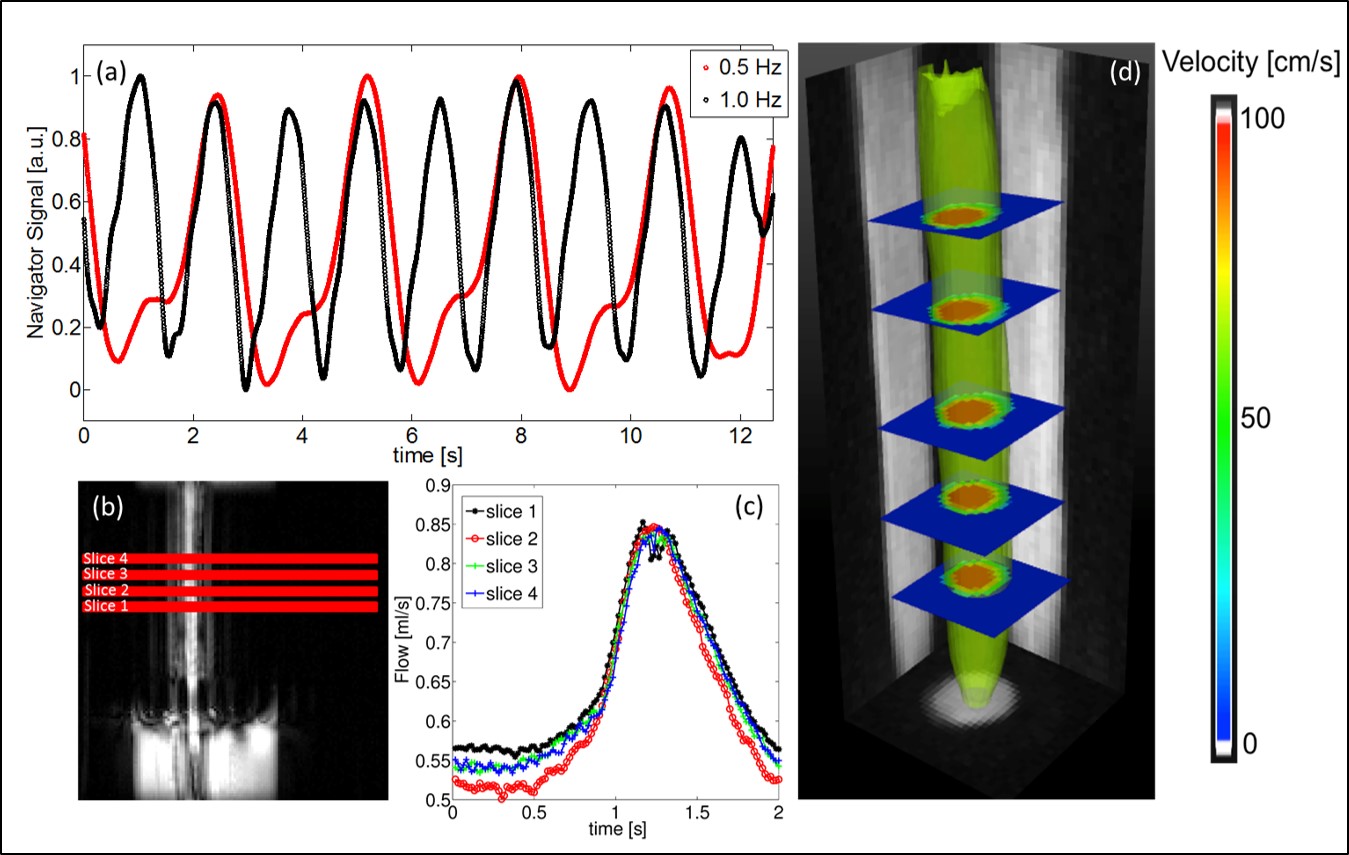
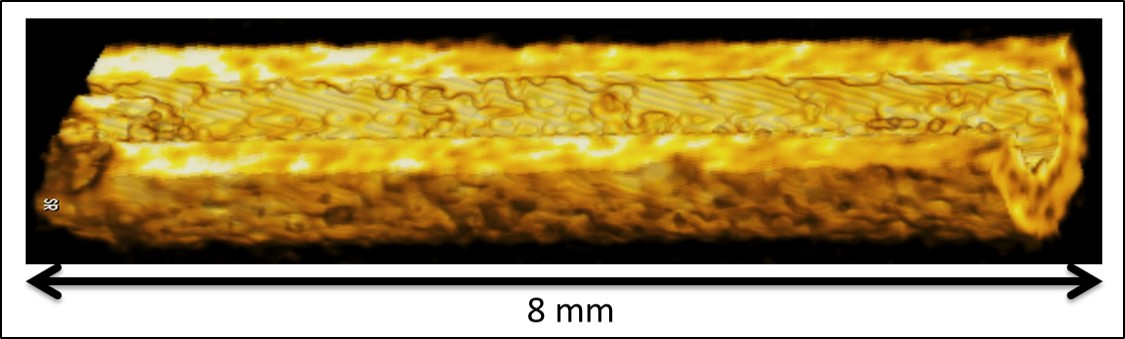
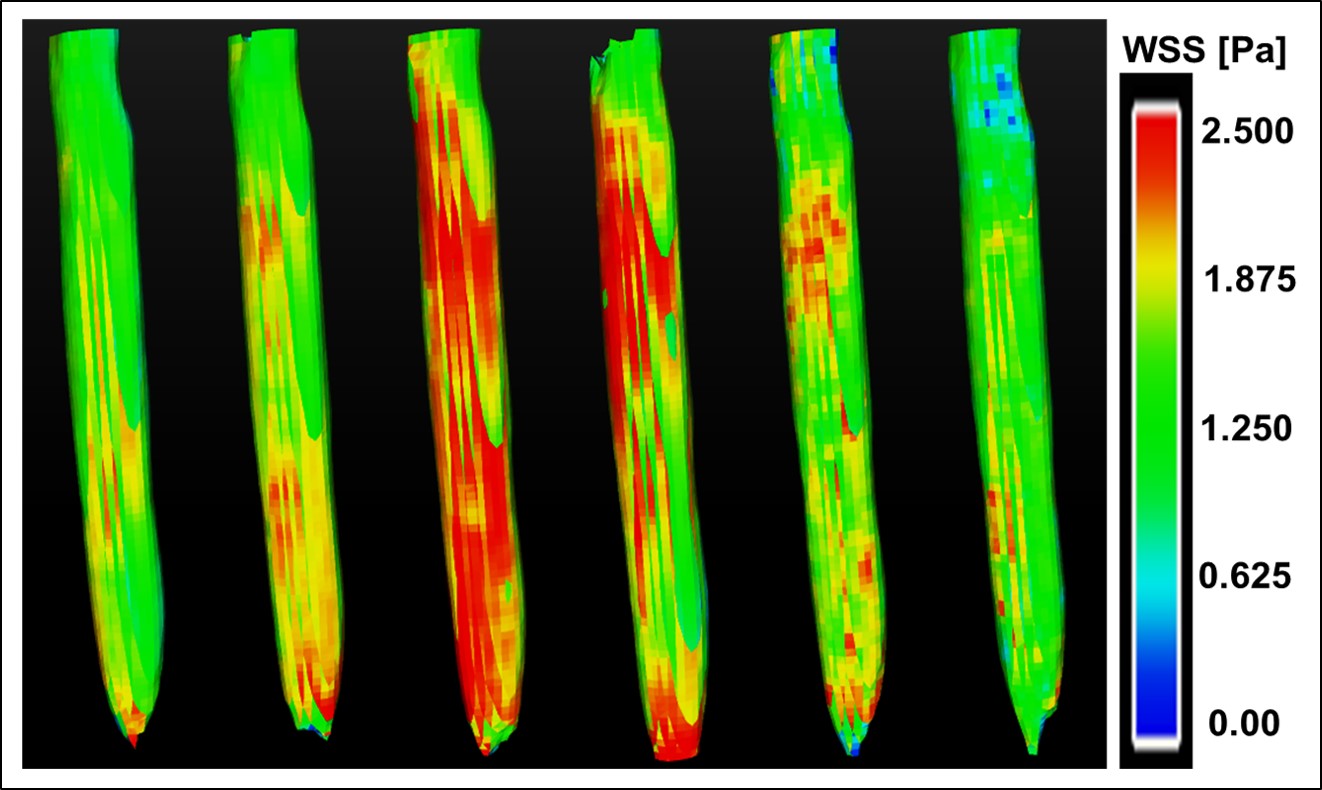
Self-navigation signals could successfully be extracted from the ex vivo measurements of carotid arteries. Fig. 2a shows exemplary signals acquired during 3D flow measurements at 2 different pump frequencies (0.5 Hz/1 Hz). The strong modulations due to the pulsatile flow are clearly visible. The pulsatile behavior is also reflected by the results of the 2D- (Fig. 2b&c) and 4D flow measurements (Fig. 2d). Figure 3 displays a volume rendering of the 3D morphology measurement. The local PWV was calculated at 4 different locations of the artery (Fig. 4). The mean PWV value over all slices was 5.7±0.5 m/s, which corresponds well with literature6. Figure 5 displays the calculated WSS for six phases of the pump cycle. The values are in good accordance with the results reported previously for porcine carotid arteries in vivo7.Discussion and Conclusion
This abstract demonstrates a suitable setup to study the hemodynamics of arteries ex vivo under physiological as well as pathological pulsatile flow conditions, e.g. high pressure values and exceeding shear rates. Since the proposed platform does not require additional trigger signals for synchronization with the MR measurements, it can be implemented easily on every MR scanner. This setup can also be used as a flow phantom for validation and optimization of new sequences and sequence parameters. In future applications, this platform is considered for measurements in tissue engineered arteries, which provide a suitable in vitro test system for atherosclerosis research. It offers a great possibility to examine the effects of specific biological modifications on the physical, flow dynamic properties as well as changes in vessel wall morphology in a fully controllable environment.Acknowledgements
This work was supported by grants from the Deutsche Forschungsgemeinschaft (SFB 688 B5, Z2), the Bundesministerium für Bildung und Forschung (BMBF01 EO1004) and the Comprehensive Heart Failure Center (CHFC).References
1. Zhao, et al, Biomaterials 31(2): 296-307.
2. Schuerlein, et al. Biotechnology Journal [2016].
3. Winter et al., JCMR [2013]; 15:88-98.
4. Herold et al., MRM [2009]; 61:1293-1299.
5. Stalder et al., MRM 60(5): 1218-1231.
6. Wentland et al., Journal of Magnetic Resonance Imaging 41.5 [2015]: 1475-1485.
7. Millon, Antoine, et al., PloS one 10.11 [2015]: e0141880.
Figures