2825
Temporal variation of cerebrovascular transit time measured by BOLD-based time lag mapping1Human Brain Research Center, Kyoto University Graduate School of Medicine, Kyoto, Japan
Synopsis
A pilot study of perfusion-related signal component in fMRI signal, demonstrates possibility of measuring blood transit time variation by tracking BOLD lag through the vascular structure. Effect of short breath-holding and mild hyperventilation on the time-shift analysis of whole-brain BOLD signals were tested. Temporal variation of the relative BOLD transit time up to ±15% on average were found to be negatively correlated with the global BOLD signal change, which is consistent with the Central Volume Principle under the condition of small CBV change. This relative BOLD transit time is likely to reflect the global CBF/CBV dynamics with high temporal resolution.
Purpose
The explosive growth of resting-state fMRI research has led to a recognition of rich physiological noises that need to be removed in functional connectivity methods1,2. Recently, tracking a signal component of systemic origin has been reported to be a promising technique for evaluating brain perfusion dynamics 3–6. Delay of BOLD signal in cerebrovascular disease is not new 7, but this method called “lag mapping” has been shown to provide a new, noninvasive perfusion-related biomarker in normal conditions 3. Given that the signal component is intrinsic to blood, it may serve as a virtual contrast agent for augmented blood tracking that can observe instantaneous flow velocity.Methods
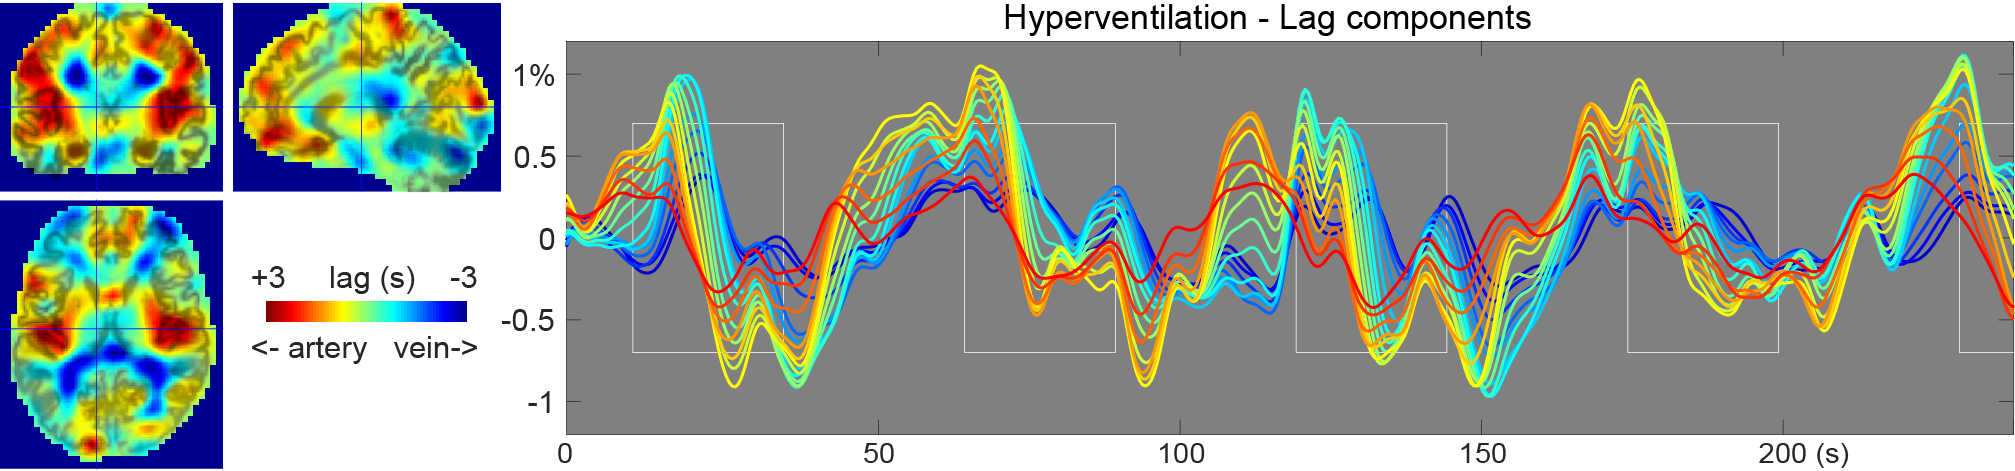
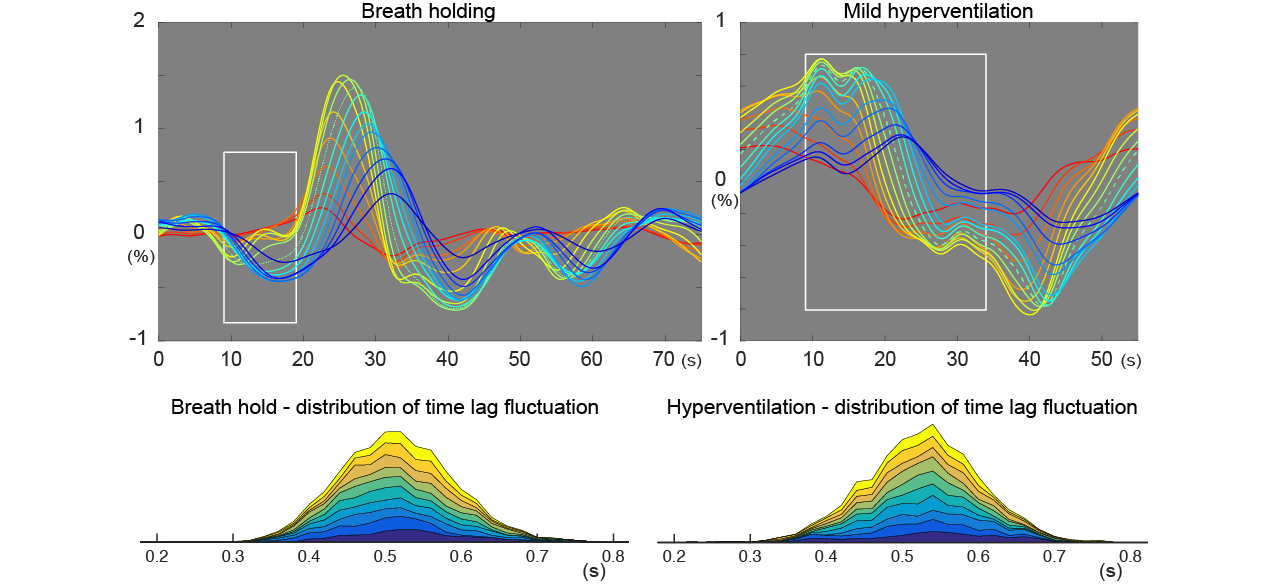
Two nine-minute fMRI runs were acquired from 10 subjects (3 female) on a Siemens 3T Tim Trio scanner with a gradient-echo multiband EPI (TR/TE = 500/33 ms; 35 slices; resolution = 3 × 3 × 3.5 mm3). Beat-to-beat fluctuations in mean arterial pressure and heart rate were obtained via a non-invasive MR compatible device (Caretaker, BIOPAC). During one run, subjects were instructed to immediately stop breathing at the appearance of “stop breathing” on the screen, irrespective of the respiratory phase, until the screen changes back to “relax” after 10s. This was repeated 5 times with a 90s interval. Another run was for hyperventilation, during which 5 second-respiratory cycles were repeated 5 times. Data were motion corrected and the 6 motion parameters were regressed out before spatial normalization to a template space. A modified recursive lag tracking method, with the global signal as the initial seed, was used to create lag maps 8,9. This procedure involves finding a set of voxels, using cross-correlation, sharing the delay relative to the current seed signal by 0.5s. These voxels were used as the seed for the next step with slightly different temporal profile in addition to the phase (Fig. 1). To measure the relative BOLD transit time (rBTT) from the resulting seed time courses, the fluctuation of relative phase between the neighboring seeds were calculated. The rBTT was calculated from 14 pairs of neighboring seeds corresponding to -3.5s - +3.5s lags. Owing to the broad frequency range of the lag structure, analytic methods such as Hilbert transform-based instantaneous phase were not appropriate. Hence a smooth sliding window algorithm was applied using a window length of 30 seconds and a Kaiser window with parameter of 4 to measure instantaneous time lag between those neighboring seeds. To facilitate the detection of small phase variation between 0.2 and 0.8s (centered at 0.5s owing to the resolution of the initial lag tracking), the seed signals were resampled to 0.02s resolution prior to this procedure. The local rBTT time courses from each pair of seeds were averaged to obtain the global rBTT. The raw rBTT value was then divided by 0.5s to express the relative change of velocity over time.
Results
Fig. 1 shows a subject’s lag map and the seed time courses. Reddish voxels are found in the vicinity of major arteries presenting long travelling time to the global signal phase, or early arrival of the component (reddish lines in the plot).
Fig. 2, top shows the group-averaged time courses from the two conditions. For the rBTT measurement, deviation of the time lag from 0.5s between two neighboring seeds for each time point and each individual were measured. The actual time lags exhibited a distribution roughly centered on 0.5s, as expected (Fig. 2, bottom).
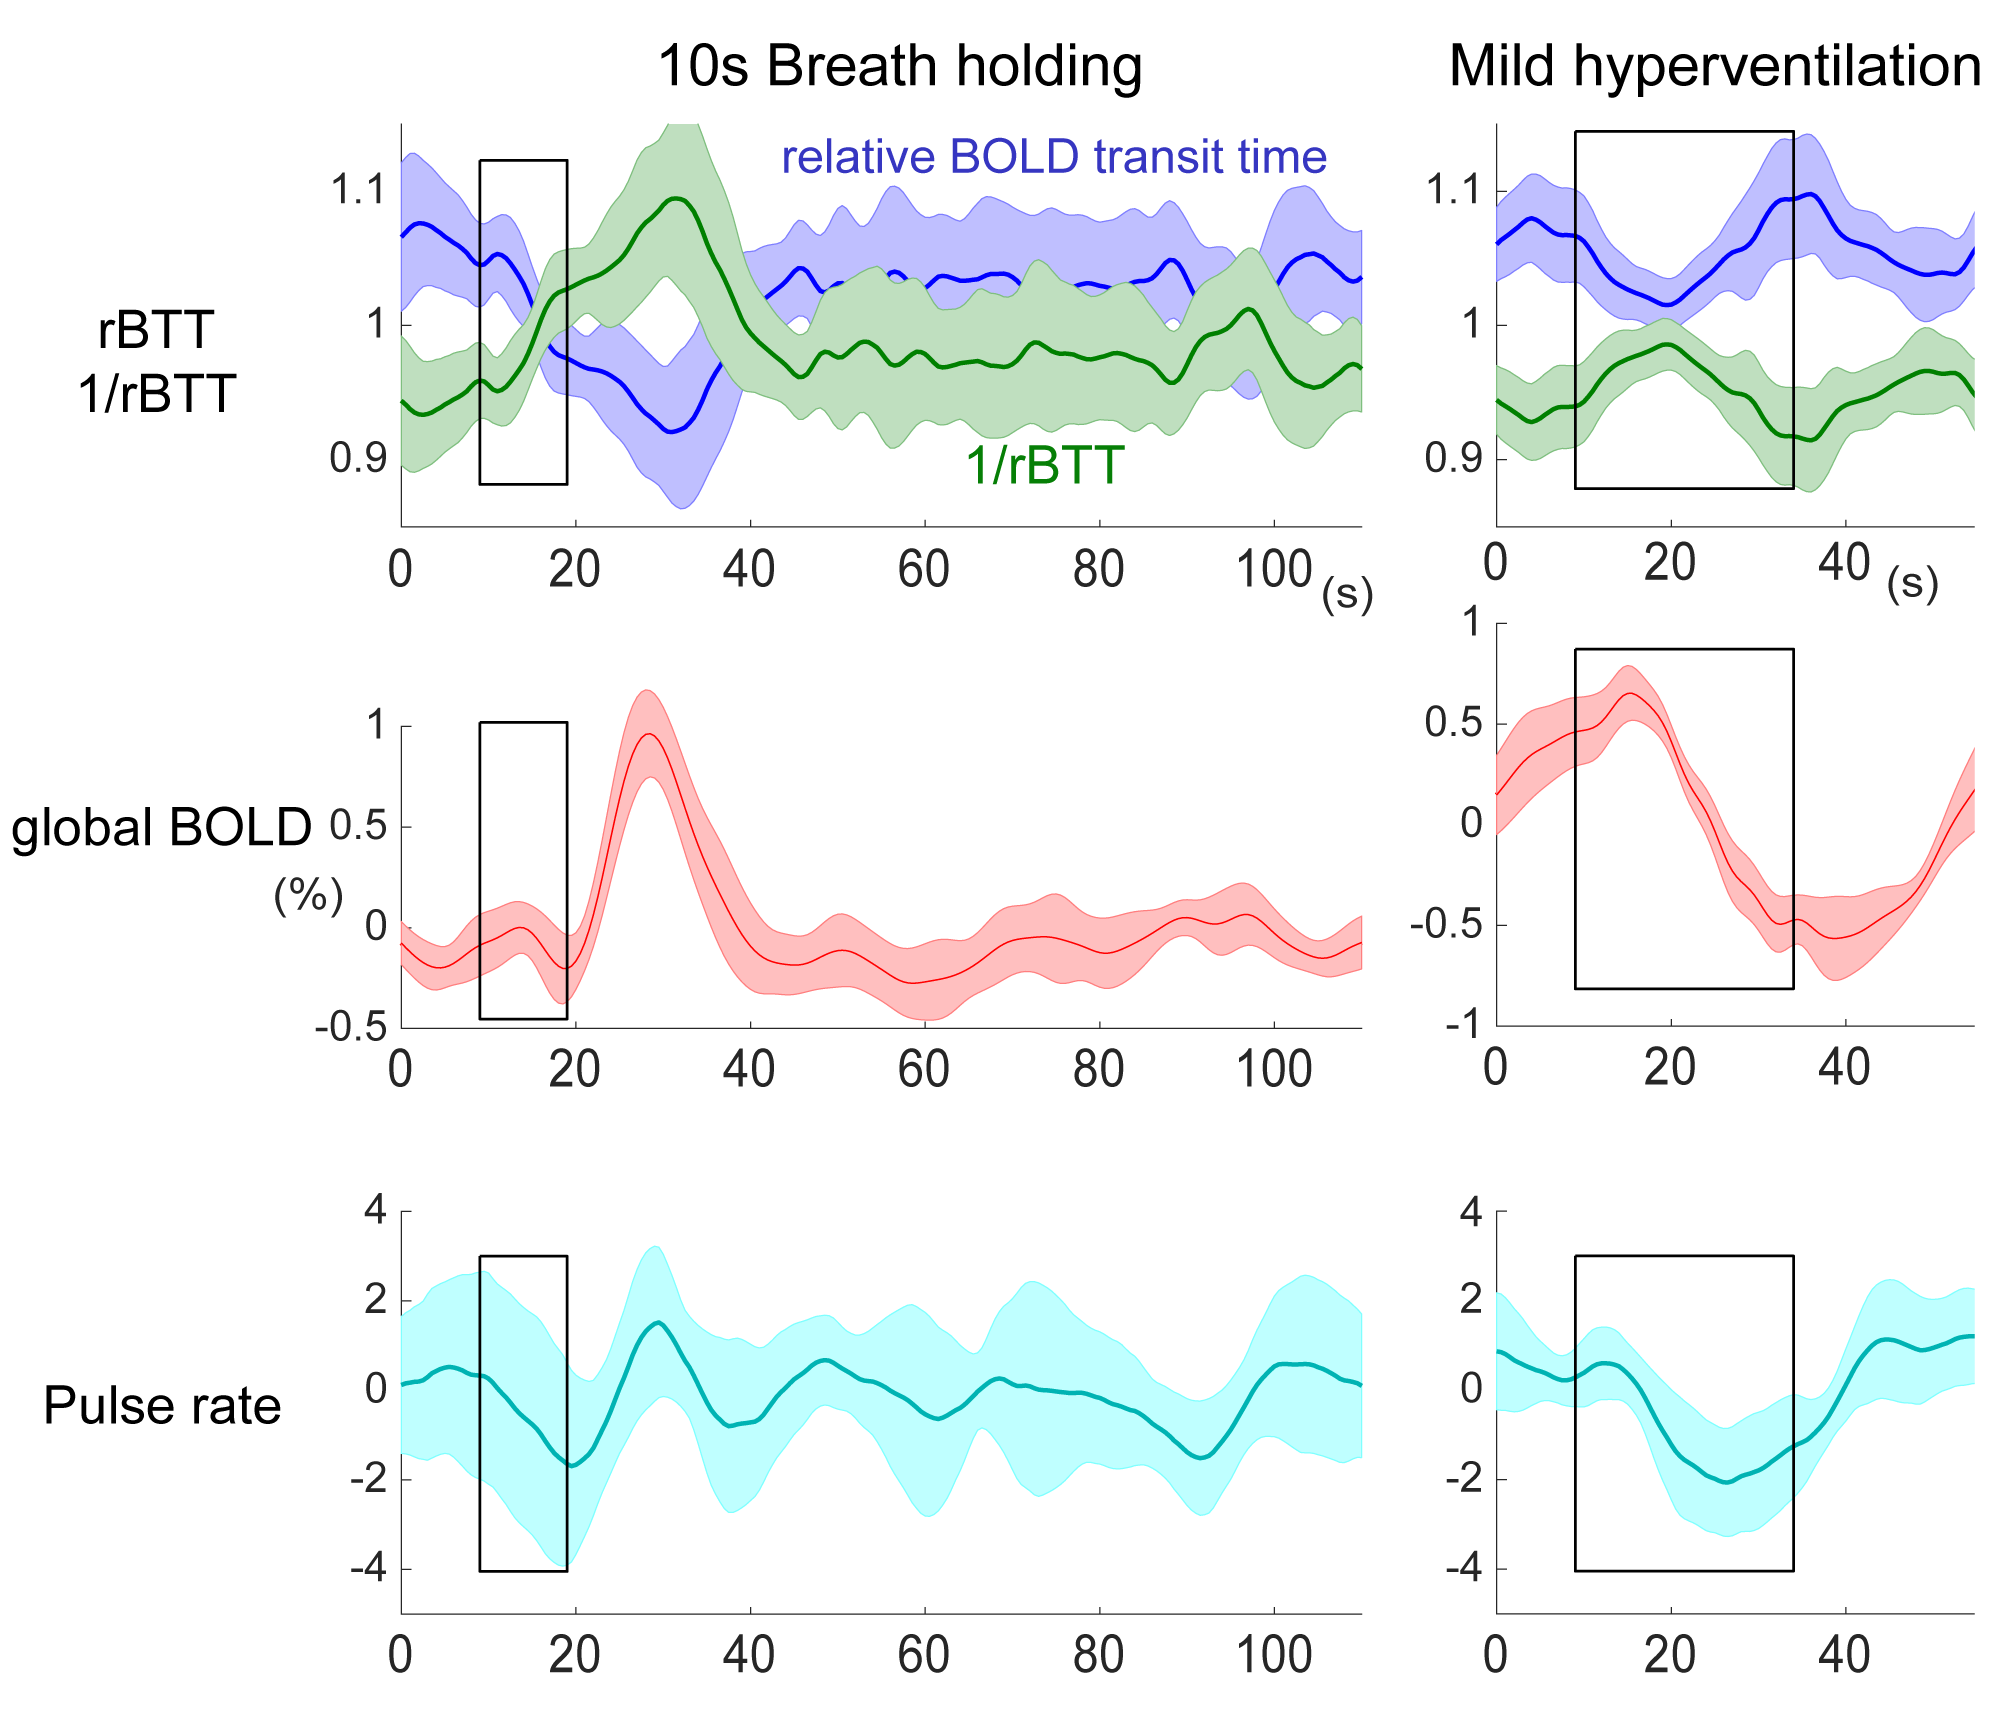
Fig. 3 shows the time courses of perfusion-related parameters. The global BOLD response showed delayed increase after the breath-holding period, consistent with a previous report 10. The rBTT (blue) was negatively correlated with the global BOLD time course (breath-holding, P=0.005; hyperventilation, P=0.008). No other combinations were statistically significant.
Discussion
Here we show that rBTT may reflect the gross flow velocity in a similar manner to mean transit time (CBV/CBF) by comparing it with the global BOLD. Although we chose mild forms of respiratory challenges to minimize CBV changes as possible while invoking global BOLD response, concomitant measurement of CBV is at least required to formally address this 11. Looking at the temporal profiles, there is interesting discrepancy between 1/rBTT and BOLD time courses. For example, the discrepancy is less evident in hyperventilation, presumably reflecting relatively low sensitivity of CBV to hypocapnia 12. The slightly delayed positive peaks in 1/rBTT may also reflect differential effect of CBF/CBV on these parameters. Further research is required to confirm the complex information embedded in the BOLD signal and the potential of this new technique to track the temporal variation of blood transit time.Acknowledgements
This work was supported by a grant from the Japan Society for the Promotion of Science (Grant-in-Aid for Scientific Research on Innovative Areas, 15H05875), Smoking Research Foundation and Takeda Science Foundation.References
1. Murphy K, Birn RM, Bandettini PA. Resting-state fMRI confounds and cleanup. Neuroimage. 2013;80:349–59.
2. Taylor Webb J, Ferguson M a., Nielsen J a., et al. BOLD granger causality reflects vascular anatomy. PLoS One. 2013;8(12):1–19.
3. Tong Y, Lindsey KP, Hocke LM, et al. Perfusion information extracted from resting state functional magnetic resonance imaging. J Cereb Blood Flow Metab. 2016;0271678X16631755.
4. Amemiya S, Kunimatsu A, Saito N, et al. Cerebral Hemodynamic Impairment: Assessment with Resting-State Functional MR Imaging. Radiology. 2013;270(2):1–8.
5. Lv Y, Margulies DS, Cameron Craddock R, et al. Identifying the perfusion deficit in acute stroke with resting-state functional magnetic resonance imaging. Ann Neurol. 2013;73(1):136–40.
6. Christen T, Jahanian H, Ni WW, et al. Noncontrast mapping of arterial delay and functional connectivity using resting-state functional MRI: A study in Moyamoya patients. J Magn Reson Imaging. 2015;41(2):424–30.
7. Shiino A, Morita Y, Tsuji A, et al. Estimation of cerebral perfusion reserve by blood oxygenation level-dependent imaging: comparison with single-photon emission computed tomography. J Cereb Blood Flow Metab. 2003;23(1):121–35.
8. Tong Y, Frederick B deB. Tracking cerebral blood flow in BOLD fMRI using recursively generated regressors. Hum Brain Mapp. 2014;35(11):5471–85.
9. Aso T, Nishida S, Urayama S, et al. Assessment of the Reproducibility of BOLD signal-based Hemodynamic MRI. In: Proceedings of the 23rd Annual Meeting of ISMRM. Toronto; 2015.
10. Magon S, Basso G, Farace P, et al. Reproducibility of BOLD signal change induced by breath holding. Neuroimage. 2009;45(3):702–12.
11. Chen JJ, Pike GB. MRI measurement of the BOLD-specific flow-volume relationship during hypercapnia and hypocapnia in humans. Neuroimage. 2010;53(2):383–91.
12. Rostrup E, Law I, Pott F, et al. Cerebral hemodynamics measured with simultaneous PET and near-infrared spectroscopy in humans. Brain Res. 2002;954(2):183–93.
Figures