2824
Voxel-by-Voxel 4D Flow Based Assessment of Retrograde Flow in the Aorta1Biomedical Engineering, Northwestern University, Chicago, IL, United States, 2Radiology, Northwestern University, Chicago, IL, United States
Synopsis
Retrograde fraction stratifies the degree of aortic regurgitation (AR) in patients with aortic valve disease. The purpose of this study was to develop 4D flow based voxel-by-voxel regional analysis of forward flow, reverse flow, and retrograde fraction with full volumetric coverage of the aorta. In a study with 10 subjects (5 healthy controls, 5 patients with AR), reverse flow and retrograde fraction maps were used to systematically analyze regional flow patterns and assess differences between standard (plane-wise) and voxel-by-voxel quantification of AR.
Purpose
Aortic valve regurgitation (AR) is an important disease of the aorta which is caused by valve deficiency1. Current methods for the evaluation of aortic valve regurgitation include 2D phase contrast MRI2 or 4D flow MRI3,4. AR severity is typically assessed using 2D analysis planes orthogonal to the aorta, calculating the fraction of retrograde flow (by dividing the net forward by the net reverse flow over the cardiac cycle through the 2D plane)5. While this method is used as the standard tool for the diagnosis of aortic regurgitation, it often misses important regional flow information. For example, flow recirculation next to forward flow jets may lead to considerable regional flow reversal – but may not result in net reverse flow for the standard plane-wise calculation. As a result, standard AR quantification can yield small or non-existent retrograde fraction although marked regional flow reversal is present. In addition, AR assessment based on 2D analysis planes may miss the region with the most pronounced flow reversal. The aim of this study was to develop 4D flow based voxel-by-voxel regional analysis of forward flow, reverse flow, and retrograde fraction with full volumetric coverage of the aorta. Reverse flow and retrograde fraction maps were used to visualize regional flow patterns and assess differences between standard (plane-wise) and voxel-by-voxel quantification of AR.Methods
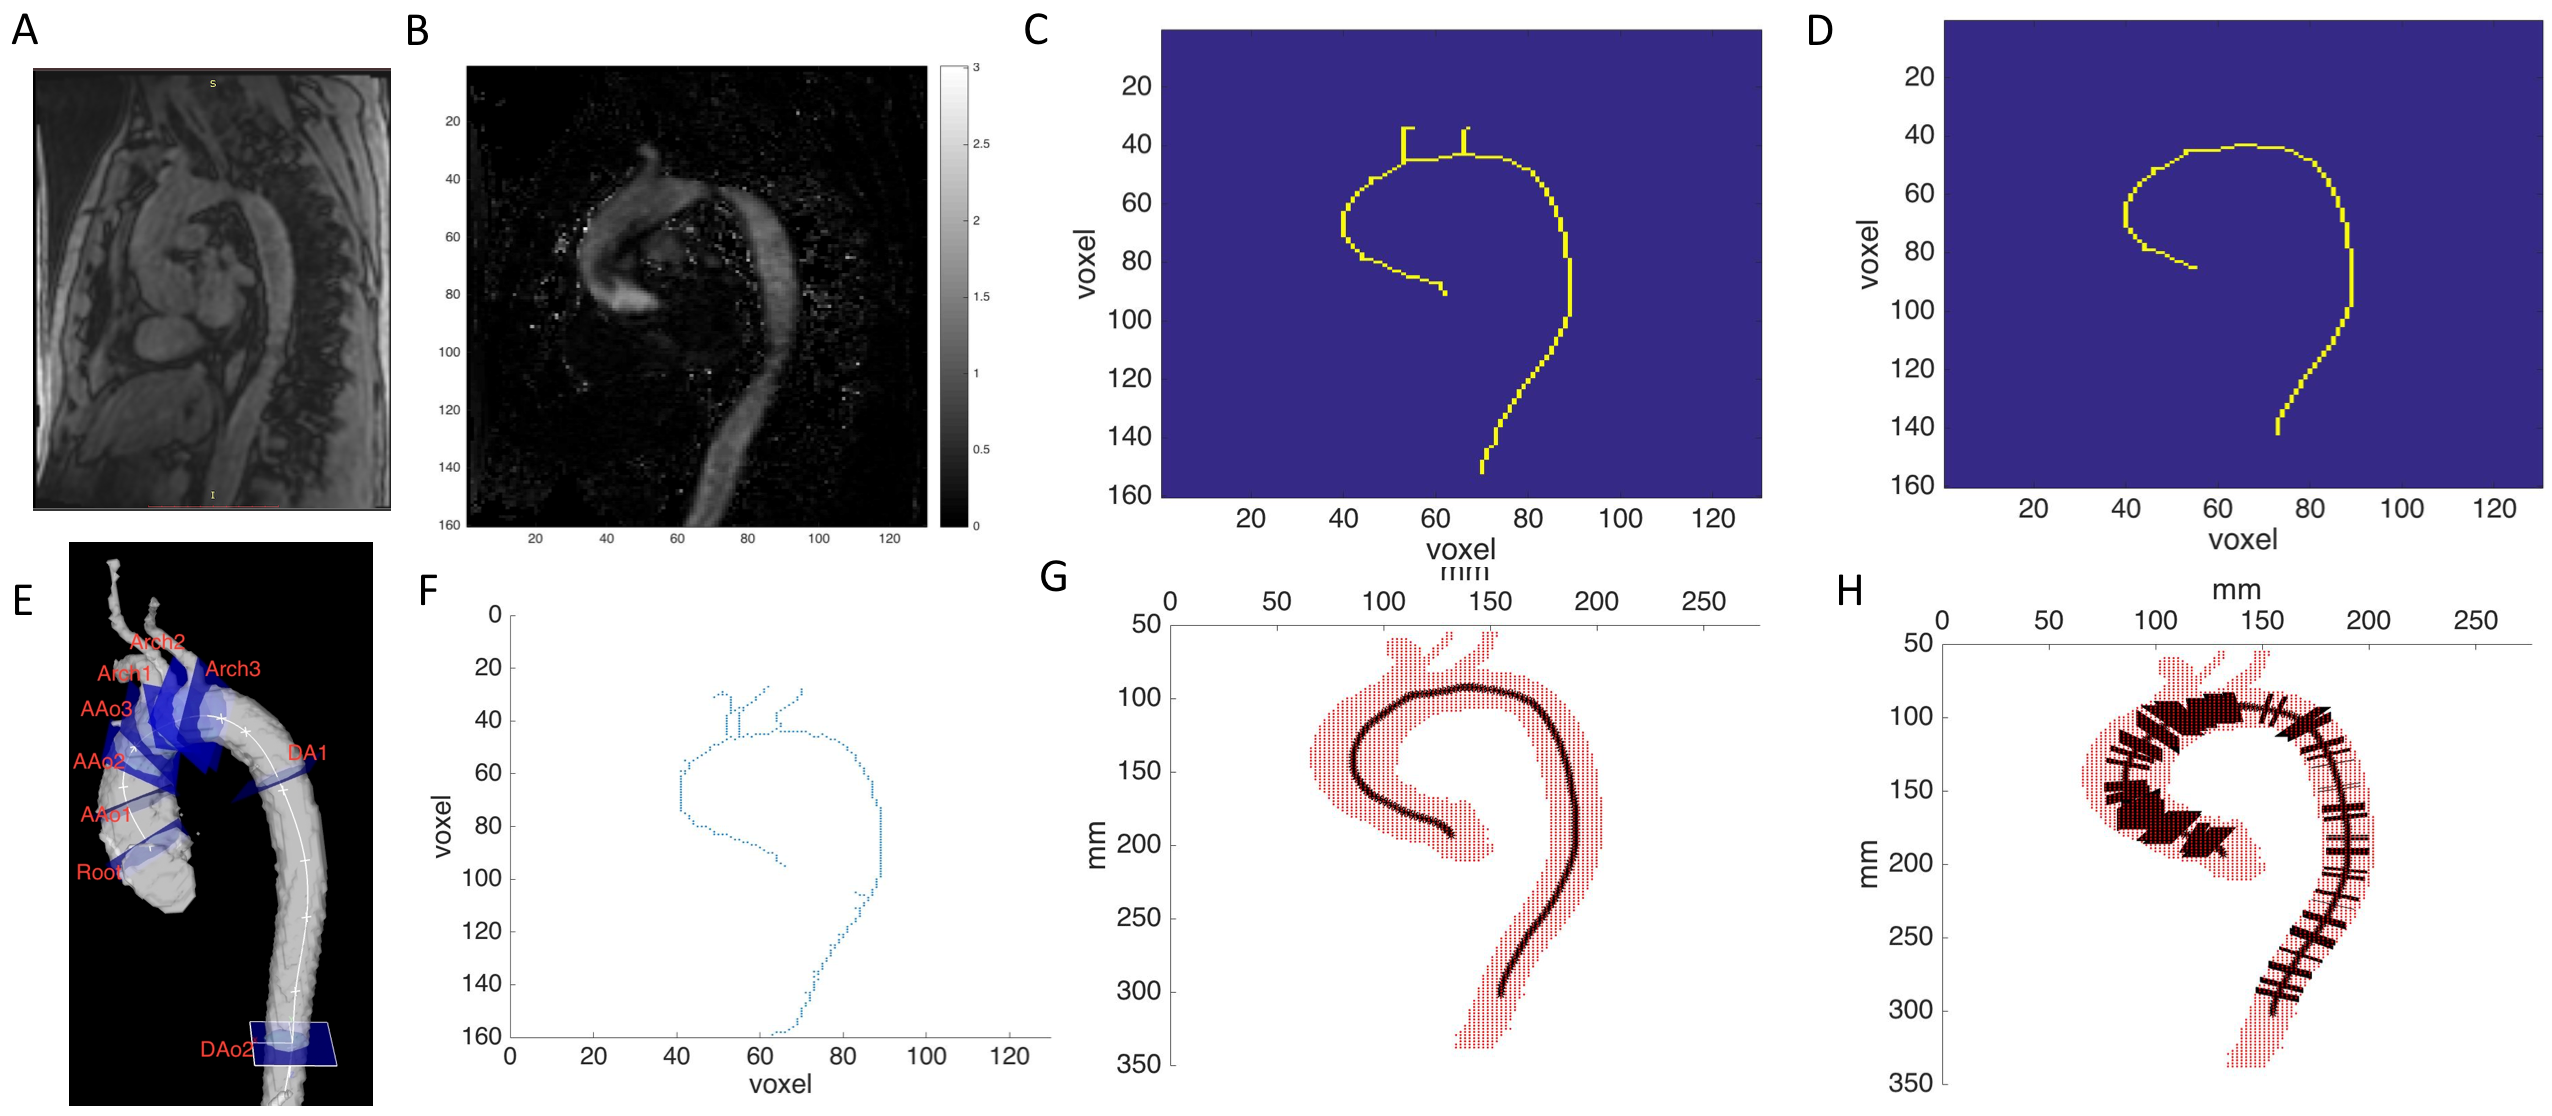
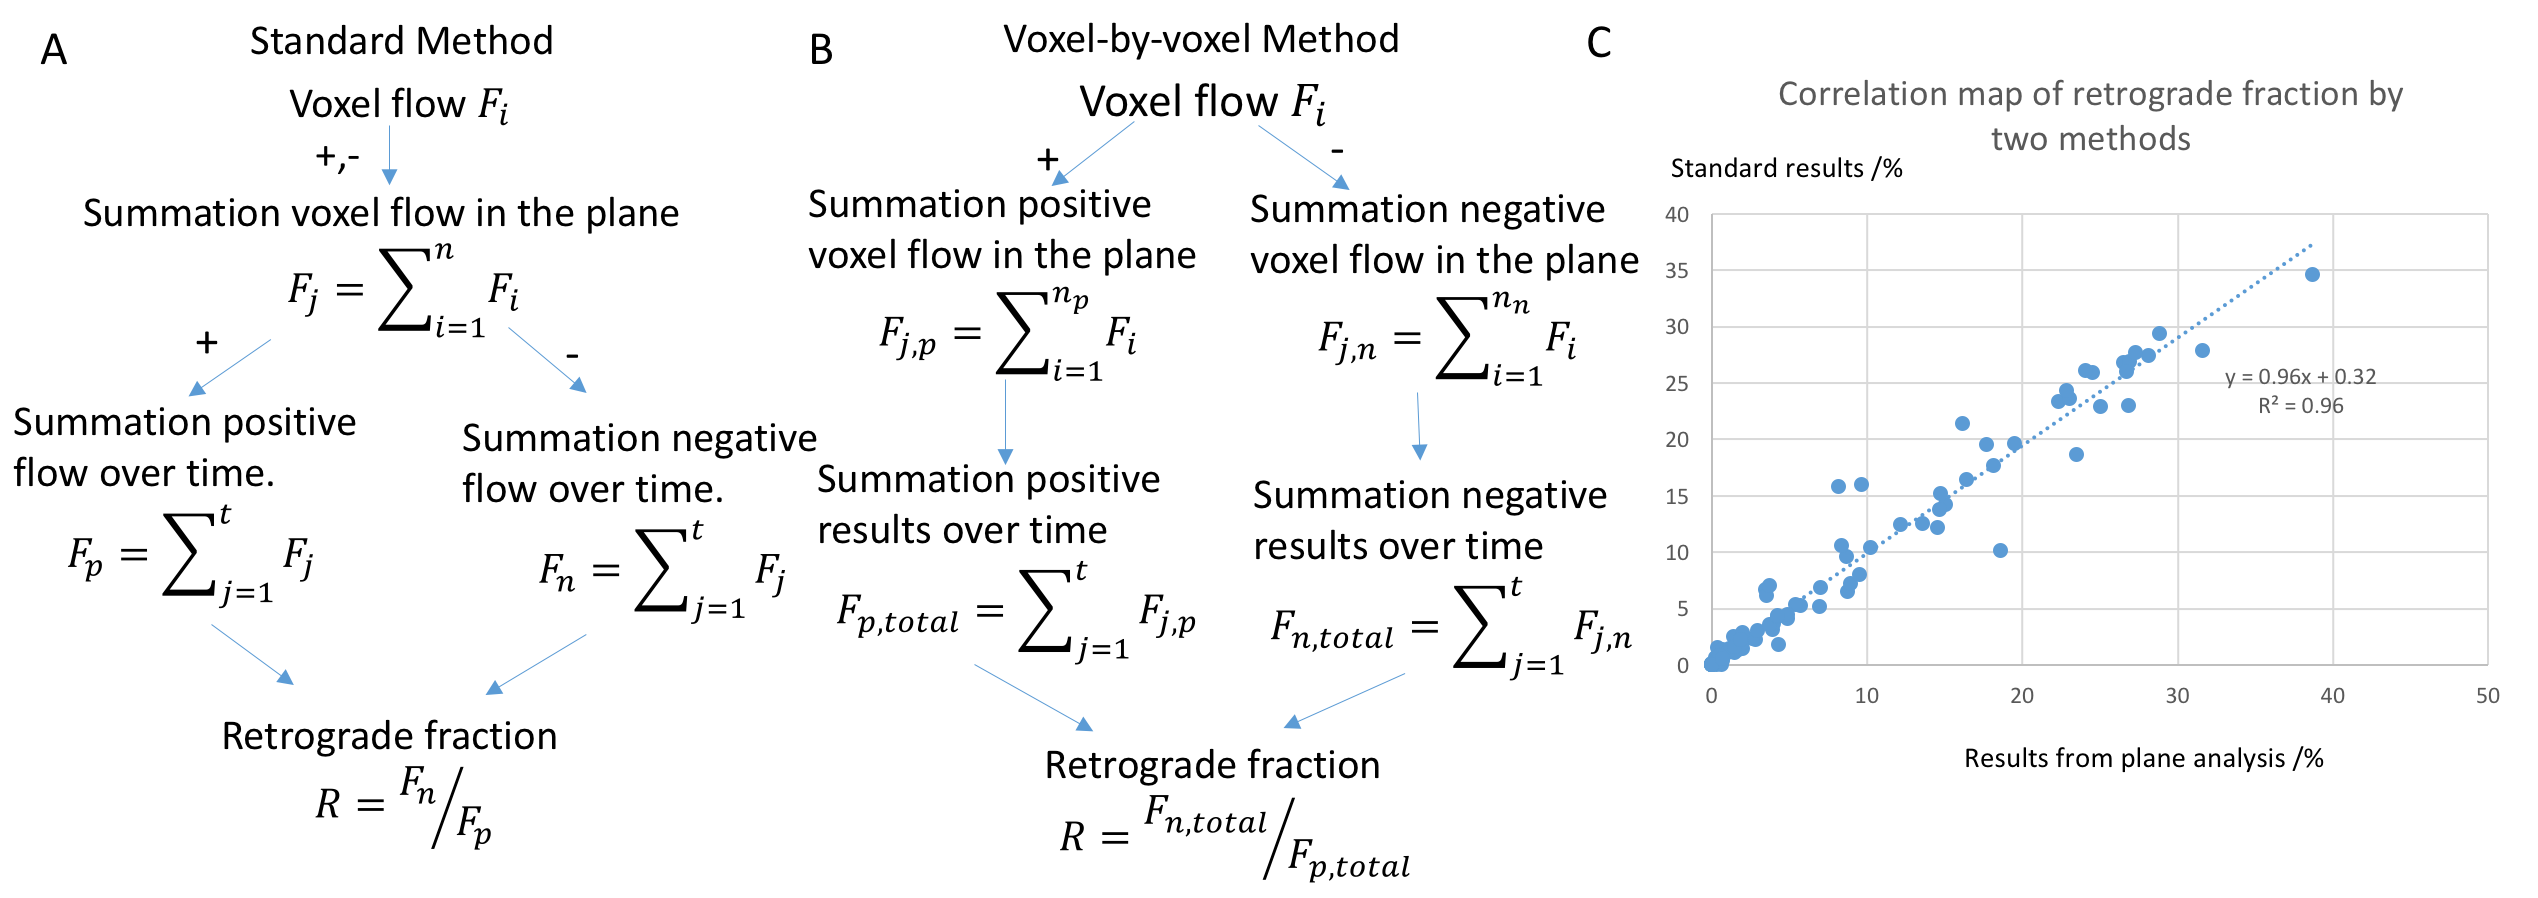
Five healthy volunteers and 5 patients diagnosed with AR (4 moderate, 1 severe) by echocardiography were included. All subjects underwent cardiothoracic MRI including 4D flow MRI with full coverage of the thoracic aorta. Imaging parameters were as follows: spatial resolution=2.1-3.2 mm x 1.7-2.3 mm x 2.2-3.2 mm, temporal resolution=37.6-42.4 ms, and TE=2.3-2.8 ms, TR=4.7-5.3 ms, venc=150-200 cm/s. 4D flow data analysis included corrections for noise, Maxwell terms, eddy currents, and velocity aliasing. A 3D PC MR angiogram was derived from the 4D flow data and used to generate a 3D segmentation of the aorta (Mimics, Materialise). The workflow for Voxel-by-voxel assessment of flow and retrograde fraction (programmed Matlab, The Mathworks, USA) is shown in figure 1. As a first step, an aorta center line was estimated based on a 2D representation of the 3D aorta segmentation (Fig 1 C, D). After deleting supra-aortic branches, a 3D aorta center line was calculated (Fig 1 F, G). For each point along the center line normal vectors were determined and 2D planes orthogonal to the center line were generated (Fig 1 H). Voxels inside the aorta were considered members of a 2D plane if their distance was < 1mm to each plane. Based on the normal direction and velocity vector, the forward, reverse flow, and retrograde fraction (ratio of forward / reverse flow) were calculated for each plane (standard plane-wise method) and each voxel (voxel-by-voxel analysis) as illustrated in figure 2. In addition, aortic flow and retrograde fraction maps were generated by calculating the mean projection and maximum intensity projection (MIP) are shown in figure 3. For comparison, we also performed standard plane-wise analysis of flow and retrograde fraction based on manually positioned 2D analysis planes at the following anatomic landmarks: aortic ROOT, proximal, mid and distal acceding aorta (AAo1, AAo2, AAo3), proximal, mid and distal arch (Arch1, Arch2, Arch3), and proximal and distal descending aorta (DAo1, DAo2) as shown in figure 1.Results
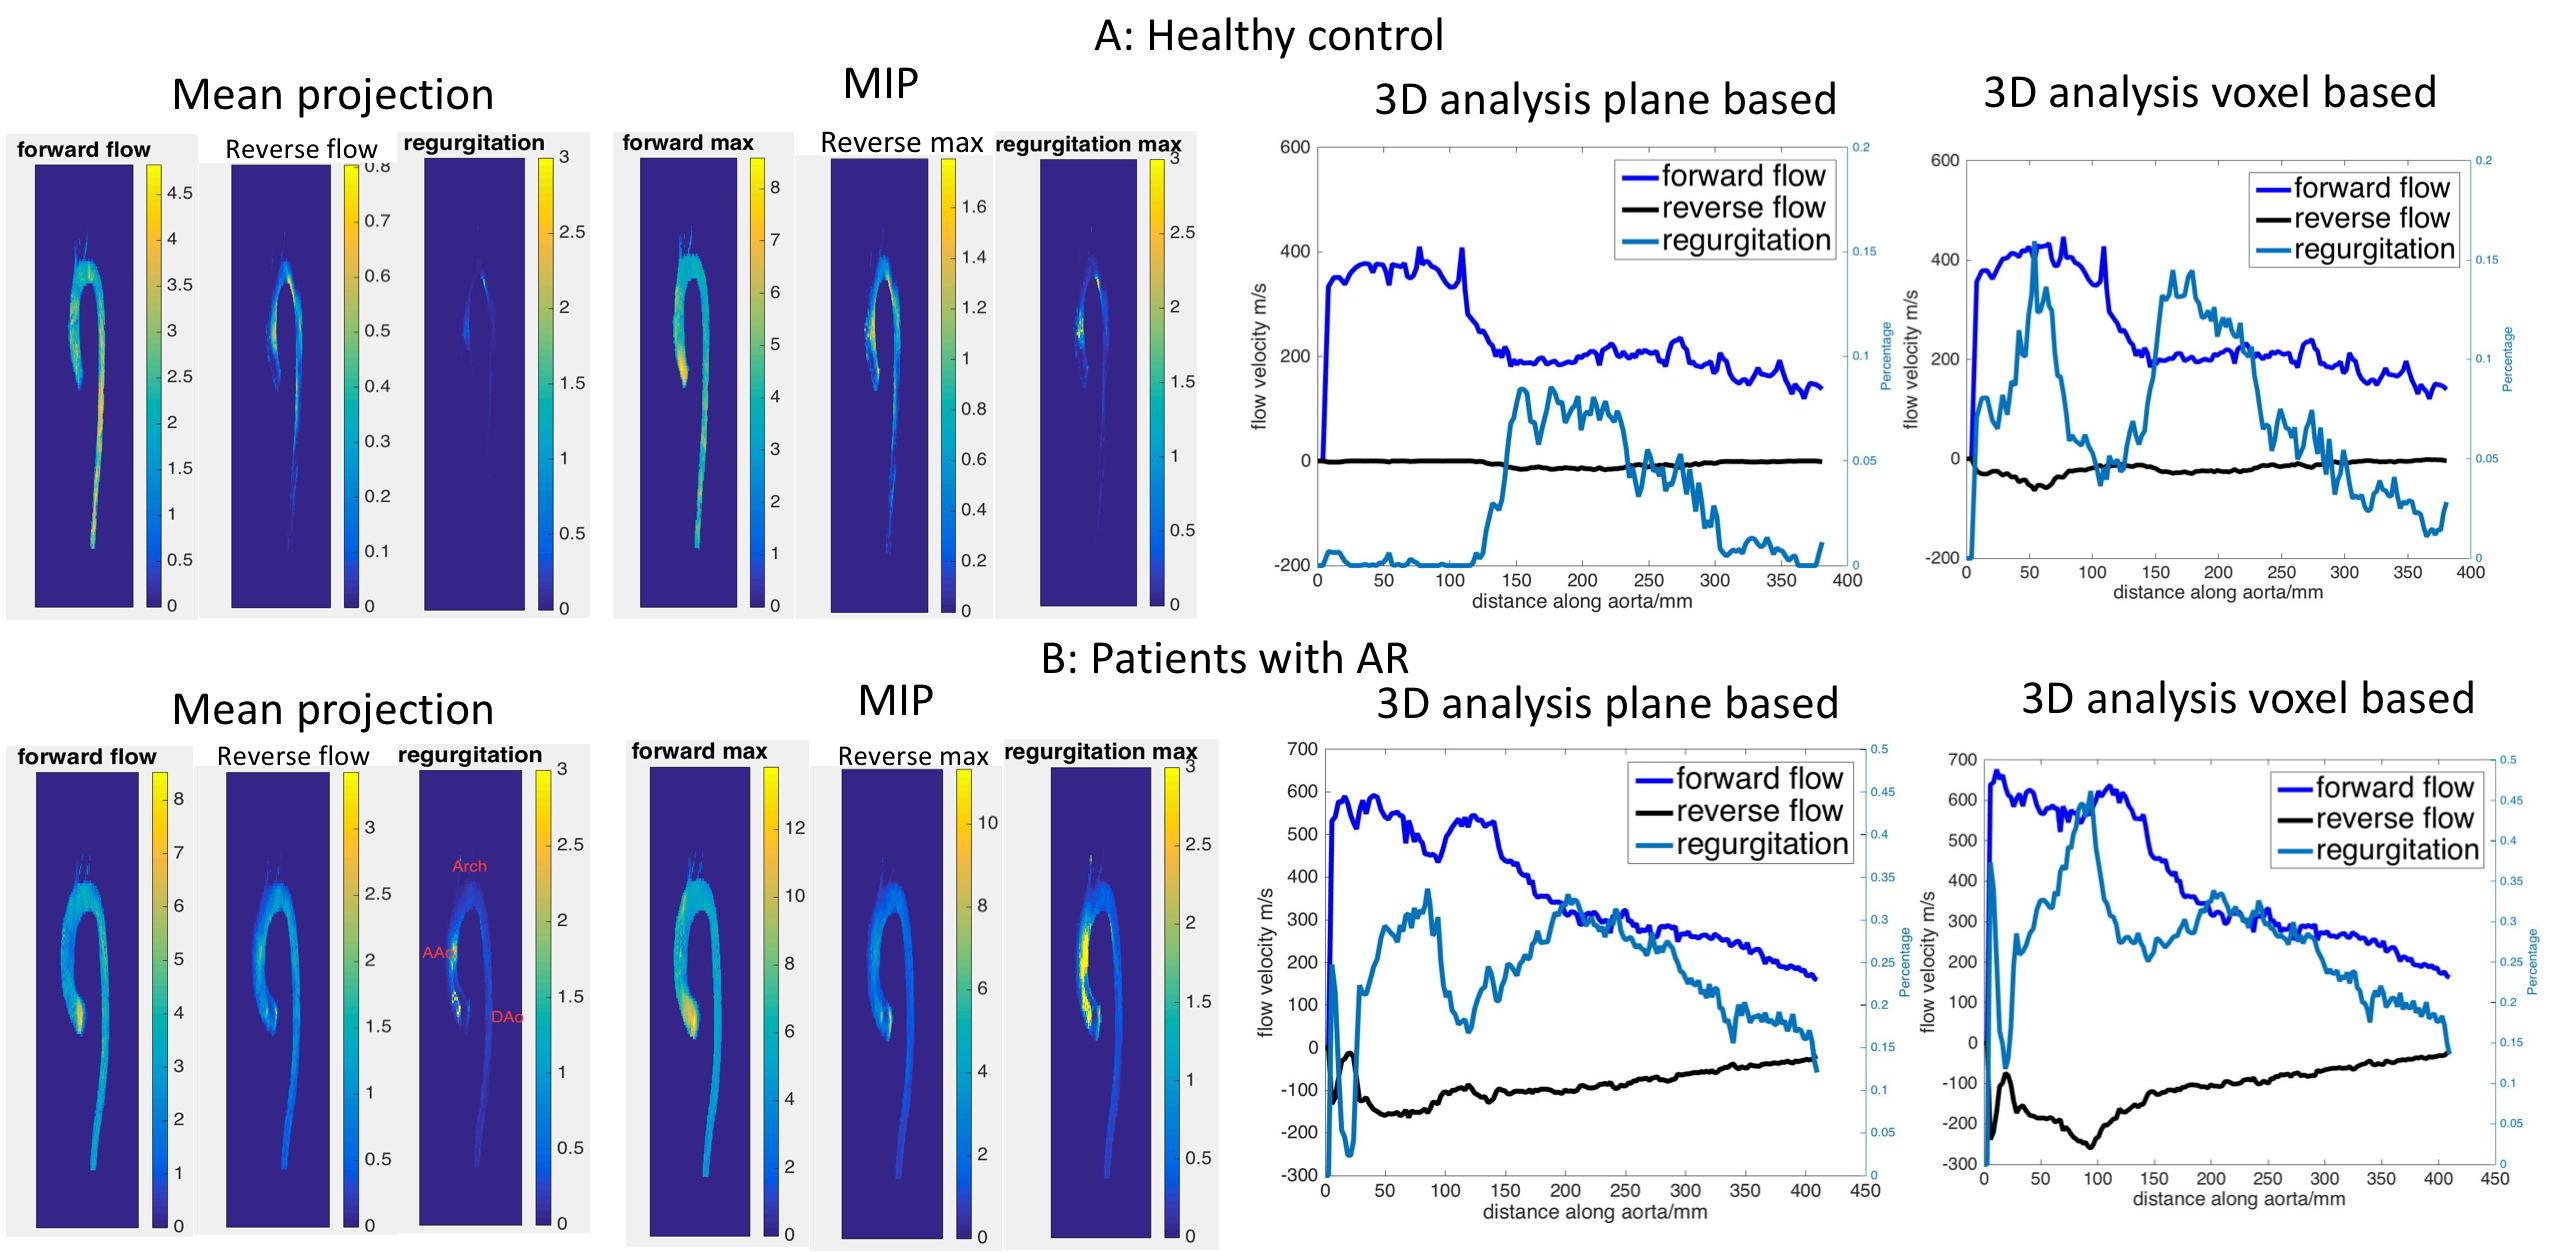
Figure 2 shows the results from a healthy subject and an AR patient. For each subject, the individual images show mean projection and MIP, as well as graphs with the plane-based and voxel-based 3D analysis. As expected, the AR patient demonstrated increased reverse flow and retrograde fraction compared the healthy subject. Both the healthy subject and AR patient showed local flow reversal in some regions (ascending aorta), which was not captured by the plane-wise analysis.
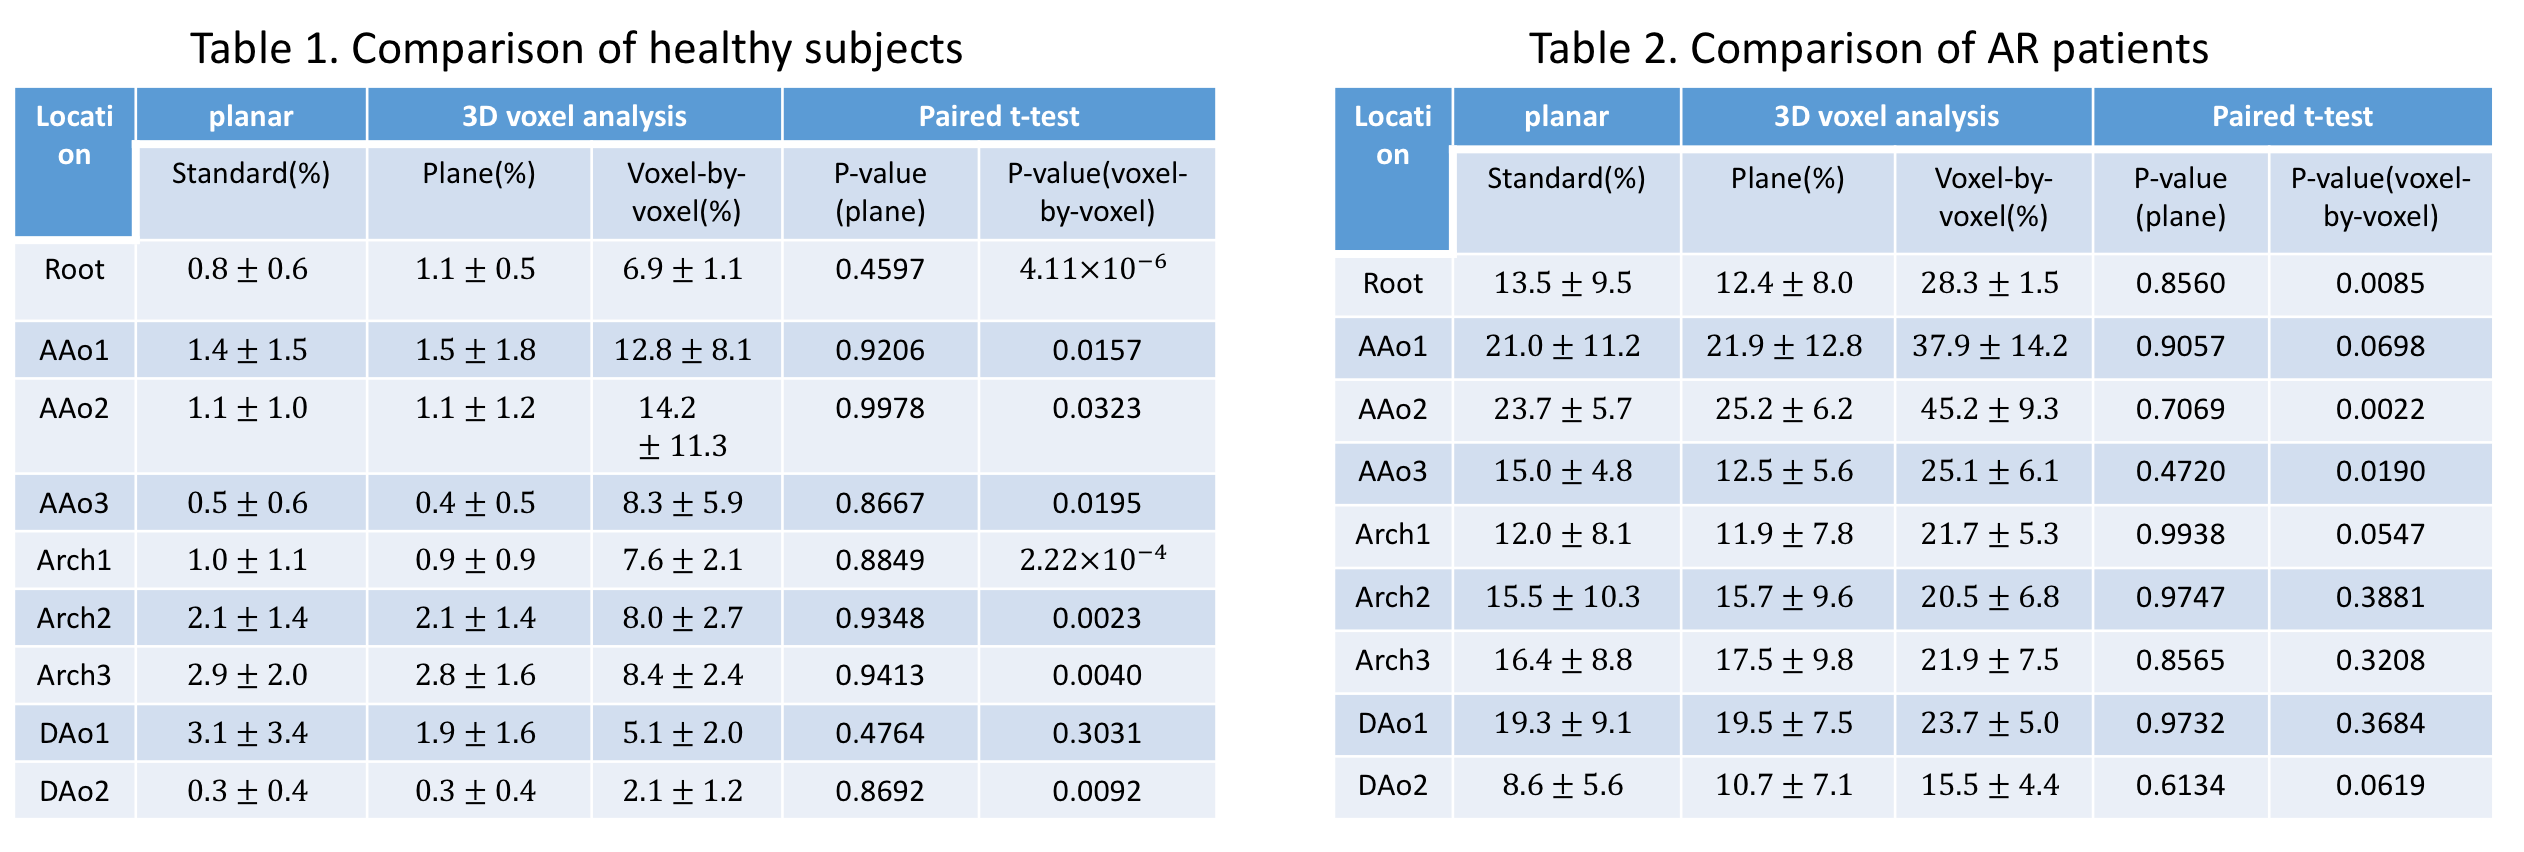
Figure 4 summarizes retrograde fraction quantification for all 2D analysis planes by different methods. In both groups, healthy subjects and AR patients, the standard plane and map plane methods were similar (on average, healthy 1.35±1.34% vs 1.46±1.73%, p=0.72, AR 16.10±8.78% vs 16.37±9.06%, p=0.89). In contrast, standard planar analysis and voxel based methods were significantly different (on average, healthy 1.35±1.34% vs 8.16±5.91%, p<0.001, AR 16.10±8.78% vs 26.63±11.14%, p<0.001). Differences were more pronounce for patients with AR.
Conclusion
The observed differences in retrograde fraction by the standard method and voxel-by-voxel analysis indicate that traditional techniques for the assessment of AR may substantially underestimate the presence of regional flow reversal. Additional studies are warranted to investigate this effect in larger cohort with different severity of aortic valve dysfunction.Acknowledgements
I have no funding.References
1. Saura, Daniel, et al. "The frequency of systolic aortic regurgitation and its relationship to heart failure in a consecutive series of patients." Revista Española de Cardiología (English Edition) 61.7 (2008): 771-774.
2. Chai P, Mohiaddin R. How we perform cardiovascular magnetic resonance flow assessment using phase-contrast velocity map- ping. J Cardiovasc Magn Reson 2005;7:705–716.
3. Kilner PJ, Yang GZ, Mohiaddin RH, Firmin DN, Longmore DB. Helical and retrograde secondary flow patterns in the aortic arch studied by three-directional magnetic resonance velocity mapping. Circulation 1993;88(5 Pt 1):2235–2247.
4. Stalder, A. F., et al. "Quantitative 2D and 3D phase contrast MRI: optimized analysis of blood flow and vessel wall parameters." Magnetic resonance in medicine 60.5 (2008): 1218-1231.
5. Myerson, Saul G., et al. "Aortic Regurgitation Quantification Using Cardiovascular Magnetic Resonance Association With Clinical Outcome." Circulation 126.12 (2012): 1452-1460.
Figures