2815
Magnetic resonance imaging discriminates organizing from non-organizing area in deep vein thrombus.1Department of Radiological Technology, Koga General Hospital, Miyazaki, Japan, 2Department of Pathology, Faculty of Medicine, University of Miyazaki, Miyazaki, Japan, 3Faculty of Health Sciences, Institute of Medical, Pharmaceutical and Health Sciences, Kanazawa University, 4Department of Radiology, Koga General Hospital, Miyazaki, Japan, 5Department of Internal Medicine, Koga General Hospital, Miyazaki, Japan
Synopsis
Deep vein thrombus (DVT) is gradually replaced by fibrous tissue, and is called as organizing reaction. We examined magnetic resonance image (MRI) findings of the organizing DVT in vitro using a 1.5T MR system in autopsy cases with DVT. The organizing area of DVT showed low signal intensity (SI) on T1 weighted images, in contrast to high SI on T1 weighted images in non-organizing area. Both areas showed iso to low SI on T2 weighted image. T1 SI positively correlated with the erythrocyte content in the thrombus. MRI could discriminate organizing from non-organizing area in DVT.
Deep vein thrombus (DVT) is gradually replaced by fibrous tissue, and is called as organizing reaction. We examined magnetic resonance image (MRI) findings of the organizing DVT in vitro using a 1.5T MR system in autopsy cases with DVT. The organizing area of DVT showed low signal intensity (SI) on T1 weighted images, in contrast to high SI on T1 weighted images in non-organizing area. Both areas showed iso to low SI on T2 weighted image. T1 SI positively correlated with the erythrocyte content in the thrombus. MRI could discriminate organizing from non-organizing area in DVT.
Background: Venous thromboembolism (VTE) comprises deep vein thrombosis/ thrombus (DVT) with or without symptomatic pulmonary embolism (PE). The incidence of VTE is 1.43 per 1000 person-years. DVT initially consists of erythrocytes, fibrin, and platelets, and is gradually organized by fibrous tissue. To detect organizing thrombus is important for the strategy of thrombolytic therapy and discontinuation of antithrombotic therapy. Although magnetic resonance imaging (MRI) has used as an imaging modality for diagnosis of DVT, MRI findings of the organizing thrombus have not been established.
Purpose: The aim of this study is to characterize the MRI findings of the organizing thrombus. Methods: We performed in vitro MRI of formalin-fixed iliac to femoral veins in autopsy cases of DVT using 2-dimentional fast recovery fast spin echo T2 weighted image (T2WI) and spin echo T1 weighted image (T1WI) sequences in a 1.5 T MR system and 8-channel wrist-phased array coil (Signa HDxt; GE). T2WI was acquired at a repetition time (TR) and echo time (TE) of 4000/13.3, 26.7, 40.0, 53.3, 66.7, 80.0, 99.3, 106 ms, number of excitations (NEX), 1. Spin echo sequence T1WI was acquired at a TE, TR and NEX of 13 ms/ 400 ms or 800 ms and 12 or 6, respectively. Other parameters included: receiver bandwidth (BW), 15.63 kHz; matrix, 320 × 320. Further MR imaging parameters included: field of view (FOV), 50 × 50 mm; slice thickness and slice gap, 3.0 mm/ 0.6mm; phase FOV, 1.0, with fat suppression pulse. All images were acquired at room temperature (22 degree). Relaxation time and signal intensity (SI) were compared between the histologically determined organizing and non-organizing areas. We analyzed relaxation time and SI using Image-J (NIH). Thrombus SI was normalized to that of the adjacent muscle. We performed histological analysis. The fixed DVT tissues were stained with hematoxylin eosin-, anti-glycophorin A (erythrocyte), anti-fibrin, anti-glycoprotein IIb/IIIa (platelets), Sirius red- (collagen), anti-CD68 (macrophage), anti-CD34 (endothelial cell), anti-smooth muscle actin (smooth muscle cell: SMC). The cellular-, iron-, or matrix-areas in the thrombi were assessed with image analyzing software.
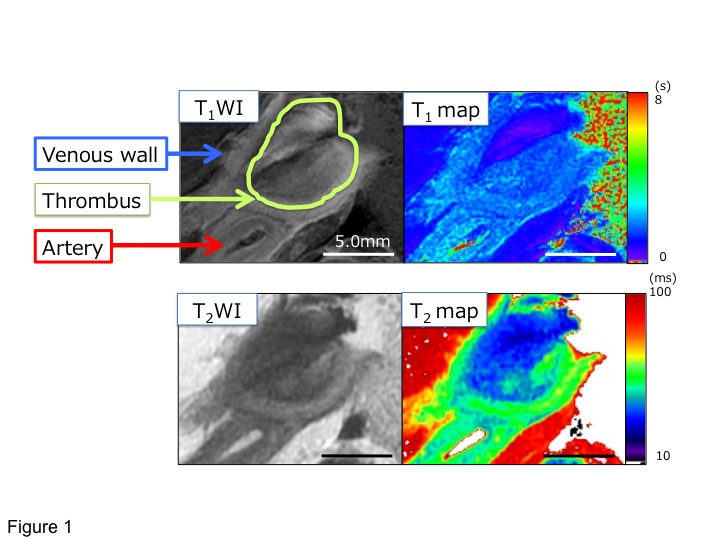
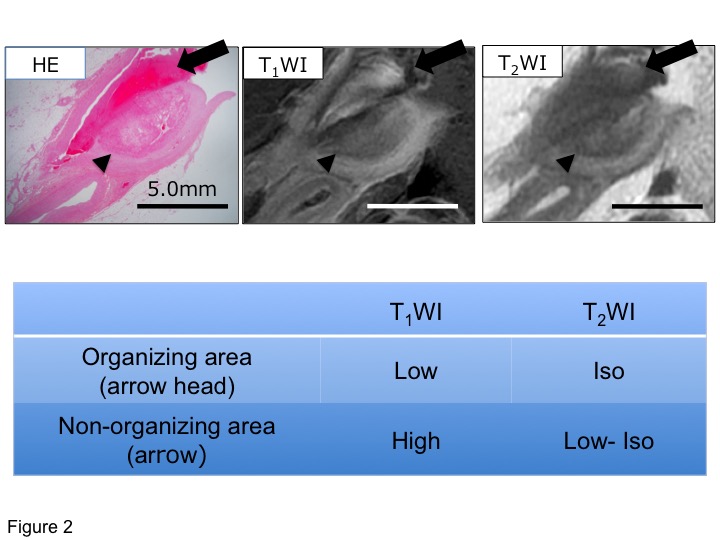
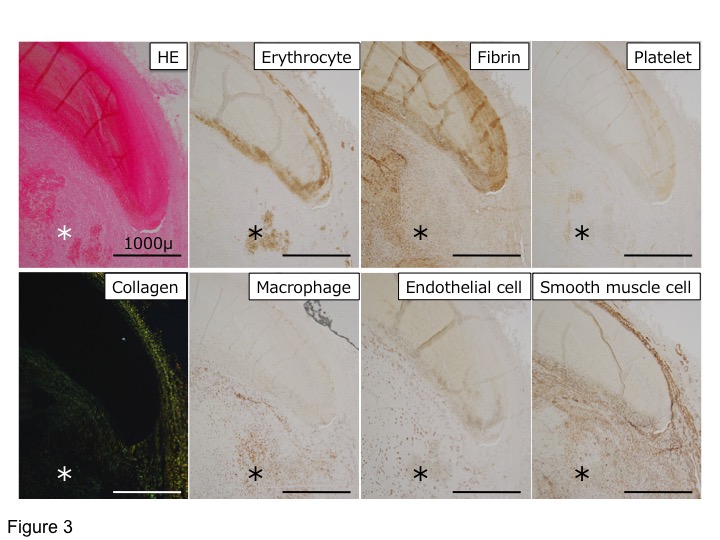
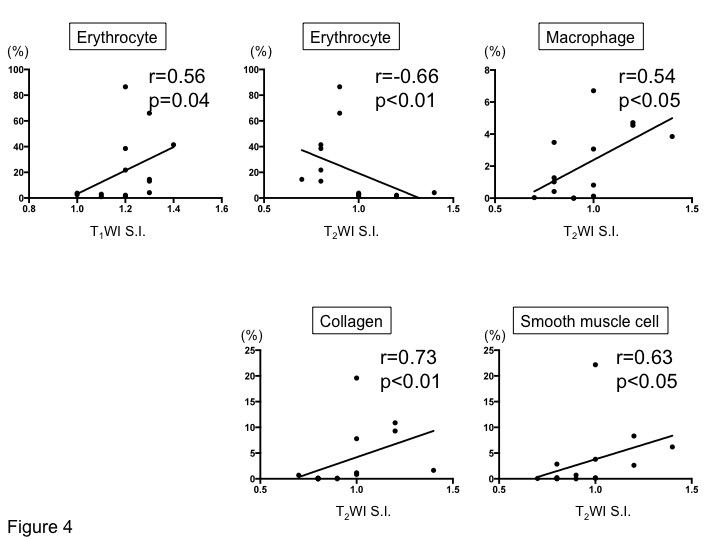
Results: Figure 1 shows axial MR images, T1 and T2 map images. The common iliac vein was occupied by a venous thrombus. The venous thrombus appeared as heterogeneous iso or low SI on T2WI, and heterogeneous high or iso SI on T1WI. T1 and T2 map images shows the distribution of T1 and T2 values in the venous thrombus. The high SI area on T1WI was delineated as areas of short T1 and T2 values, whereas the low SI area on T2WI was delineated as areas of long T1 and T2 values in T1 and T2 map images. Figure 2 shows histological and axil T1WI and T2WI MR images. The DVT was histologically composed of non-organizing and organizing areas. The T1WI SI (1.13 ± 0.11) or T2WI SI (1.14 ± 0.16) relative to the muscle in organizing area were significantly lower or higher than T1WI (1.27 ± 0.07) and T2WI (0.8 ± 0.06) in non-organizing area, respectively. The non-organizing area in the thrombus was rich in erythrocytes and fibrin, and the organizing area in the thrombus showed endothelial and SMC proliferation, and collagen deposition (Figure 3). The T1WI SI in DVT positively correlated with erythrocyte-area. The T2WI SI in the DVT negatively correlated with erythrocyte-area, and positively correlated with macrophage-, collagen- and SMC-areas (Figure 4).
Discussion: These results suggest that low SI on T1 and iso-SI on T2 in DVT reflect organizing reaction. MRI could discriminate organizing from non-organizing area in DVT.
Acknowledgements
This work was supported by KAKENHI (16K09019).References
Figures