2804
Validation and Error Quantification of Pulmonary Artery 4D Flow-MRI in a digital broadband 3T MR setup1Clinic for Radiology and Nuclear Medicine, University Hospital Schleswig-Holstein, Luebeck, Germany, 2Medical Clinic III: Pulmonology, University Hospital Schleswig-Holstein, Luebeck, Germany
Synopsis
4D Flow-MRI offers unique possibilities for the diagnosis of pulmonary hypertension. A validation of the sequence on a digital broadband 3T MR system is essential before introduction into clinical routine. This study compared 4D Flow–MRI derived stroke volume (SV) and maximal flow velocity (Vmax) in the pulmonary arteries of 23 healthy volunteers to 2D phase contrast MRI, right ventricular stroke volume (RVSV), conservation of mass-analysis (COM), and to a static phantom for additional error analysis. Results revealed clinically acceptable differences with a trend of phantom correction to improve results except for the COM-analysis.
Purpose
4D Flow-MRI offers novel insights into the hemodynamics of pulmonary hypertension and promises a non-invasive diagnosis in the future1, 2. Prior to its introduction into clinical routine, a thorough validation and error quantification is essential. Hence, the aim of this study was to validate a 4D Flow-MRI sequence on a digital broadband 3T MR system which is marketed as beneficial in terms of noise reduction due to the digitization of the MR data in the coil itself rather than prior conversion to direct current. A comprehensive set of alternative, clinically routine techniques including phantom correction following3, 2D phase contrast (PC) sequences, right ventricular stroke volumes (RVSV), and conservation of mass (COM)-analysis was used for comparison.Methods
MRI scans: The pulmonary arteries of 23 healthy volunteers (14f, 38±18y, BMI 21.5±3.0 kg/m², HR 65±9/min) were examined after IRB approval and written informed consent on a digital broadband 3T system (Philips Ingenia dStream, R5.18, The Best, Netherlands) with a 20 channel body surface coil. A non-contrast-enhanced, retrospectively ECG-gated, SENSE accelerated 4D phase contrast (PC) sequence with referenced velocity encoding in all directions (4D Flow-MRI), adaptive respiratory gating and imaging parameters Venc=120cm/s and FA=7° was reconstructed to an isotropic resolution of 2mm and 20 time frames. 2D PC sequences aligned orthogonal to the main (MPA), left (LPA) and right (RPA) pulmonary artery were acquired with 40 heart phases during breathholds with Venc=100cm/s (MPA) and 120cm/s (LPA and RPA). A CINE bSSFP sequence transversal to the body axis covering the entire right ventricle was acquired for quantification of RVSV. 2D and 4D PC sequences were repeated after each volunteer on a static phantom.
Data analysis: Flow data were analyzed using GTFlow (v2.2.6, GyroTools, CH). Geometric information from 2D planes were used to exactly match the 4D plane positions (Fig. 1) and were subsequentially transferred to phantom data for error determination. Stroke volume (SV) and maximal velocity (Vmax) were evaluated. RVSV was determined per clinical standard according to the Simpson method using Extended MR WorkSpace (v2.6.3.5, Philips).
Statistical analysis: Results were given as mean ± standard deviation. Bland-Altman analysis and Student’s t-test were performed to compare the different methods. COM-analysis postulated SV in the MPA to equal the sum of SV in RPA and LPA (SVMPA = SVLPA + SVRPA).
Results
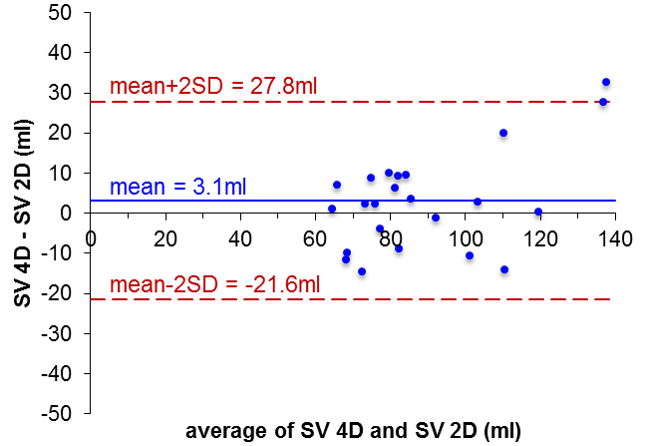
There was good agreement of SVMPA between 4D Flow-MRI and 2D PC MRI (4D: 93.0±26.1ml, 2D: 87.3±19.1ml; p<0.05, avg. difference = 5.7±10.6ml) which further improved after phantom correction (4D: 90.5±25.3ml, 2D: 87.4±19.0ml; p= n.s., avg. difference =3.1±12.3ml, Fig. 2). As seen from Tab. 1, the average difference between 4D and 2D data was lower for Vmax, with improvement after phantom correction. Comparing 4D Flow SVMPA to RVSV (Tab. 2), the low average difference improved from 5.5±17.2ml to -0.1±20ml after phantom correction (both: p=n.s.). COM-analysis revealed an average difference of 2.2±15.6ml which worsened through correction to 7.7±15.9ml (Tab. 3).Discussion
4D Flow-MRI measurements were comparable to other clinically used MR techniques. The improvement of the already good data after phantom correction and the standard deviation may be explained by imperfectly corrected eddy current-induced phase fluctuations4. Conservation of mass analysis was convincing with a low mean-error. However, the spread in the Bland-Altman window was still relatively high for those results. Similar drawbacks were reported with other sequences and vendors5. One explanation is the relatively low temporal and only moderate spatial resolution of the 4D sequence compared to 2D. Respiration state, i.e. free breathing vs. breathhold, seems to have an additional effect as well6. Lastly, even phantom correction only provides an imperfect correction, most likely since other factors such as gradient temperature affecting phase contrast measurements are harder to control4, 7.Conclusion
This work confirms that 4D Flow-MRI measurements match other MR techniques typically used in the context of pulmonary hypertension. The detected differences are clinically acceptable. However, the residual error and spread of data is still of note and should be motivation for future optimization of the sequence and/or acquisition setup.Acknowledgements
No acknowledgement found.References
1. Reiter G, Reiter U, Kovacs G et al. Blood Flow Vortices Along the Main Pulmonary Artery Measured with MR Imaging for Diagnosis of Pulmonary Hypertension. Radiology. 2015;275(1):71-9.
2. Barker AJ, Roldan-Alzate A, Entezari P et al. Four-Dimensional Flow Assessment of Pulmonary Artery Flow and Wall Shear Stress in Adult Pulmonary Arterial Hypertension: Results from Two Institutions. Magn Reson Med. 2015;73(5):1904-13.
3. Chernobelsky A, Shubayev O, Comeau CR et al. Baseline Correction of Phase Contrast Images Improves Quantification of Blood Flow in the Great Vessels. J Cardiovasc Magn Reson. 2007;9(4):681-5.
4. Giese D, Haeberlin M, Barmet C et al. Analysis and Correction of Background Velocity Offsets in Phase-Contrast Flow Measurements Using Magnetic Field Monitoring. Magn Reson Med. 2012;67(5):1294-302.
5. Frydrychowicz A, Wieben O, Niespodzany E et al. Quantification of Thoracic Blood Flow Using Volumetric Magnetic Resonance Imaging with Radial Velocity Encoding: In Vivo Validation. Invest Radiol. 2013;48(12):819-825.
6. Bollache E, Van Ooij P, Powell A et al. Comparison of 4d Flow and 2d Velocity-Encoded Phase Contrast MRI Sequences for the Evaluation of Aortic Hemodynamics. Int J Cardiovasc Imaging. 2016;32(10):1529-41.
7. Lankhaar JW, Hofman MB, Marcus JT et al. Correction of Phase Offset Errors in Main Pulmonary Artery Flow Quantification. J Magn Reson Imaging. 2005;22(1):73-9.
Figures
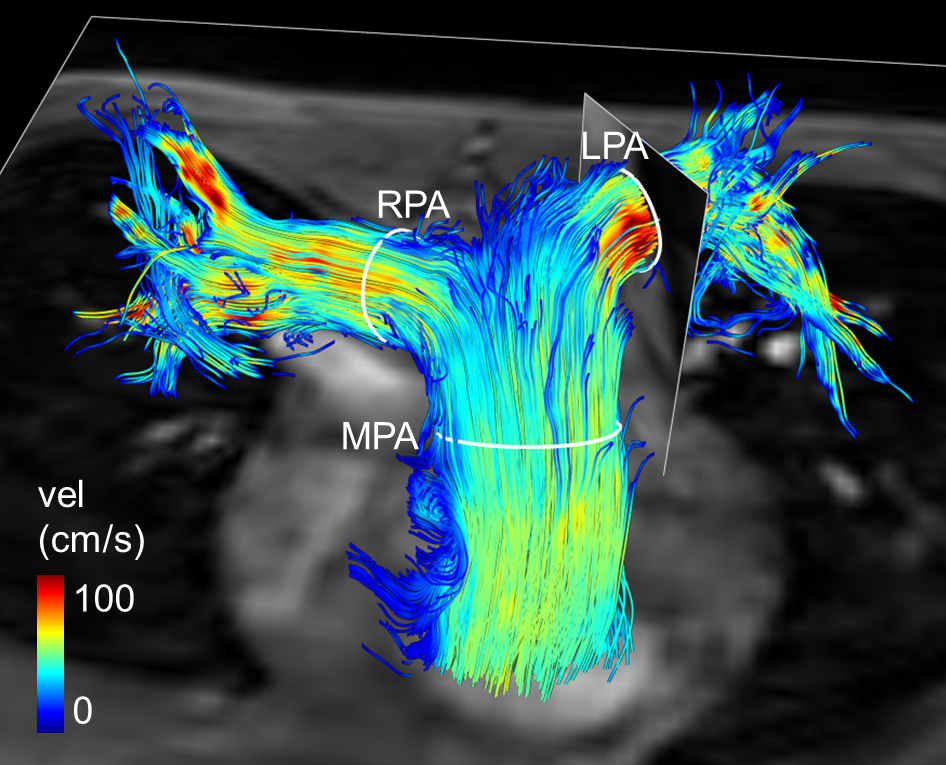
Fig. 1: 3D Streamline visualization at peak systole.
Positioning of 2D and 4D contours in main (MPA), right (RPA) and left (LPA) pulmonary artery is demonstrated.
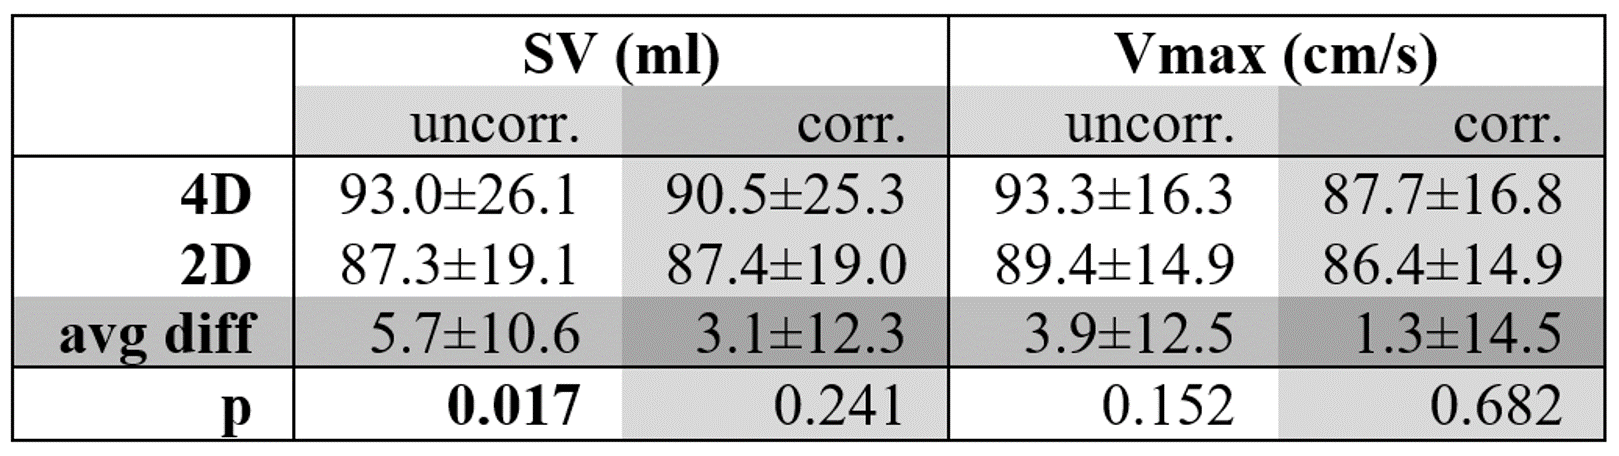
Tab. 1: Stroke volume (SV) and maximal velocity (Vmax) in 4D and 2D measurements of the main pulmonary artery
avg diff: average difference, uncorr: uncorrected, corr: phantom corrected, bold type = significant
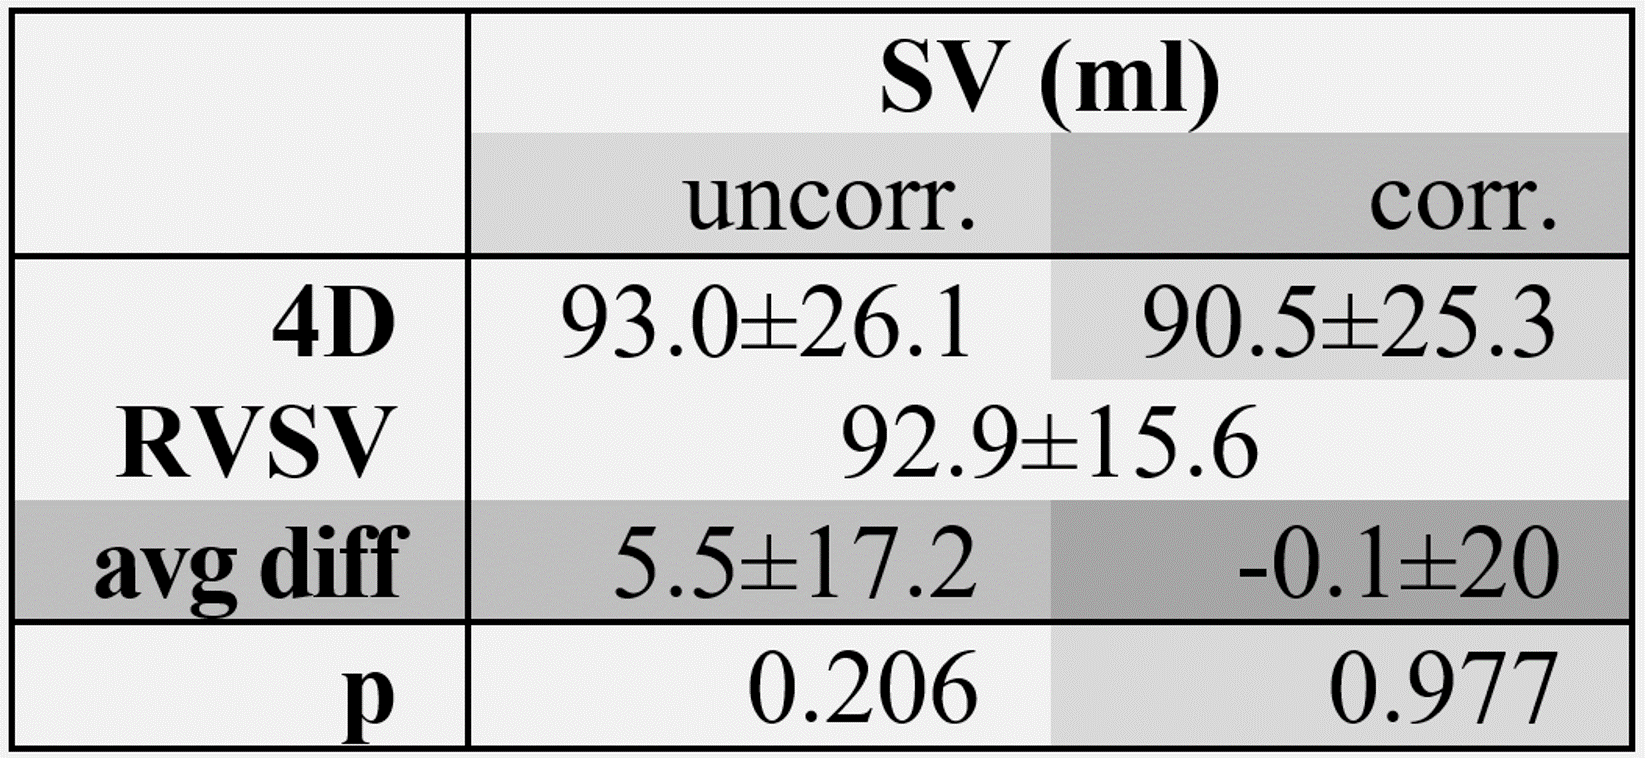
Tab. 2: Stroke volume (SV) of the main pulmonary artery in 4D and right ventricular stroke volume (RVSV)
avg diff: average difference, uncorr: uncorrected, corr: phantom corrected
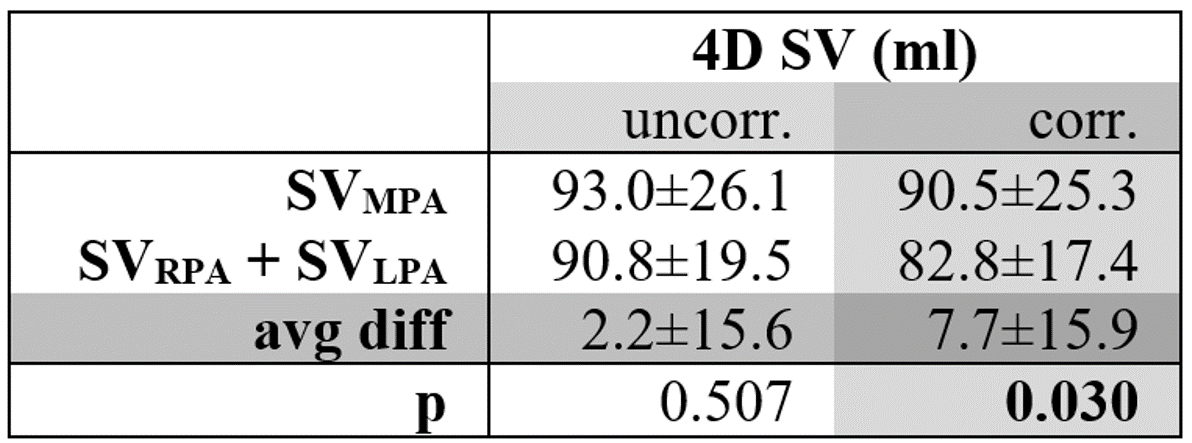
Tab. 3: Conservation of mass analysis
SV: stroke volume, MPA: main pulmonary artery, RPA: right pulmonary artery, LPA: left pulmonary artery, avg diff: average difference, uncorr: uncorrected, corr: phantom corrected, bold type = significant