2800
Improving visualization of 4D Flow MRI with four-dimensional angiographic data1Department of Medical and Health Sciences, Division of Cardiovascular Medicine, Linköping University, Linköping, Sweden, 2Center for Medical Image Science and Visualization (CMIV), Linköping University, Linköping, Sweden, 3Department of Clinical Physiology, Department of Medical and Health Sciences, Linköping University, Linköping, Sweden
Synopsis
We present a technique for the generation of four-dimensional angiographic data from 4D Flow MRI. Using registration between the timeframes of the 4D Flow MRI, the method concentrates information from the entire cardiac cycle into an angiographic dataset at one timeframe. This step is followed by another set of registrations to generate a time-resolved three-dimensional angiography (4D). Visual comparison of the generated data versus conventional techniques resulted in higher scores in all the regions evaluated. The resulting data allow for visualization of the cardiovascular anatomy throughout the cardiac cycle, facilitating anatomical orientation and enhancing visualization of 4D Flow MRI data.
Purpose
4D Flow MRI is a magnetic resonance image acquisition technique used to evaluate the flow of blood in the heart and great thoracic vessels over the cardiac cycle1. Often, similar images to those obtained when using Phase-Contrast Magnetic Resonance Angiography (PC-MRA) acquisition techniques are generated from the 4D Flow MRI data for anatomical orientation and visualization purposes. Generation of 3D PC-MRA data from 4D Flow MRI is usually accomplished by combining and averaging the velocity and magnitude information over the cardiac cycle2,3. During this process, however, motion over the cardiac cycle is typically averaged and consequently lost.
The goal of this study is to present a new technique for the creation of PC-MRA data that utilizes the full potential of 4D flow MRI, facilitating better depiction of moving structures, and allowing for the creation of a temporally resolved Phase-Contrast Magnetic Resonance CardioAngiography (4D PC-MRCA) that includes the geometry of the lumen of the vessels, as well as the heart over the cardiac cycle.
Method
Steps for 4D PC-MRCA generation were as follows:
1. PC-MRA data were generated from the 4D Flow MRI dataset for every timeframe using the following equation:
$$\text{PC-MRA}(t)=M(t)*(V_x^2(t)+V_y^2(t)+V_z^2(t))^\gamma$$
Gamma (γ) correction of 0.2 enhances the velocity values and to makes sure that the lower velocities, such as those present in the heart chambers, are also included in the image. The resulting 4D image retains the information specific to each timeframe of the cardiac cycle.
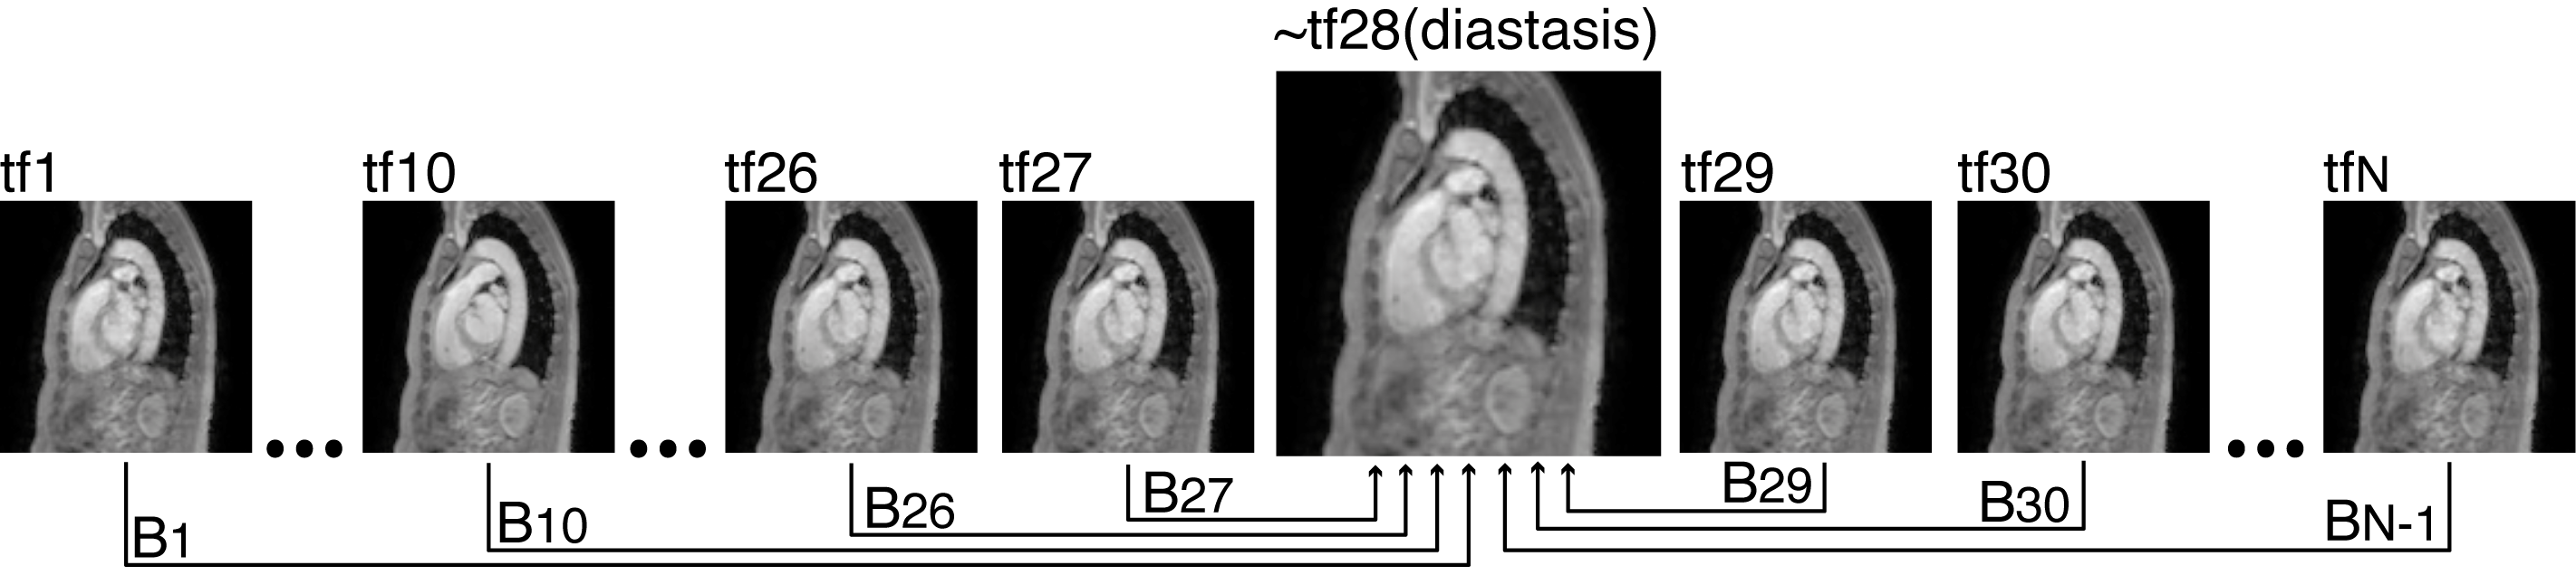
2. All the timeframes of the MRI magnitude image were registered to one specific timeframe in mid-diastole. This resulted in N-1 transformations, Bt, each corresponding to one timeframe, t (see Figure 1).
3. Each timeframe, t, of the previously created PC-MRA was deformed using the corresponding transformation, Bt, to produce a set of images with intensities that depend on the blood flow patterns at each timeframe, but with the shape and morphology expected in the chosen diastasis timeframe.
4. A 3D PC-MRCA was calculated as a Maximum Intensity Projection (MIP) of these images over time.
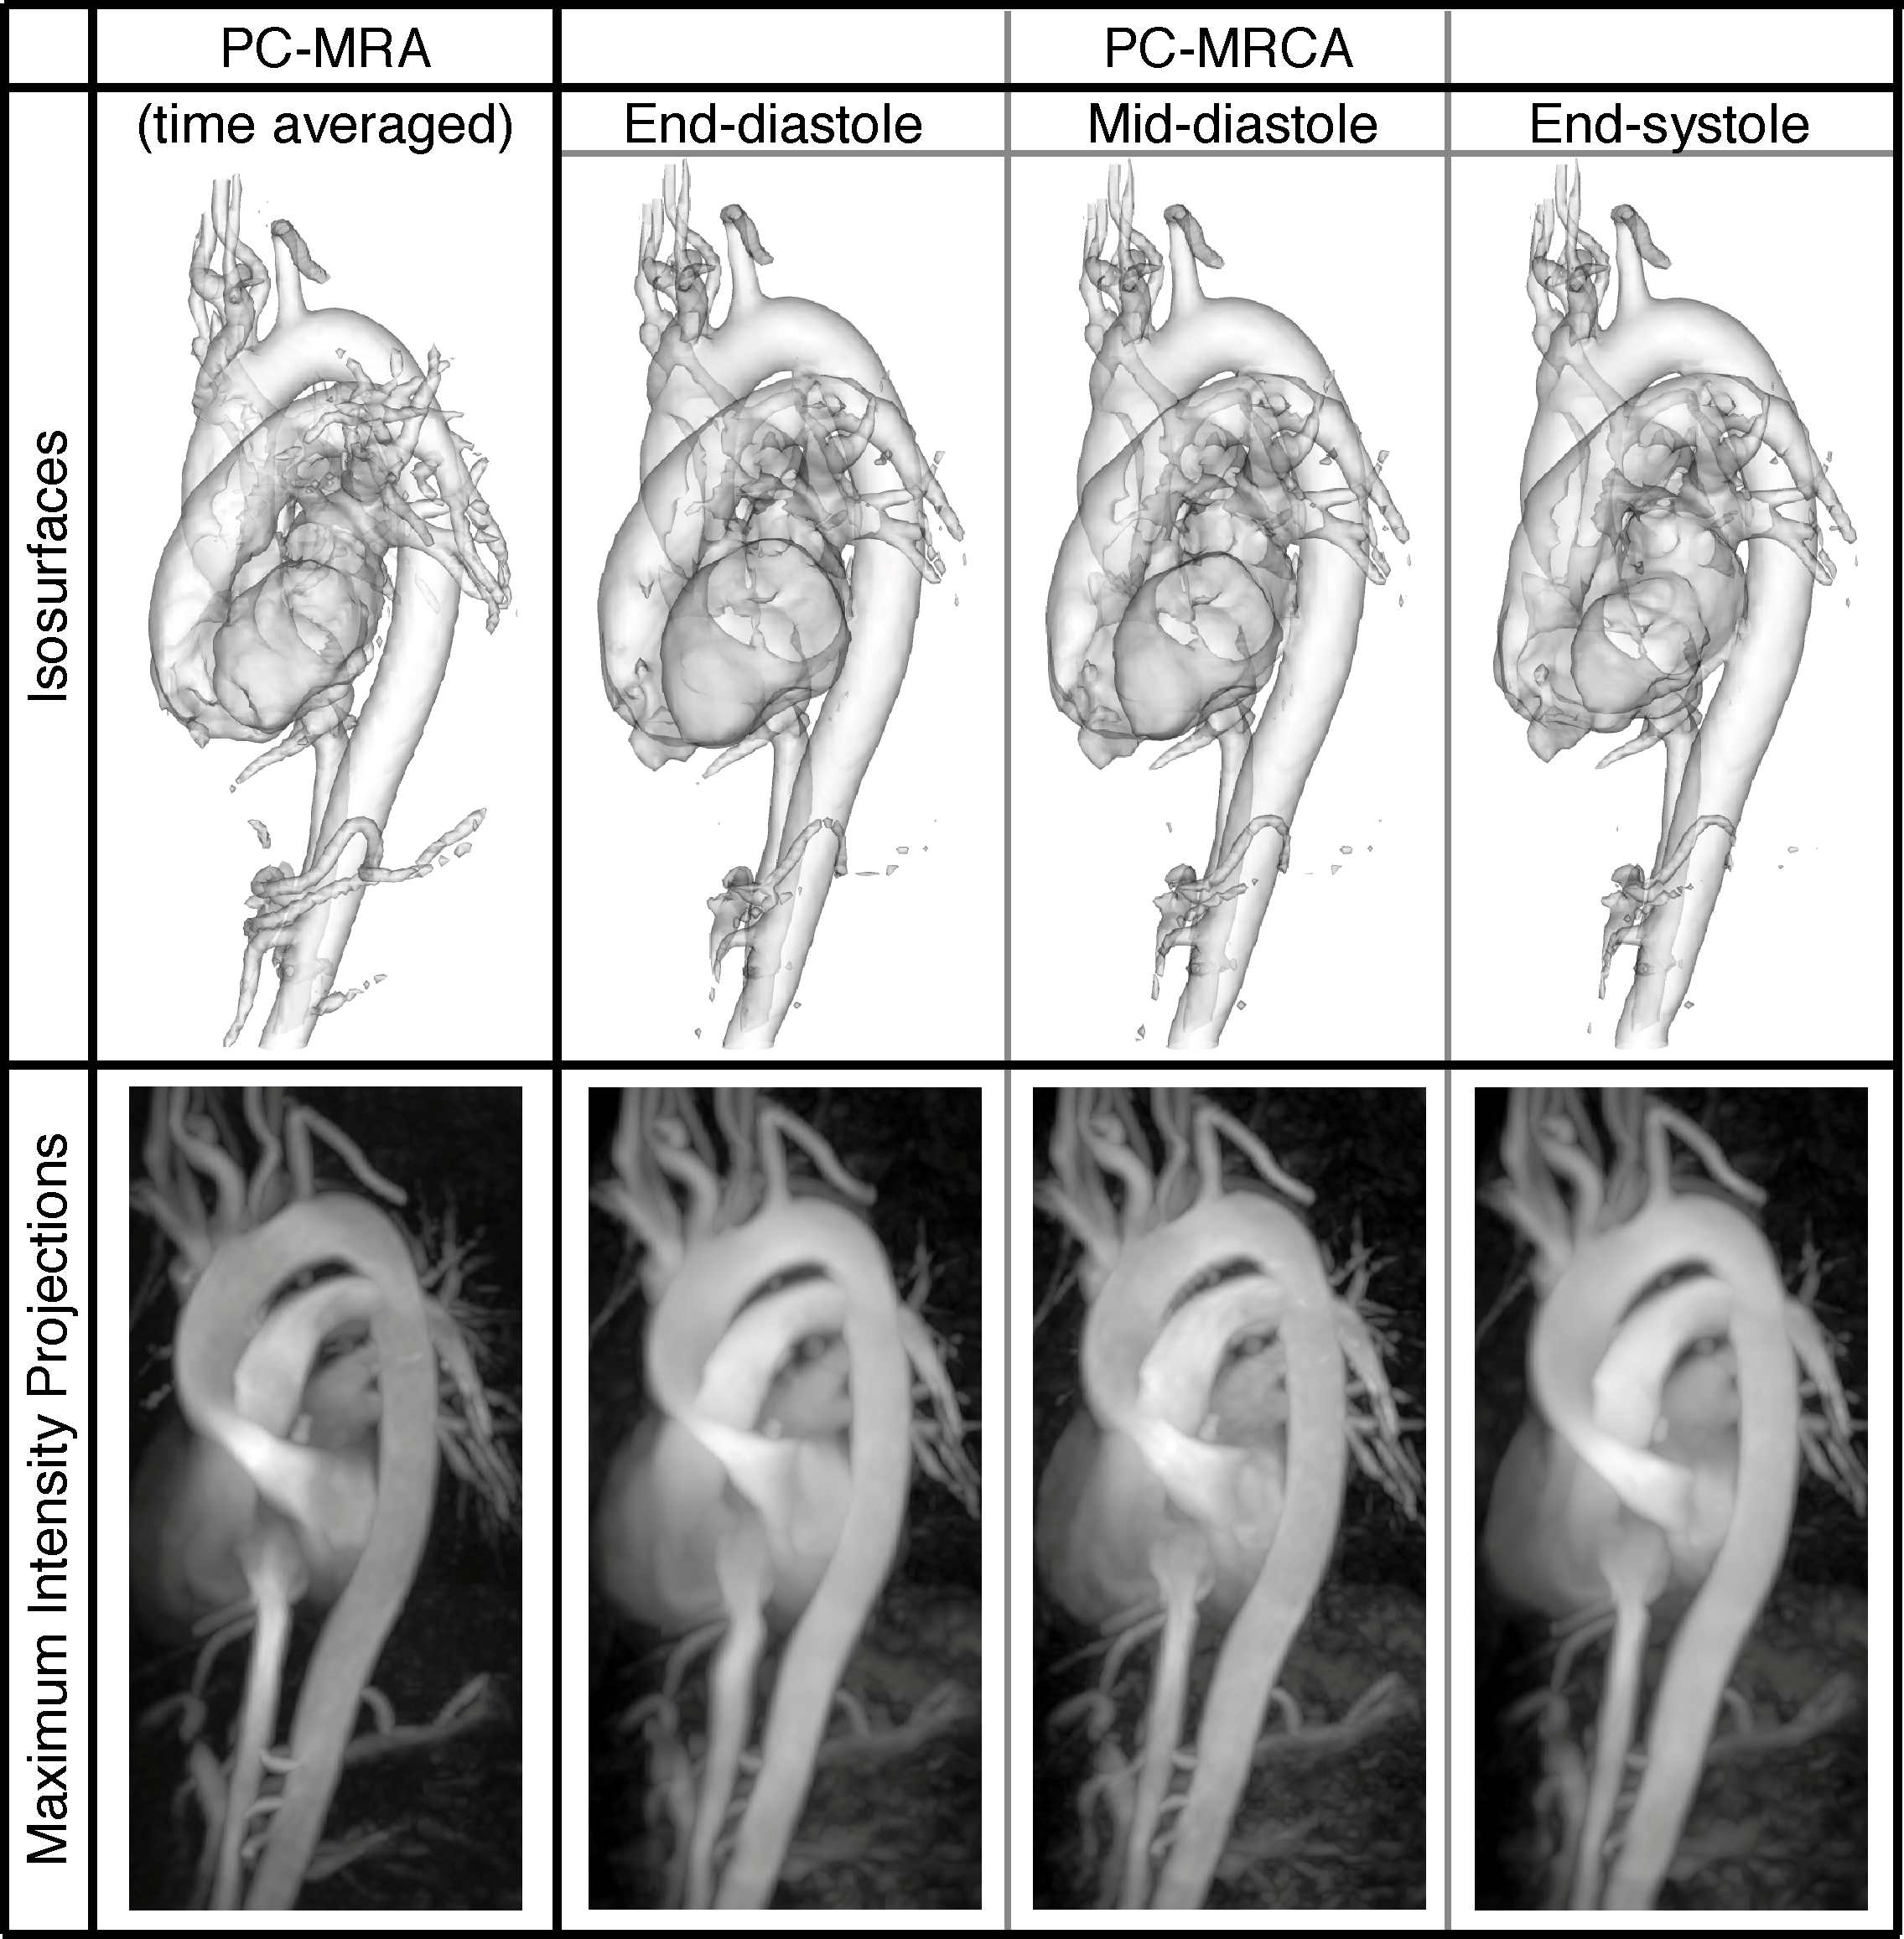
5. A new set of registrations were executed where the magnitude image of the chosen diastasis timeframe was registered to all the other available timeframes. An example of the resulting 4D PC-MRCA can be seen in Figure 2 when compared to a PC-MRA created with the method described in 2.
Evaluation of the proposed method was performed on ten 4D Flow MRI datasets acquired from healthy volunteers using a 3T Philips Ingenia scanner (Philips Healthcare, The Netherlands) with a free-breathing, navigator-gated sequence. Scan parameters included: Candy cane view adjusted to cover both ventricles, VENC 120cm/s, flip angle 10°, echo time 2.6ms, repetition time 4.4ms, spatial resolution 2.7x2.7x2.7mm, and elliptical k-space acquisition. 4D PC-MRCA and 3D PC-MRA data were generated for each dataset, and MIPs of each method were used to assess the resulting images. Anatomical regions of the cardiovascular system were scored on a scale from one to four according to their visibility in the projections, emphasizing the diagnostic quality of the evaluated image. The scoring was performed independently by two observers.
Results
4D PC-MRCA outperformed 3D PC-MRA obtaining higher averages and scores of mainly threes and fours on the defined scale, compared to mostly twos or threes for the PC-MRA (see Figure 3). The differences between the scores obtained by both techniques were highly significant (p<0.001), when comparing the scores using the Wilcoxon rank-sum test.Discussion
The proposed method to calculate four-dimensional angiographic data from 4D Flow MRI allows for improved visualization of the cardiovascular system, together with the possibility of observing the motion of the heart and vessels throughout the cardiac cycle. An isosurface rendering of a 4D PC-MRCA with segmented vessels can be seen in Figure 4. This image highlights the amount of movement that is common in regions such as the ascending aorta and pulmonary artery.
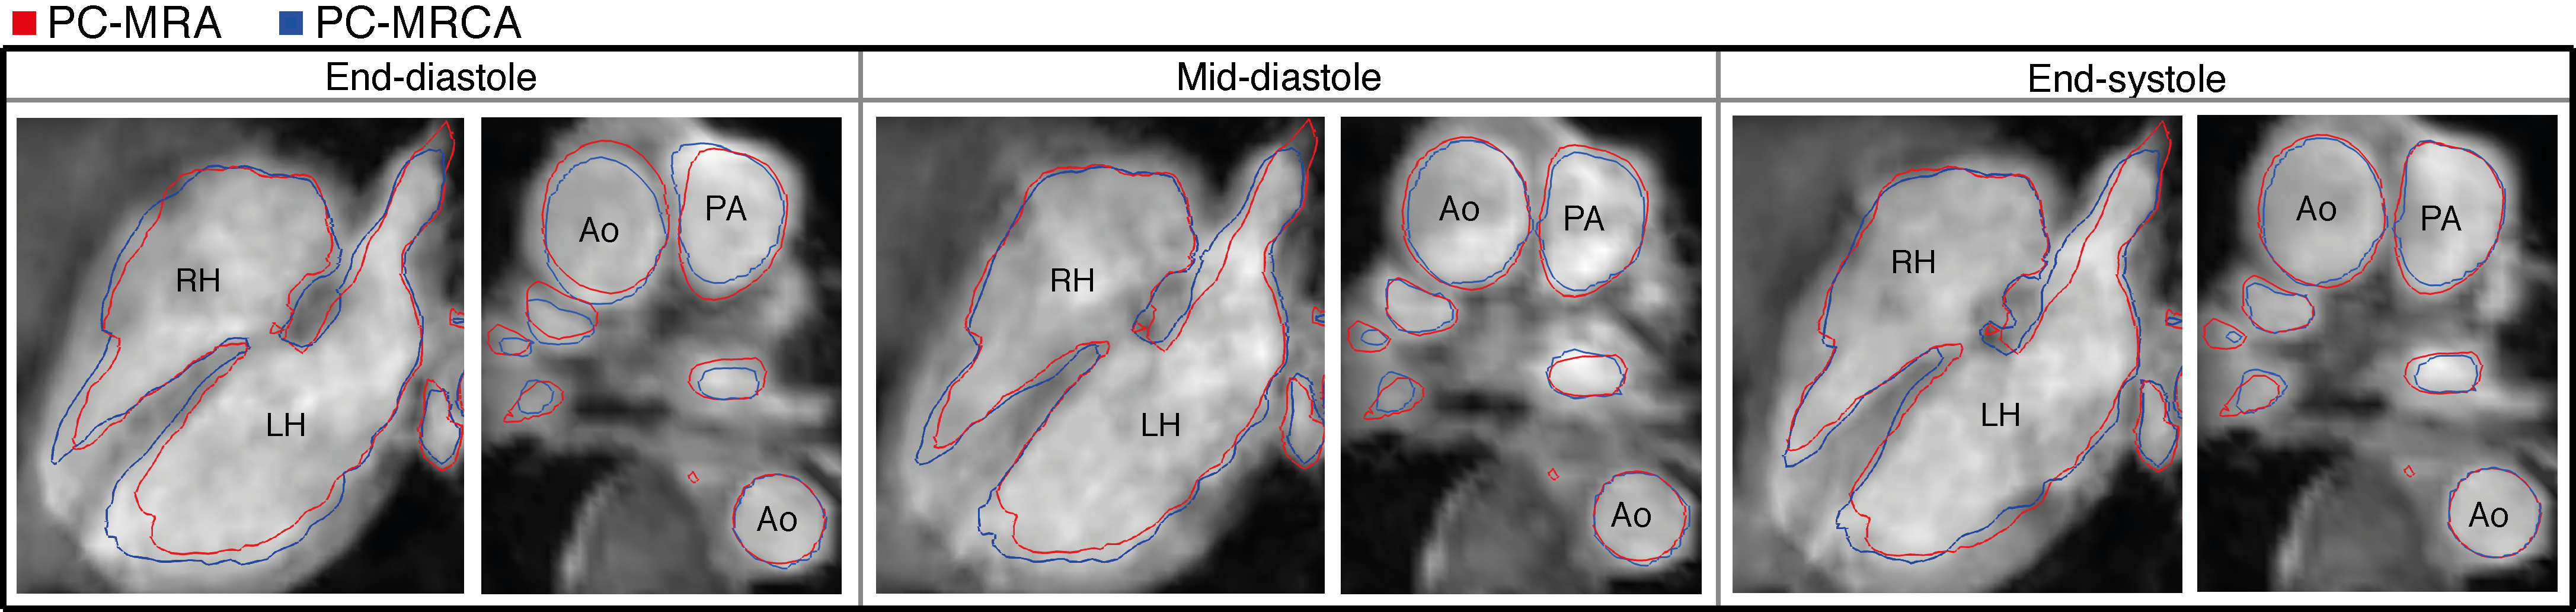
Furthermore, the movement of the myocardial and vascular walls over the cardiac cycle produced disparities between the 3D PC-MRA and the 4D PC-MRCA in several timeframes. These problems were especially visible in the ascending aorta and pulmonary artery, two regions frequently assessed with angiographic images. An example of such discrepancies can be seen in Figure 5 at end-diastole.
Conclusion
The proposed method improves the existing PC-MRA generation techniques that are based on 4D Flow MRI by effectively utilizing spatial as well as temporal blood flow information of both the heart and thoracic vasculature included in this type of acquisition. When evaluated on ten 4D flow MRI datasets, 4D PC-MRCA outperformed 3D PC-MRA, especially when cardiac or vessel motion was present.Acknowledgements
The authors would like to thank Alexandru Grigorescu Fredriksson for the valuable help provided during evaluation of the results.
This work was supported by the European Research Council [grant number 310612], the Swedish Heart and Lung foundation [grant number 20140398], and the Swedish Research Council [grant number 621-2014-6191].
References
1. Markl M, Kilner PJ, Ebbers T. Comprehensive 4D velocity mapping of the heart and great vessels by cardiovascular magnetic resonance. J Cardiovasc Magn Reson. 2011;13(1):7.
2. Hennemuth A, Friman O, Schumann C, et al. Fast interactive exploration of 4D MRI flow data. In: Wong KH, Holmes III DR, eds. International Society for Optics and Photonics; 2011:79640E.
3. Bock J, Wieben O, Johnson K, Hennig J, Markl M. Optimal processing to derive static PC-MRA from time-resolved 3D PC-MRI data. In: Proceedings 16th Scientific Meeting, International Society for Magnetic Resonance in Medicine. Vol Toronto; 2008:3053.
Figures