2796
Comparison of Simultaneous Non-Contrast Angiography and intraPlaque Hemorrhage (SNAP) and 3D Time of Flight (TOF) for Non-Contrast Intracranial MR Angiography (MRA)1Center for Biomedical Imaging Research, Department of Biomedical Engineering, School of Medicine, Tsinghua University, Beijing, People's Republic of China, 2Department of Radiology, University of Washington
Synopsis
The purpose of this study is to compare the MRA image contrast of SNAP and TOF sequences in in-vivo cerebral artery images and explore the explanation of the observation by theoretical simulation. We found TOF MRA showed better artery-background contrast than SNAP MRA in proximal large cerebral artery for all cases, but worse in distal small cerebral artery for most of the cases. The theoretical simulation considering the blood velocity and the blood travel distance in imaging slab further validated this observation, suggesting the contrast difference between SNAP and TOF were related to blood velocity and travel distance.
Introduction:
MR 3D time of flight (TOF) has been widely used as a non-contrast MR angiography (MRA) technique [1]. Recently, SNAP technique [2] has been proposed as a new non-contrast MRA technique, which can detect both luminal stenosis and intra-plaque hemorrhage in patients with atherosclerosis. A recent study showed that SNAP may have better small artery delineation capability than TOF [3]. However, the study only focused on middle cerebral artery (MCA) and its branches and lacked theoretical analysis of the MRA signal and contrast. This study aims to explore the MRA contrast difference between 3D TOF and SNAP using in-vivo data and theoretical simulation.Methods:
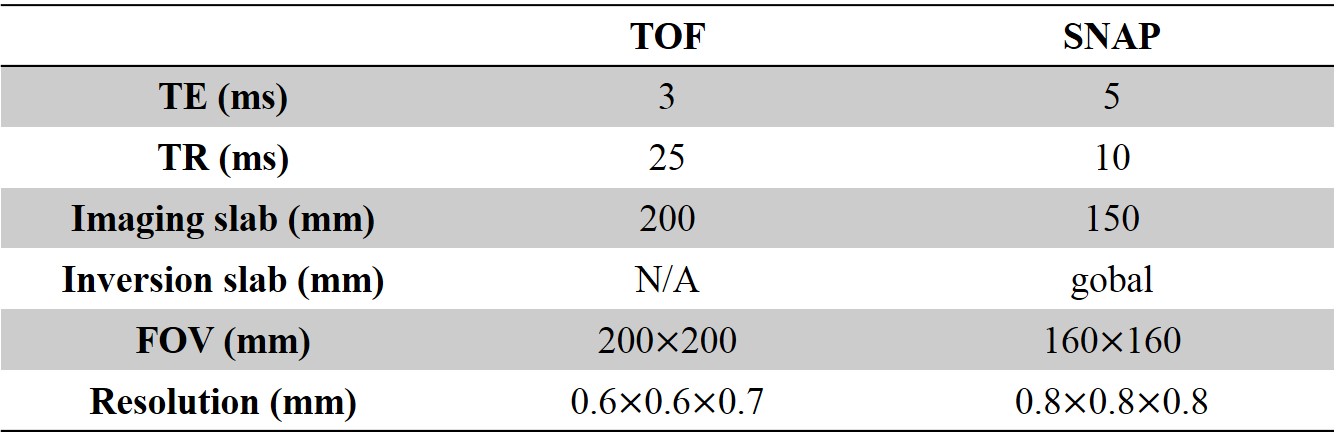
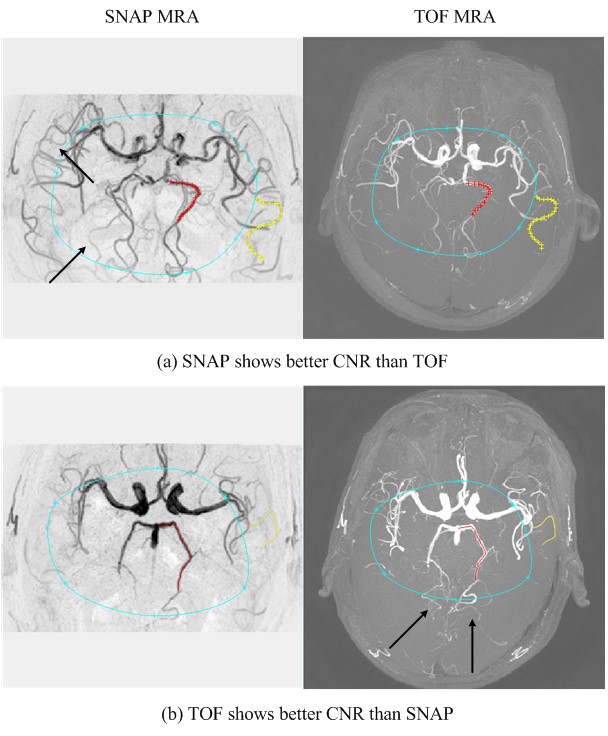
In-vivo contrast comparison: In this retrospective study, SNAP and TOF of 30 stroke patients (19 males, mean$$$\pm$$$SD age: 45.73$$$\pm$$$13.36 years) were included for analysis. All images were acquired on a 3T Philips scanner (Achieva, Philips Healthcare, Best, The Netherlands). The imaging parameters of TOF and SNAP were shown in Table 1. The coverage of TOF in axial direction was cropped as the same with SNAP and the in-plane resolution of both images was resampled to 0.5mm. Then MRA were generated by minimum/maximum intensity projection along axial direction for SNAP/TOF. The centerlines of a proximal large cerebral artery and a distal small artery were blindly delineated in the TOF and SNAP MRA (Fig. 1) by one reviewer. Then the mean intensity ($$$I_{artery}$$$) along the centerline was calculated. The background regions of interest (ROIs) were also drawn on both SNAP and TOF MRA images. The arteries within the background ROI were excluded by setting an intensity threshold. Then, the mean intensity of the left pixels in background ROI ($$$I_{background}$$$) was calculated. Thus, the contrast to noise ratio (CNR) can be given as $$$abs(I_{artery}- I_{background})/noise$$$, where the $$$noise$$$ was calculated as the standard deviation of background ROI excluding arterial pixels. The CNRs of the proximal large cerebral artery and distal small cerebral artery between SNAP and TOF MRAs were compared using paired t-test. Simulation: In the traditional simulation model of SNAP and TOF, the blood was usually assumed fresh when imaging [2, 4]. In this study, a more realistic simulation was performed by considering the multiple excitations of the blood spins under different flow velocities and different travel distances (L1) that the spin has flown through within the imaging slab. The image contrast between artery and background in the MRA image is calculated as $$$abs(I_{artery}- I_{background})$$$, assuming same noise level for SNAP and TOF MRA. The following parameters were used for simulation: blood T1=1550ms, blood T2=275ms [5], white matter T1=832ms, white matter T2=110ms [6], blood velocity ranging from 10 cm/s to 60cm/s, and L1 ranging from 5mm to 300mm.Result:
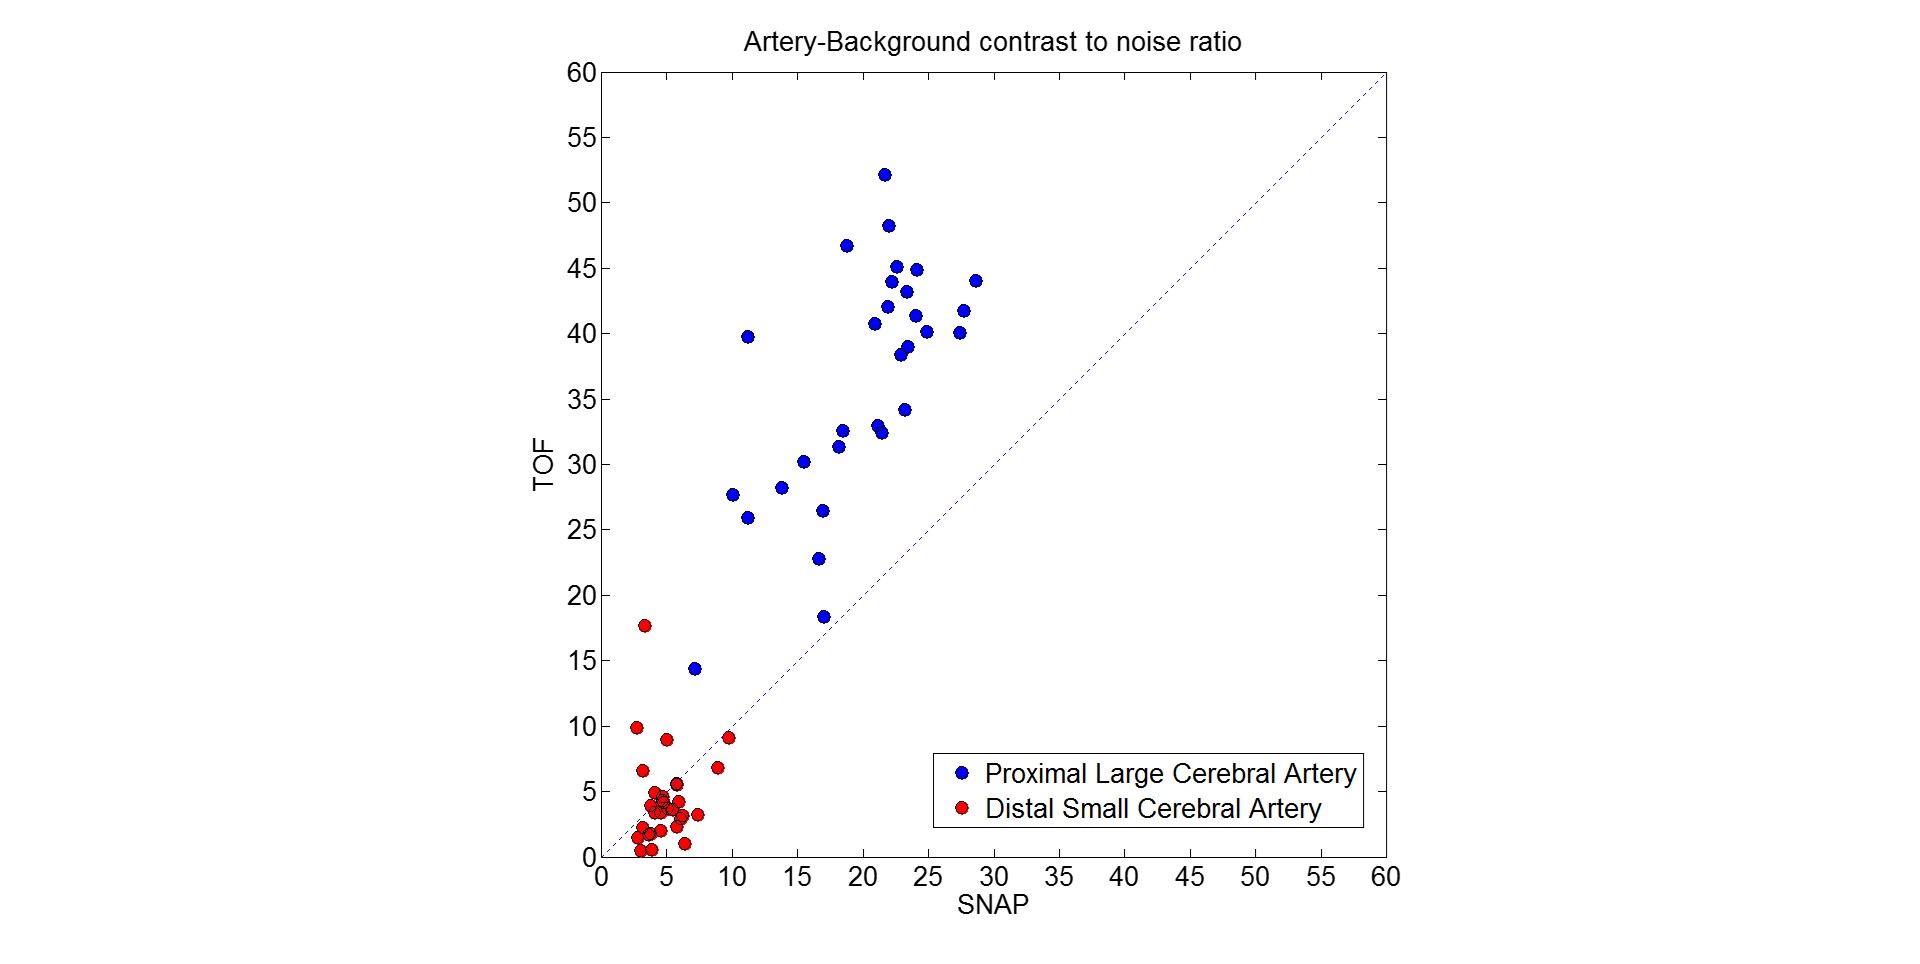
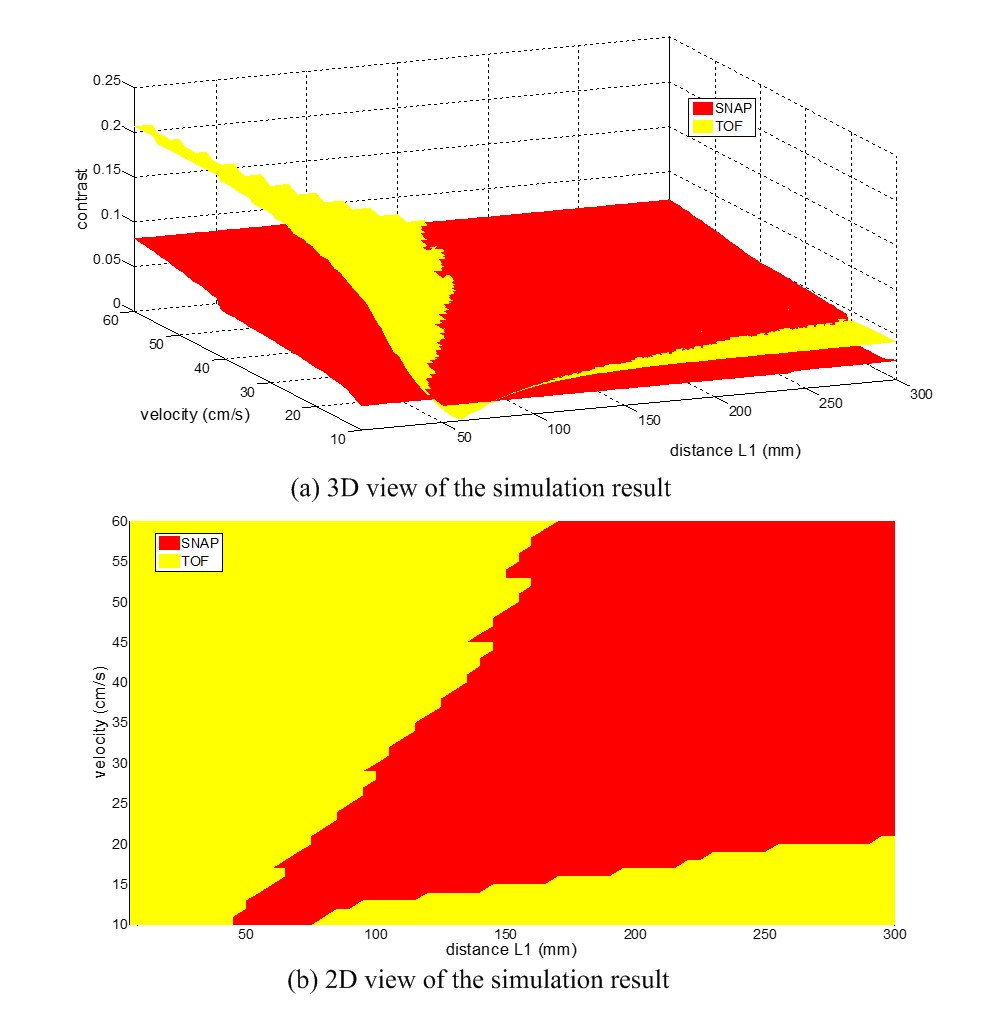
The MRA CNR comparison of the in vivo images is shown in Fig. 2. The CNR of proximal large cerebral arteries were significantly higher than distal small cerebral arteries in both SNAP (p<0.001) and TOF (p<0.001). For proximal large cerebral artery, the CNR of TOF MRA was larger than that of SNAP MRA in all subjects (p<0.001). However, for distal small cerebral artery, the CNR of SNAP MRA was larger than that of TOF MRA in most of cases (24/30), and the difference wasn’t statistically significant (4.9 vs 4.4, p=0.521). Fig. 1 also shows two case in which SNAP and TOF have better distal small artery delineation than the other one respectively. The simulation results further explained the in-vivo results (Fig. 3). In proximal arteries, where blood travel distance is short, TOF MRA has better CNR at all simulated blood velocity (Fig. 3b). On the other hand, in distal arteries, where blood travel distance is long, the SNAP MRA has better CNR when blood velocity is high enough, but TOF MRA may have better CNR when blood velocity is low (Fig. 3b). Overall, the arteries with shorter blood travel distance has better CNR (Fig. 3a).Discussion and Conclusion:
This study showed the difference of MRA CNR between SNAP and TOF in in-vivo experiment, and further explained the cause of difference via simulation. This study found that SNAP MRA have lower CNR in large proximal cerebral arteries, and usually have higher CNR in small distal cerebral arteries. More importantly, these results suggested that the CNR difference between TOF MRA and SNAP MRA may be an indicator of the blood flow velocity with known cerebral artery position. For example, our simulation results indicated that the blood flow velocity may be low in those six patients whose distal small arteries had better CNR in TOF MRA than SNAP MRA.Acknowledgements
No acknowledgement found.References
1. Heiserman, J.E., et al., Intracranial vascular stenosis and occlusion: evaluation with three-dimensional time-of-flight MR angiography. Radiology, 1992. 185(3): p. 667-673.
2. Wang, J., et al., Simultaneous Non-contrast Angiography and intraPlaque hemorrhage (SNAP) imaging for carotid atherosclerotic disease evaluation. Magnetic resonance in medicine : official journal of the Society of Magnetic Resonance in Medicine / Society of Magnetic Resonance in Medicine, 2013. 69(2): p. 337-345.
3. Wang, J., et al., In Vivo Validation of Simultaneous Non-Contrast Angiography and intraPlaque Hemorrhage (SNAP) Magnetic Resonance Angiography: An Intracranial Artery Study. PLoS ONE, 2016. 11(2): p. e0149130.
4. Dumoulin, C.L., et al., Three-dimensional time-of-flight magnetic resonance angiography using spin saturation. Magnetic Resonance in Medicine, 1989. 11(1): p. 35-46.
5. Noeske, R., et al., Human cardiac imaging at 3 T using phased array coils. Magnetic Resonance in Medicine, 2000. 44(6): p. 978-982.
6. Wansapura, J.P., et al., NMR relaxation times in the human brain at 3.0 tesla. Journal of Magnetic Resonance Imaging, 1999. 9(4): p. 531-538.
Figures