2795
Quantification of Cerebrovascular Tortuosity of the SCD Patients using Angiography1Division of Cardiology, University of Southern California, Los Angeles, CA, United States, 2Biomedical Engineering, University of Southern California, Los Angeles, CA, United States, 3Cedars-Sinai Medical Center, Los Angeles, CA, United States, 4Radiology, Children's Hospital of Los Angeles, Los Angeles, CA, United States, 5Hematology Oncology, Children's Hospital Los Angeles, Los Angeles, CA, United States, 6Pediatrics and Radiology, Children's Hospital Los Angeles, Los Angeles, CA, United States, 7Neonatology, Children's Hospital Los Angeles, Los Angeles, CA, United States
Synopsis
Stroke is a critical complication of Sickle Cell Disease (SCD) and is predicted by increased transcranial Doppler velocities. Recent computational fluid dynamic studies demonstrate a combination of high flow and vessel tortuosity are responsible for high TCD velocities. We determined the predictors of vessel tortuosity in control subjects and SCD patients without known vasculopathy. We applied three different tortuosity metrics (distance measure, inflection count, and sum of angles method) to middle cerebral artery segments measured in 19 SCD patients and 13 controls. Both distance and inflection count metrics were increased in SCD patients but the distance metric was more discriminatory. Age and hemoglobin levels were the strongest predictors of tortuosity in SCD patients. Both terms were retained in multivariate analysis, suggesting that chronic anemia exacerbates the normal increase in vessel tortuosity with age.
Introduction
Children with sickle cell disease (SCD) and increased middle cerebral artery (MCA) velocity have an increased risk of stroke 1. Increased MCA velocity is caused by a combination of increased flow and vessel tortuosity 2. In this study, we compared the tortuosity of the MCA in otherwise healthy SCD patients to age and ethnicity-matched controls to determine if preclinical vasculopathy was detectable. There are several metrics for calculating tortuosity, with each measure having different properties. The distance metric (DM) is the ratio of the total path length to the Euclidean distance between beginning and end of the vessel. It is simple, robust, and widely used. The inflection count metric (ICM) multiples the DM by the number of inflection points along the vessel 3,4, providing sensitivity to bends in the arteries. The sum of angles metric (SOAM) integrates the curvature of the vessel, and normalizes this by the path length 4. SOAM provides sensitivity to remodeling outside of a single plane (e.g. helical redundancy). We also explored predictors of vessel tortuosity including age, sex, blood viscosity, complete blood counts, hemoglobin S concentration, reticulocyte count and markers of hemolysis.Method
This study was approved by the institutional review board and performed at Children's Hospital Los Angeles. We recruited nineteen SCD patients (25.0 ± 9.9 years) and 13 ethnically-matched control subjects (21.1± 7.3 years). Exclusion criteria were: previous stroke, current pregnancy and acute chest pain which required hospitalization within one month. All patients underwent a cerebral MRA using three-dimensional time-of-flight angiography of the circle of Willis. Sequence parameters were TR=23 ms, TE=3.5 ms, 150 slices, 0.7 mm thick and a directional field of view of 10.5 cm. For centerline identification in MRA, we used Autoplaque, which is a vessel tracking algorithm 5. Beginning at the intersection of the posterior communicating artery, the first two bifurcations of MCA were identified and the central line along the vessels was selected, interpolated and smoothed with a B-spline. The tortuosity of these vessels was calculated using the DM, ICM and SOAM.Results
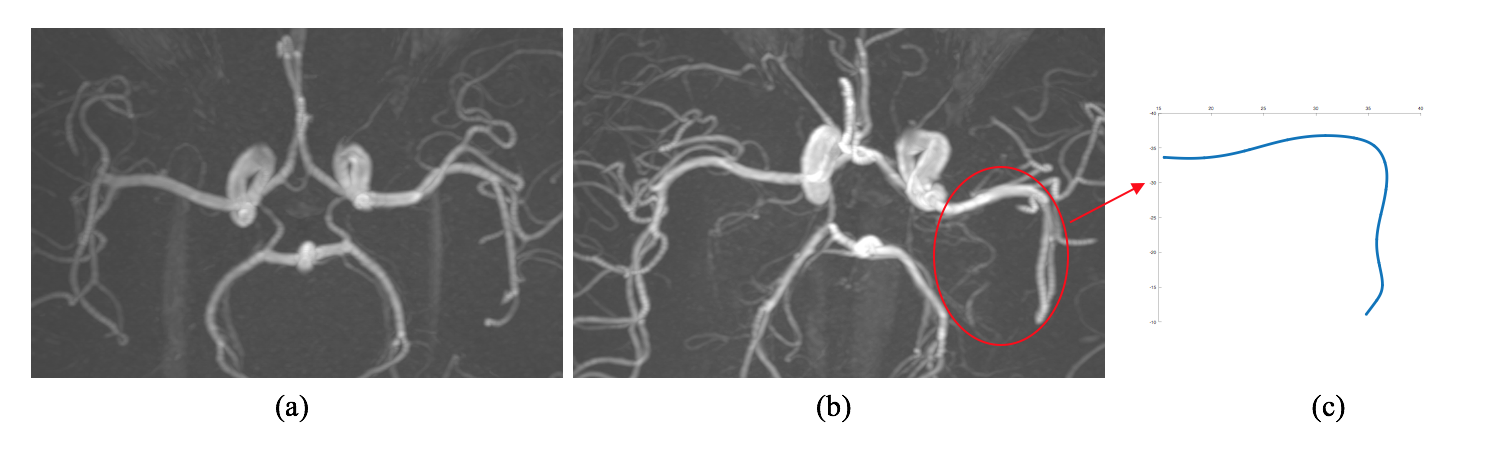
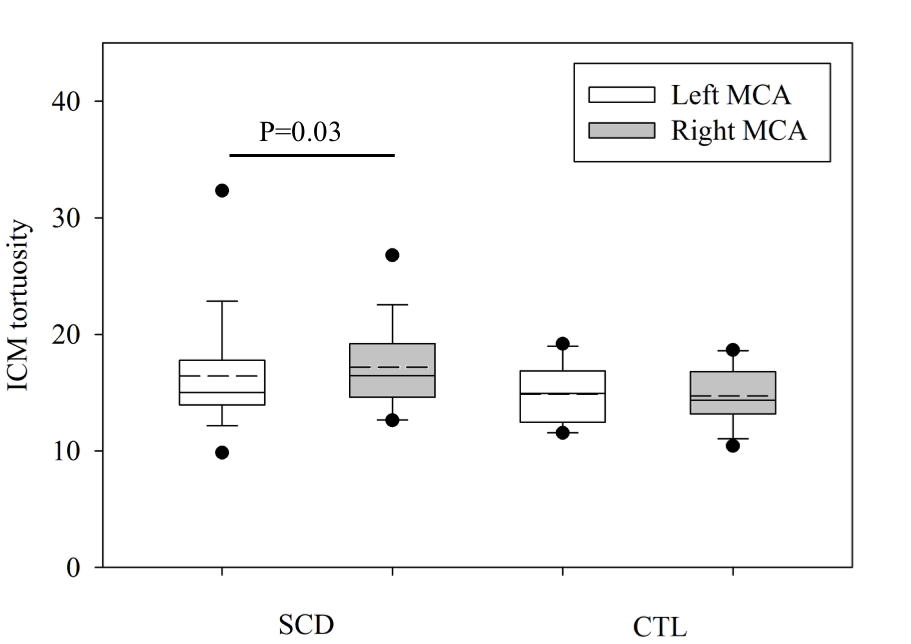
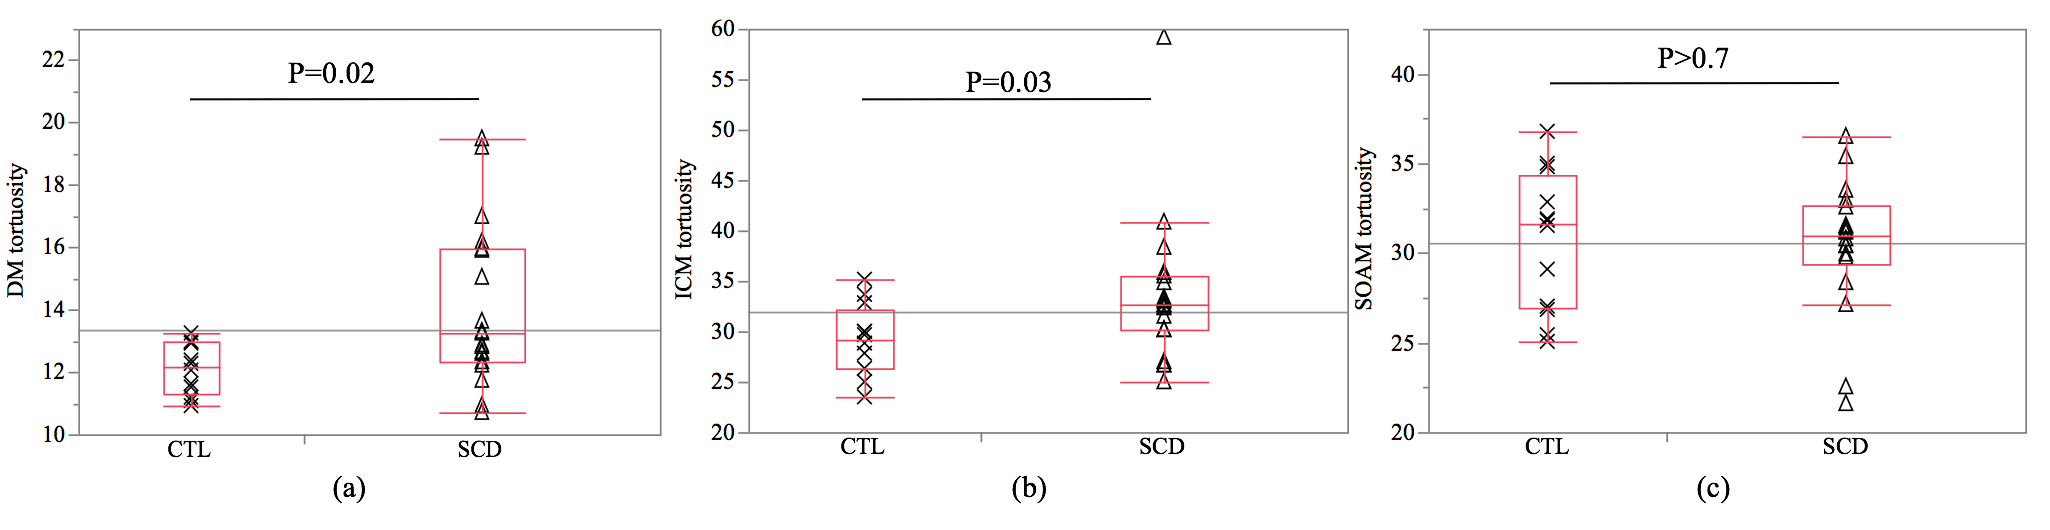
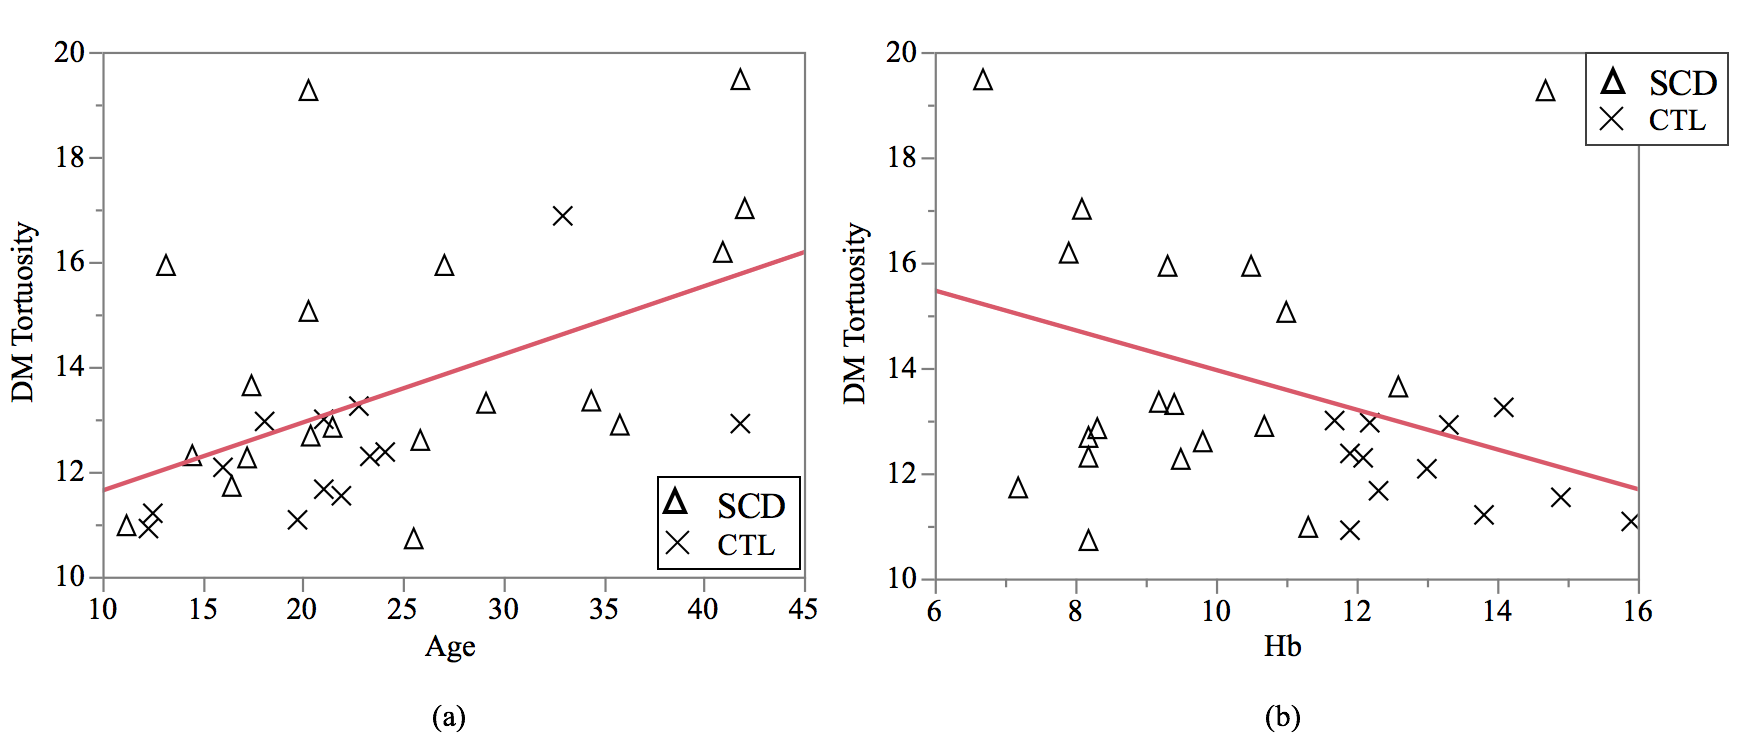
Figure 1 illustrates the visual difference between the circle of Willis of a typical control subject and a typical SCD patient. The tortuosity measurements were not normally distributed, so a Wilcoxon test was applied to test for differences in the metrics. There was no significant difference in the tortuosity of the left and right MCAs within each group using DM and SOAM (p>0.1, p>0.8 respectively), but the right MCA was more tortuous than the left MCA in the SCD patients using the ICM metric (p=0.03). Figure 2 illustrates this significant difference between left and right MCAs in SCD patients and control subjects. SCD patients had significantly higher DM (p=0.02) and ICM (p=0.03) measurements than control subjects, but the SOAM measurements were not different (p>0.7), Figure 3. There is a correlation between the DM and ICM metrics with an r-squared value of 0.53 (p< 0.001, not shown). There was no sex difference in SCD patients and control subjects (p>0.6). The strongest predictor of tortuosity measurement was age (p<0.01). After controlling for age the next strongest predictor was the hemoglobin level: patients with lower hemoglobin levels had higher DM tortuosity, Figure 4.Conclusion
Taken together, results of the DM, ICM, and SOAM tortuosity metrics suggest that SCD patients have longer, more curved vessels, without increased secondary bending or helical changes, consistent with an exaggeration of normal aging: lower hemoglobin levels are related to higher DM tortuosity.
( J Coloigner and M Borzage made equal contributions)
Acknowledgements
No acknowledgement found.References
1. Adams, R.J., McKie, V.C., Carl, E.M., Nichols, F.T., Perry, R., Brock, K., McKie, K., Figueroa, R., Litaker, M., Weiner, S., Brambilla, D., 1997. Long-term stroke risk in children with sickle cell disease screened with transcranial doppler. Ann. Neurol. 42, 699–704. doi:10.1002/ana.410420505
2. Rivera, C.P., Veneziani, A., Ware, R.E., Platt, M.O., 2016. Original Research: Sickle cell anemia and pediatric strokes: Computational fluid dynamics analysis in the middle cerebral artery. Exp. Biol. Med. Maywood NJ 241, 755–765. doi:10.1177/1535370216636722
3. Dey, D., Achenbach, S., Schuhbaeck, A., Pflederer, T., Nakazato, R., Slomka, P.J., Berman, D.S., Marwan, M., 2014. Comparison of quantitative atherosclerotic plaque burden from coronary CT angiography in patients with first acute coronary syndrome and stable coronary artery disease. J. Cardiovasc. Comput. Tomogr. 8, 368–374. doi:10.1016/j.jcct.2014.07.007
4. Bullitt, E., Gerig, G., Pizer, S.M., Lin, W., Aylward, S.R., 2003. Measuring tortuosity of the intracerebral vasculature from MRA images. IEEE Trans. Med. Imaging 22, 1163–1171. doi:10.1109/TMI.2003.816964
5. Dey D, Achenbach S, Schuhbaeck A, et al. Comparison of quantitative atherosclerotic plaque burden from coronary CTangiography in patients with first acute coronary syndrome and stable coronary artery disease. J Cardiovasc Comput Tomogr. 2014;8:368–374.
Figures