2792
Clinical outcomes after magnetic resonance angiography (MRA) compared to computed tomographic angiography (CTA) for pulmonary embolism evaluation1Radiology, University of Wisconsin, Madison, WI, United States, 2Emergency Medicine, University of Wisconsin, United States, 3University of Wisconsin, United States, 4Biostatistics, University of Wisconsin
Synopsis
In this retrospective case-control study of 1173 subjects with suspected pulmonary embolism, the 6-month rate of major adverse events (venous thromboembolic, major bleeding, or death) was lower following contrast-enhanced magnetic resonance angiography (MRA) (5.4%) than following computed tomographic angiography (CTA) (13.4%, p < 0.001). The technical success rate of MRA (92.6%) and CTA (90.5%) performed in a routine clinical setting did not differ significantly (p = 0.41). MRA is a clinically effective imaging exam for the primary evaluation of pulmonary embolism.
Introduction
The largest diagnostic efficacy study comparing magnetic resonance angiography (MRA) with computed tomographic angiography (CTA) for the purpose of pulmonary embolism (PE) detection was the PIOPED III study.1 That study, however, used older MRA technology and did not assess clinical outcomes. Furthermore, there is growing concern that the use of CTA may be resulting in the over-treatment of clinically insignificant subsegmental PE.2-4 For this reason, diagnostic efficacy studies using CTA as a reference standard may not be the most clinically relevant approach. In the setting of suspected pulmonary embolism, clinically relevant patient outcomes5 can be measured by the incidence of adverse events potentially related to PE or its treatment (e.g., death, venous thromboembolic events, or bleeding events).Purpose
To compare 6-month patient outcomes following MRA with those following CTA ordered for suspected PEMethods
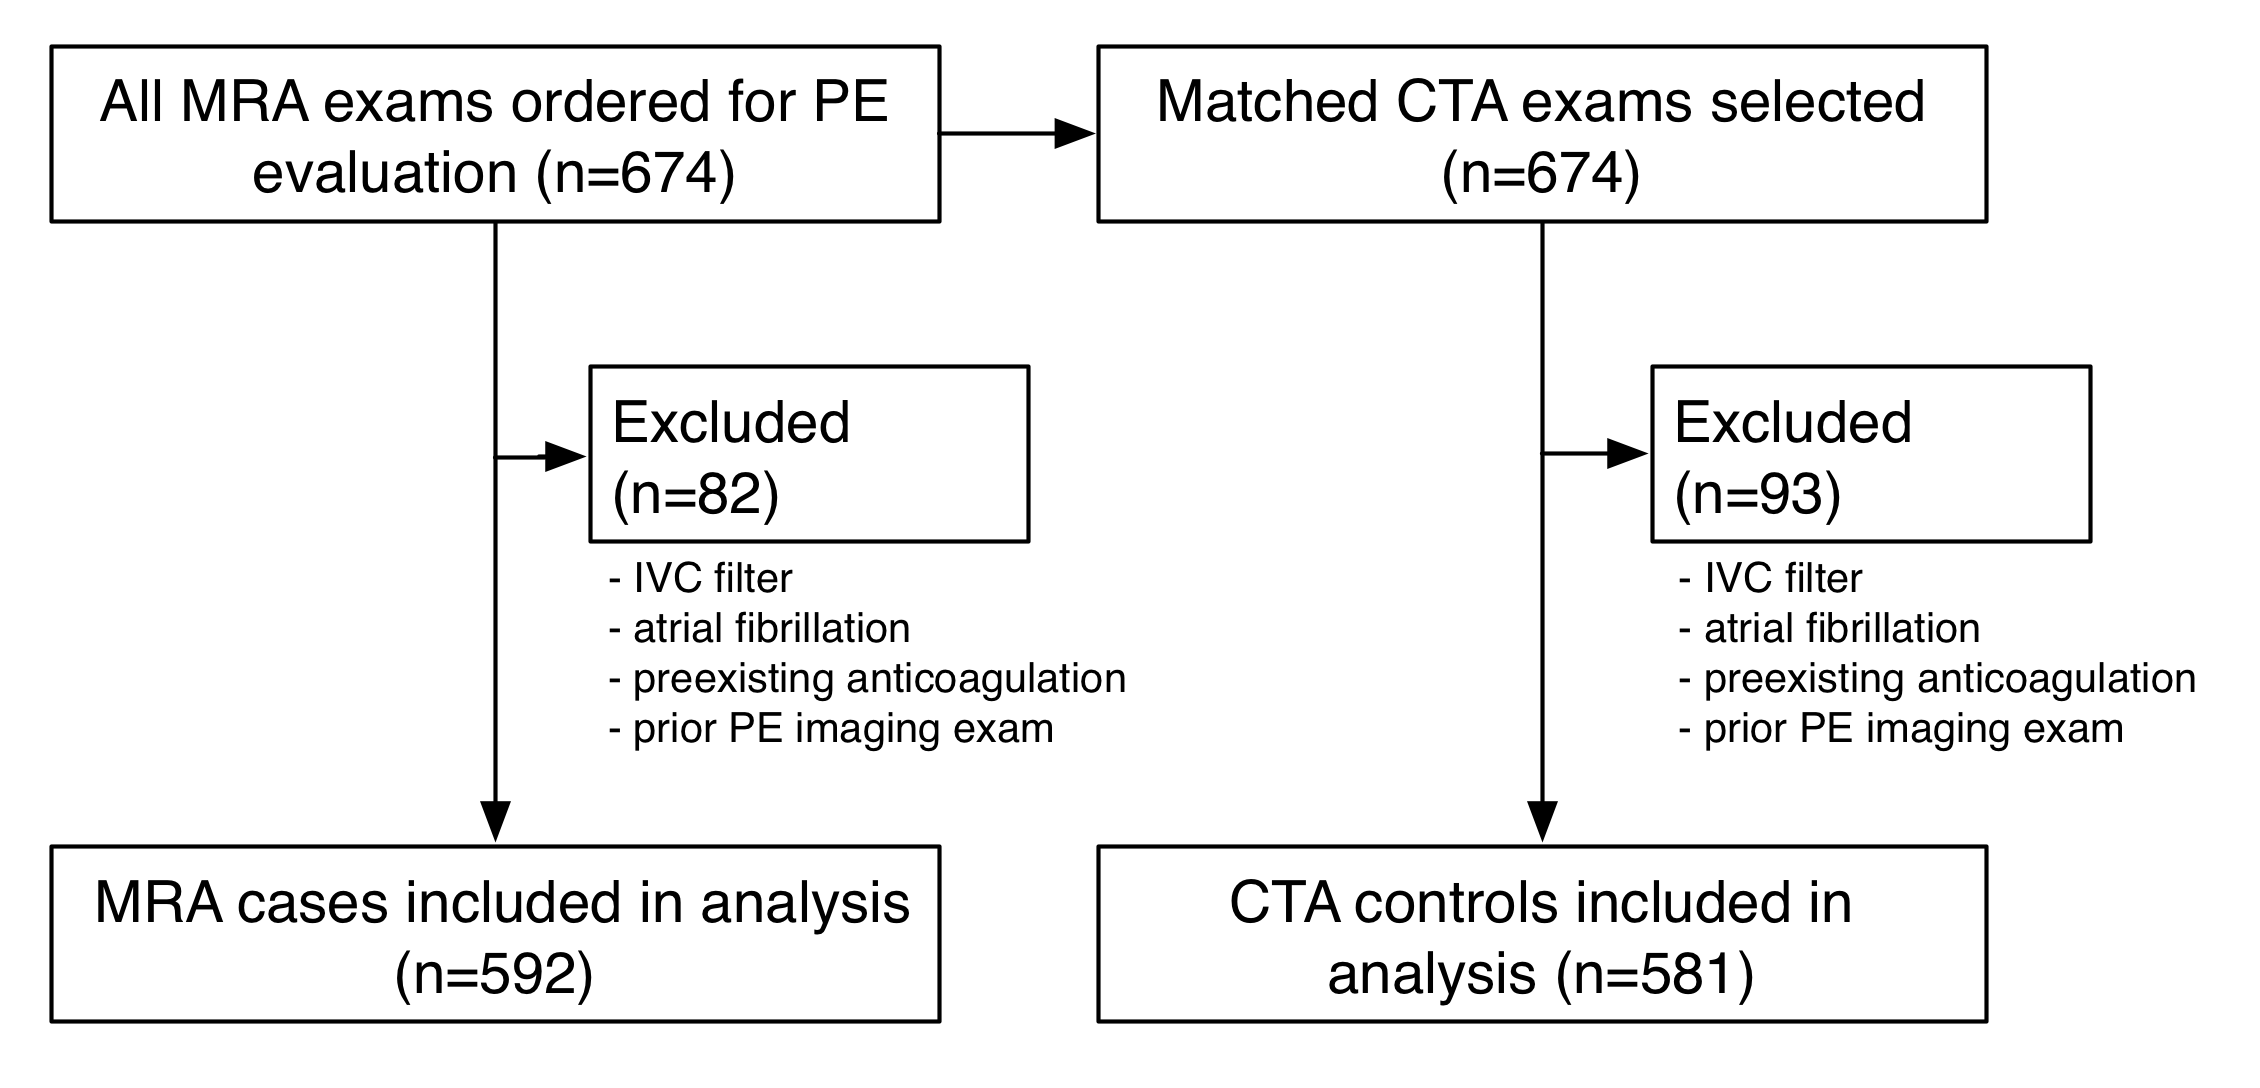
In this IRB-approved retrospective case-control study, we reviewed the medical records of all patients evaluated for PE with MRA during a 5-year period (4/1/2008–3/31/2013) along with age- and sex-matched controls evaluated with CTA during the same period. All MRA exams were performed as clinical care using a previously published protocol.6,7
We excluded those for whom the identified imaging exam was not the first imaging exam performed for PE within the inclusion dates. We also excluded all subjects with a preexisting IVC filter, with atrial fibrillation, or who were on anticoagulation for at least 30 days prior to the index exam. The analysis included 1173 subjects -- 592 evaluated with MRA and 581 with CTA (Figure 1).
Medical records data abstraction followed a pre-defined protocol that included specific definitions of outcome measures. We recorded baseline demographic data, referral source, and two widely used clinical decision rules for PE risk stratification: Wells’ Score and Revised Geneva Score.8,9
The primary endpoint was an adverse event due to bleeding10, venous thromboembolism (VTE), or death during the 6 months following the imaging examination. Secondary endpoints were the MRA versus CTA imaging results (positive, negative, or equivocal for PE) and technical success, based upon the clinical radiology report.
The abstractors flagged ambiguous data for review by an expert panel of three investigators (two radiologists and an emergency medicine physician). The expert panel met in person 5 times during the 11-month data abstraction process to review the ambiguous data and reached its decisions by consensus opinion, with close reference to the a priori study protocol. The members of the expert panel re-abstracted a randomly selected sample of the records, blinded to the results of the primary abstraction, to monitor the performance of the abstractors.
Chi-square test for independence and Fisher's exact test were used with p<0.05 significance threshold.
Results
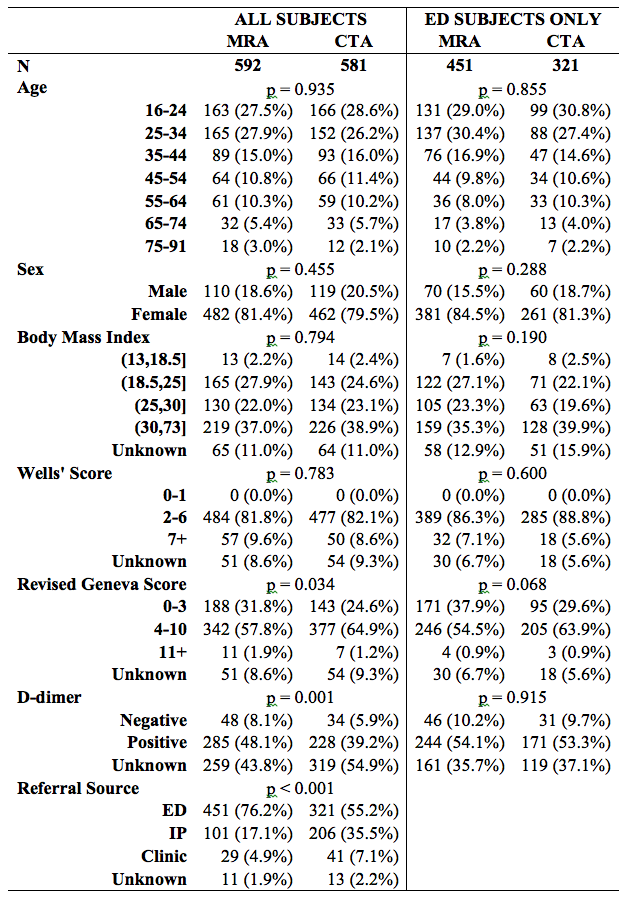
The MRA and CTA groups did not differ significantly in demographics or Wells’ Score. A larger proportion of the CTA subjects were referred as inpatients (p < 0.001). Subgroup analysis of only those 772 subjects referred from the ED showed no significant difference in any demographic feature or PE risk factor score (Figure 2).
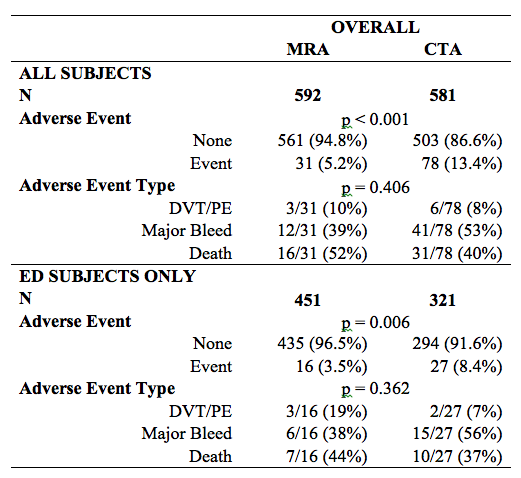
The 6-month adverse event rate following MRA (5.2%) was lower than following CTA (13.4%, p<0.001). Amongst ED patients, the 6-month adverse event rate was 3.5% following MRA and 8.4% following CTA (p = 0.006). There was no significant difference in the distribution of types of adverse events between the groups (p = 0.41 overall; p = 0.36 for ED) (Figure 3).
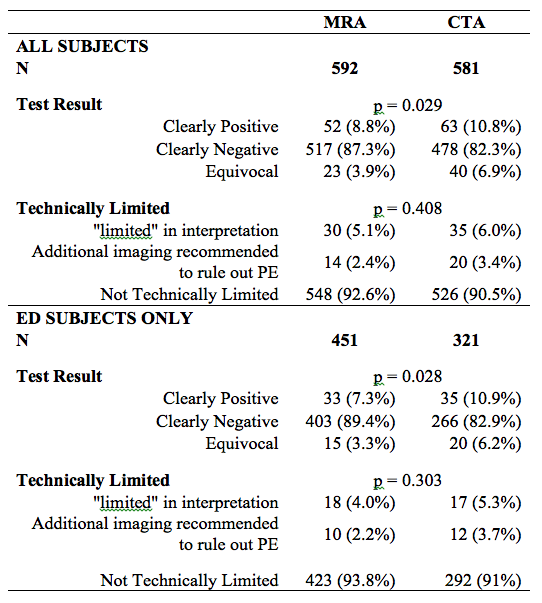
The CTA group had more positive (10.8% vs 8.8%) and equivocal (6.9% vs 3.9%) exams than the MRA group (p=0.029). The technical success rate did not differ significantly between MRA (92.5%) and CTA (90.6%) groups (p=0.41) (Figure 4).
Of the 92 subjects whose records were re-abstracted by members of the expert panel, 89 had no adverse event and 3 had an adverse event. All over-reads agreed with the results of the primary abstraction.
Discussion
This is the first large controlled study comparing the clinically relevant 6-month outcomes of patients who underwent MRA versus those who underwent CTA as the first-line test for the diagnosis of PE. It shows that actual clinical outcomes following MRA are at least as good as following CTA, despite similar risk factors for PE at the time of imaging. Furthermore, technical success rates and equivocal interpretation rates for MRA and CTA in our study did not differ significantly. This is likely due to a combination of maturing scanner technology, including improved phased array coils and advanced parallel imaging algorithms, as well as protocol optimization.7,11 This is strong evidence that MRA is a safe and clinically effective test for primary detection of PE.Acknowledgements
NIH UL1 TR000427, NIH KL2 TR000428, and NIH K24 DK102595References
1. Stein PD, Chenevert TL, Fowler SE, et al. Gadolinium-enhanced magnetic resonance angiography for pulmonary embolism: a multicenter prospective study (PIOPED III). Ann Intern Med 2010;152:434–43, W142–3.
2. Carrier M, Righini M, Wells PS, Perrier A, Anderson DR, RODGER MA, PLEASANCE S, LE GAL G. Subsegmental pulmonary embolism diagnosed by computed tomography: incidence and clinical implications. A systematic review and meta-analysis of the management outcome studies. Journal of Thrombosis and Haemostasis 2010;8:1716–1722.
3. Carrier M, Righini M, LE GAL G. Symptomatic subsegmental pulmonary embolism: what is the next step? Journal of Thrombosis and Haemostasis 2012;10:1486–1490.
4. Wiener RS, Schwartz LM, Woloshin S. Time trends in pulmonary embolism in the United States: evidence of overdiagnosis. Arch Intern Med 2011;171:831–837.
5. Douglas PS, Taylor A, Bild D, Bonow R, Greenland P, Lauer M, Peacock F, Udelson J. Outcomes research in cardiovascular imaging: report of a workshop sponsored by the National Heart, Lung, and Blood Institute. In: Vol. 22. 2009. pp. 766–773.
6. Schiebler ML, Nagle SK, Francois CJ, Repplinger MD, Hamedani AG, Vigen KK, Yarlagadda R, Grist TM, Reeder SB. Effectiveness of MR angiography for the primary diagnosis of acute pulmonary embolism: Clinical outcomes at 3 months and 1 year. J. Magn. Reson. Imaging 2013;38:914–925.
7. Nagle SK, Schiebler ML, Repplinger MD, Francois CJ, Vigen KK, Yarlagadda R, Grist TM, Reeder SB. Contrast enhanced pulmonary magnetic resonance angiography for pulmonary embolism: Building a successful program. Eur J Radiol 2016;85:553–563.
8. Wells PS, Anderson DR, Rodger M, et al. Derivation of a simple clinical model to categorize patients probability of pulmonary embolism: increasing the models utility with the SimpliRED D-dimer. Thromb. Haemost. 2000;83:416–420.
9. Le Gal G, Righini M, Roy P-M, Sanchez O, Aujesky D, Bounameaux H, Perrier A. Prediction of pulmonary embolism in the emergency department: the revised Geneva score. Ann Intern Med 2006;144:165–171.
10. Schulman S, Kearon C, Subcommittee on Control of Anticoagulation of the Scientific and Standardization Committee of the International Society on Thrombosis and Haemostasis. Definition of major bleeding in clinical investigations of antihemostatic medicinal products in non-surgical patients. J. Thromb. Haemost. 2005;3:692–694.
11. Kalb B, Sharma P, Tigges S, Ray GL, Kitajima HD, Costello JR, Chen Z, Martin DR. MR imaging of pulmonary embolism: diagnostic accuracy of contrast-enhanced 3D MR pulmonary angiography, contrast-enhanced low-flip angle 3D GRE, and nonenhanced free-induction FISP sequences. Radiology 2012;263:271–278.
Figures