2791
Quantitative 3D Dynamic Contrast Enhanced (DCE) Imaging of Carotid Vessel Wall by Fast T1 Mapping1Biomedical Imaging Research Institute, Cedars-Sinai Medical Center, Los Angeles, CA, United States, 2Department of Bioengineering, University of California, Los Angeles, Los Angeles, CA, United States
Synopsis
Dynamic contrast enhanced (DCE) MRI is a promising technique to quantitatively evaluate the inflammatory status of atherosclerosis noninvasively. However, its demanding sampling requirement leads to sacrifices in slide resolution, coverage, and/or temporal resolution in the applications to vessel wall imaging. In this work we designed accelerated dynamic T1-mapping technique using Low Rank Tensor (LRT) framework to achieve 3D high-resolution quantitative DCE of the carotid arteries.
Purpose
Dynamic Contrast Enhanced (DCE) MRI enables quantitative assessment of microvasculature and endothelial permeability in the adventitial vaso vasorum1. The application of DCE in carotid vessel wall imaging faces demanding sampling challenges: 1) submillimeter spatial resolution is required for visualizing vessel wall without significant partial volume effects; 2) high temporal resolution is required to accurately capture the contrast kinetics; 3) adequate anatomical coverage is needed to cover the entire vasculature. Therefore, compromises often have to be made, for example, as poor slide resolution in conventional 2D acquisition2, or reduced temporal resolution in 3D acquisition3. Signal intensity in DCE does not scale linearly with contrast agent concentration, thus introducing errors in kinetic modeling such as saturated arterial input function (AIF). In this study, we attempted to mitigate these limitations to achieve high-resolution (0.7mm isotropic) 3D DCE imaging with dynamic T1 mapping.Methods
We designed a dynamic T1 mapping method based on the Low-Rank Tensor (LRT) framework4,5 to exploit the high correlation between images with different saturation recovery times and different contrast enhancement phases to allow vastly accelerated imaging.
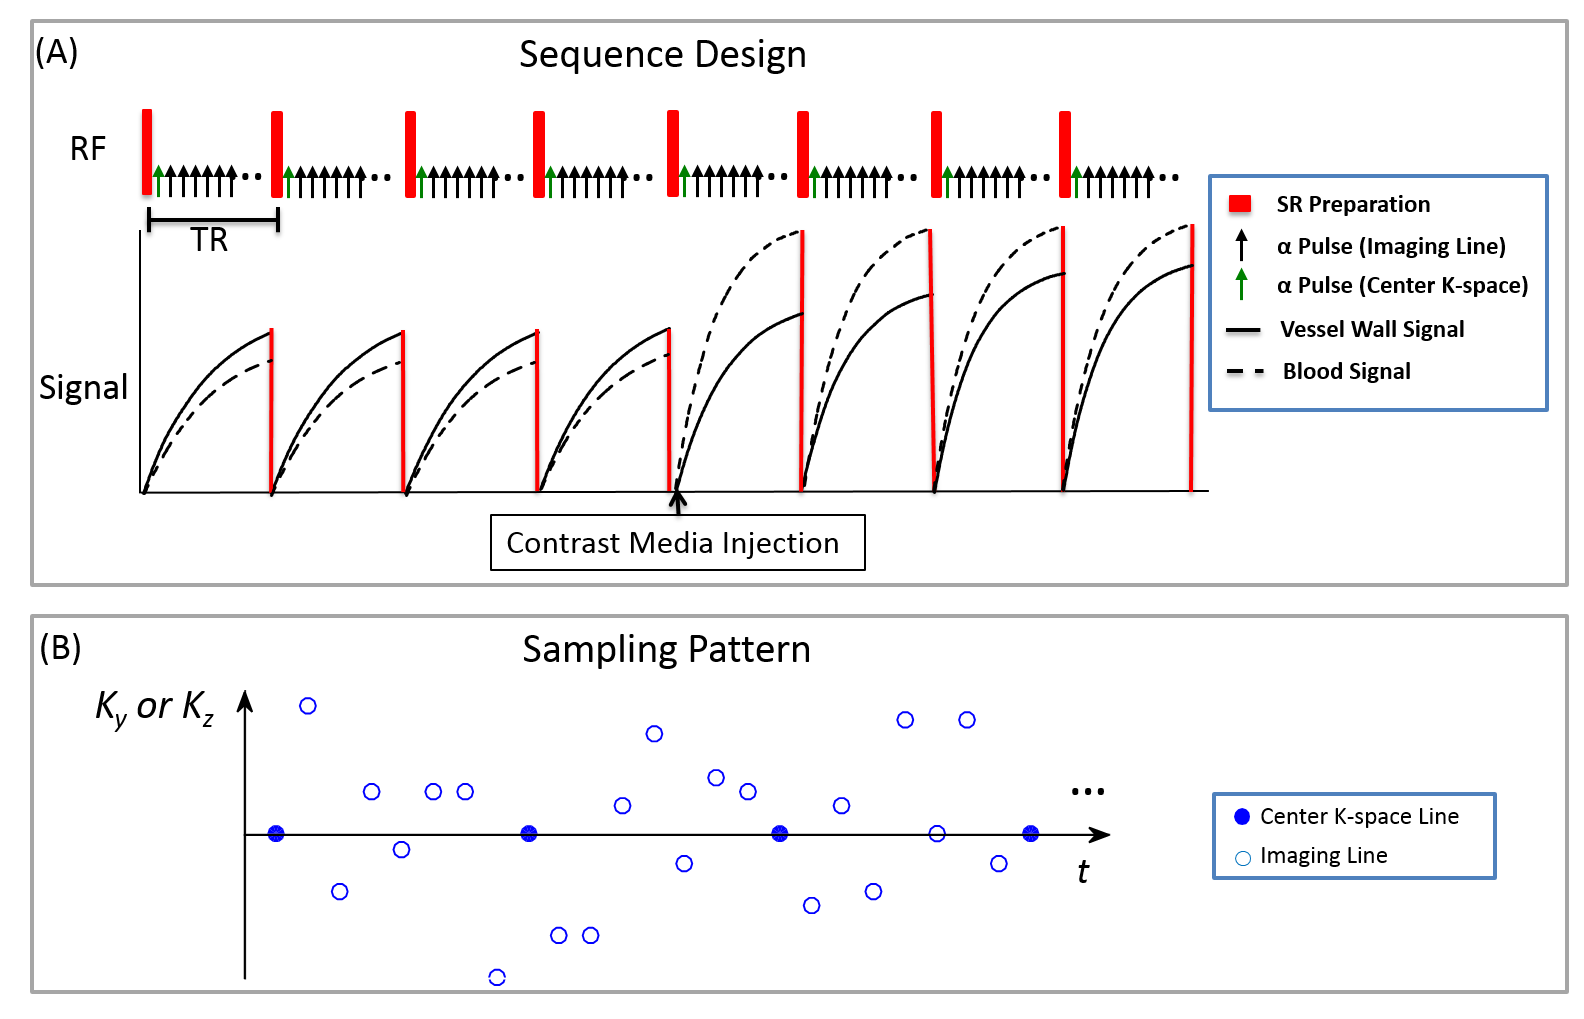
Sequence Design: A saturation recovery-prepared low angle shot readout (SR-FLASH) was employed (Figure 1). Cartesian acquisition with randomized reordering in ky and kz directions was implemented according to a variable-density Gaussian distribution. A k-space center line was collected every 8 lines as training data4 for the LRT subspace.
LRT Image Reconstruction: A 5-D image $$$I(x,y,z,T_{I},T_{E})$$$ is formed with three spatial dimensions, a saturation recovery time dimension $$$\tau$$$, and a DCE time dimension $$$t$$$. This image can be reshaped as a 3-way tensor $$$\mathscr{A}$$$ with dimensions indexing voxel location $$$\mathbf{r}=(x,y,z)$$$, $$$\tau$$$, and $$$t$$$. The resulting low-rank tensor can be factored as $$$\mathbf{A}_{(1)}=\mathbf{U\Phi}$$$, where $$$\mathbf{A}_{(1)}$$$ is the tensor collapsed into matrix form, $$$\mathbf{\Phi}$$$ contains tensor subspace basis functions describing T1 relaxation and contrast agent dynamics, and where $$$\mathbf{U}$$$ contains spatial coefficients. Image reconstruction follows a two-step process wherein we first determine $$$\mathbf{\Phi}$$$ from subspace training data4 and then recover $$$\mathbf{U}$$$ by fitting $$$\mathbf{\Phi}$$$ to the remainder of the sparsely sampled data: $$\hat{\mathbf{U}} = \arg\min_{\mathbf{U}}\|\mathbf{d}-\mathrm{E}(\mathbf{U\Phi})\|_2^2+\lambda\mathrm{TV}(\mathbf{U}), $$ where $$$\mathbf{d}$$$ is the measured data, $$$\mathrm{E}(\cdot)$$$ describes MRI encoding and sampling, $$$\mathrm{TV}(\cdot)$$$ is the total variation regularization functional, and is the regularization parameter.
Imaging Protocol: All data were acquired on a 3T Siemens Verio scanner. Accuracy of T1 mapping was tested in T1 phantoms6 and compared with a standard inversion-prepared spin echo method. Normal subjects without known carotid atherosclerosis (N=6) were scanned using the following parameters: coronal orientation, spatial resolution=0.7mm isotropic, FOV=150x150x26mm3, $$$\alpha = 8^\circ$$$, TR=600ms, scan time=12mins, DCE temporal footprint=2.08s. Gd contrast media was administered at the rate of 1.0ml/sec with 20ml saline flush (Gadovist, 0.1mmol/kg).
Motion Correction: An automatic algorithm was developed to exclude and interpolate the motion-corrupted data in the tensor based on spike detection in the principal temporal basis function of the LRT subspace.
Result
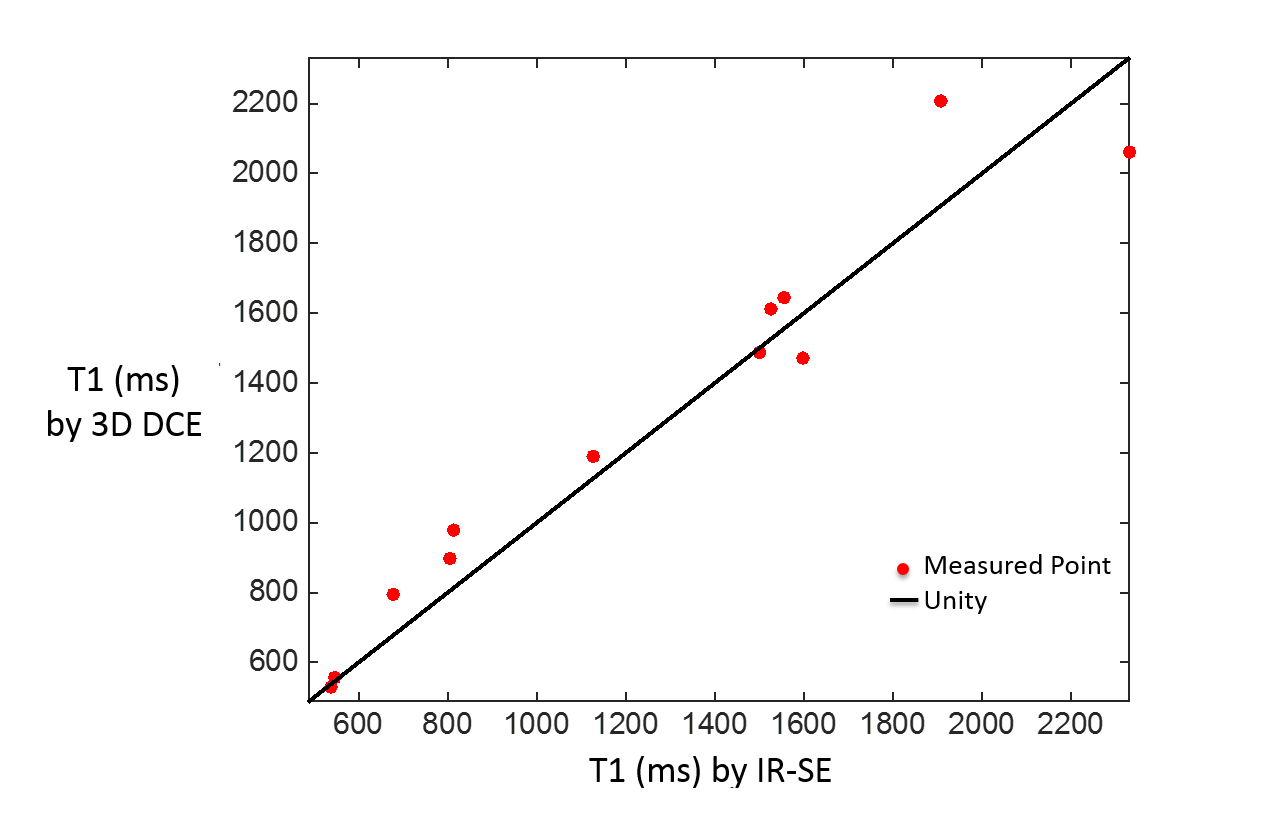
Figure 2 compares the T1 quantification between the proposed method and the reference in static phantoms showing high agreement (r=0.97, p<0.001).
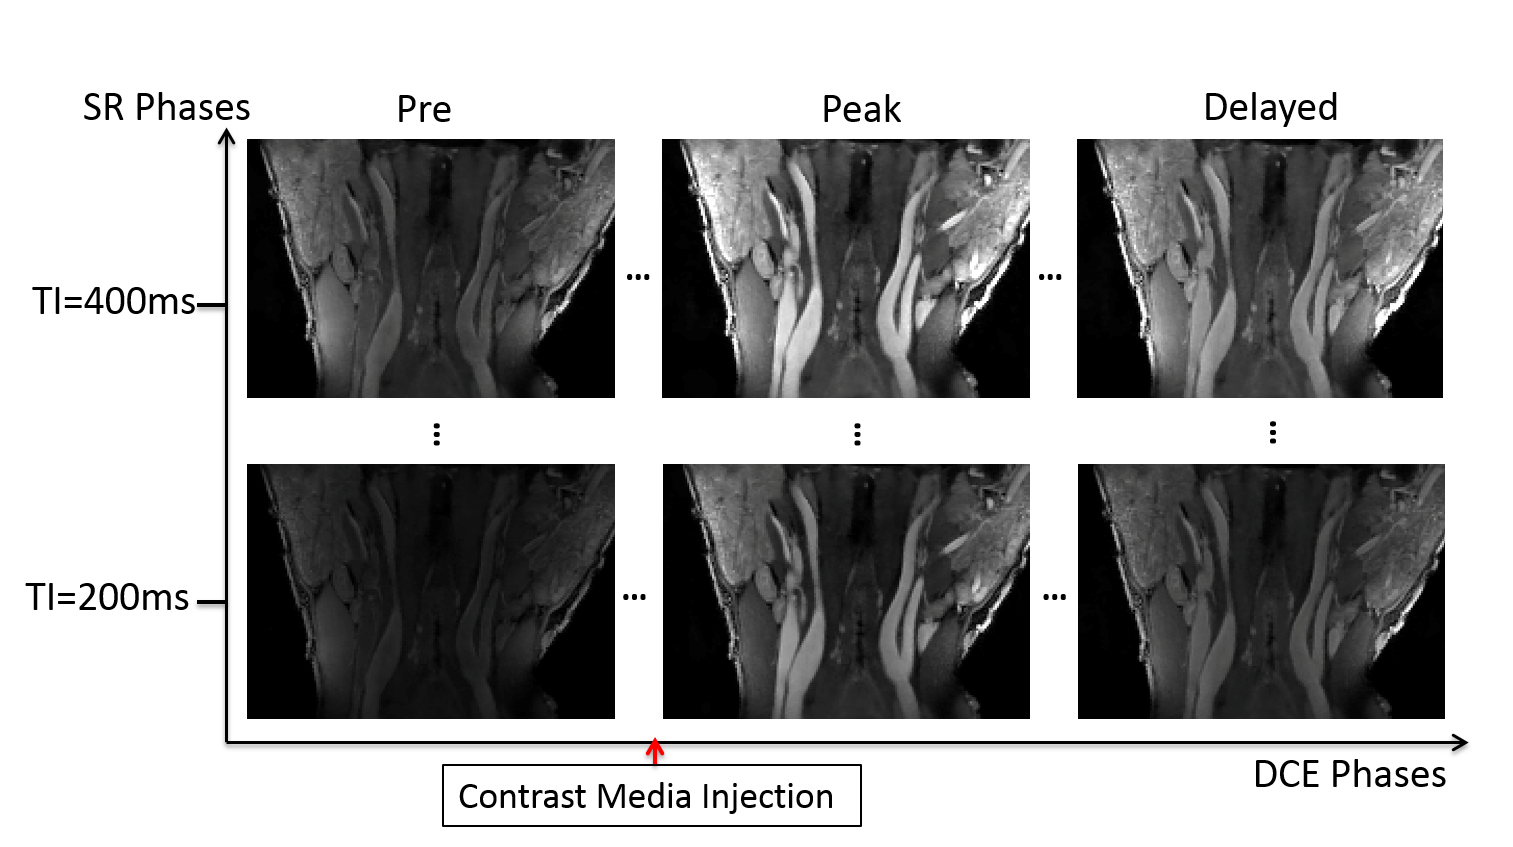
Figure 3 is a representative image set of multi-phase DCE images from a normal subject. Multiple SR phases allowed T1 quantification for direct estimation of contrast concentration. Three key DCE phases are shown along horizontal axis as examples.
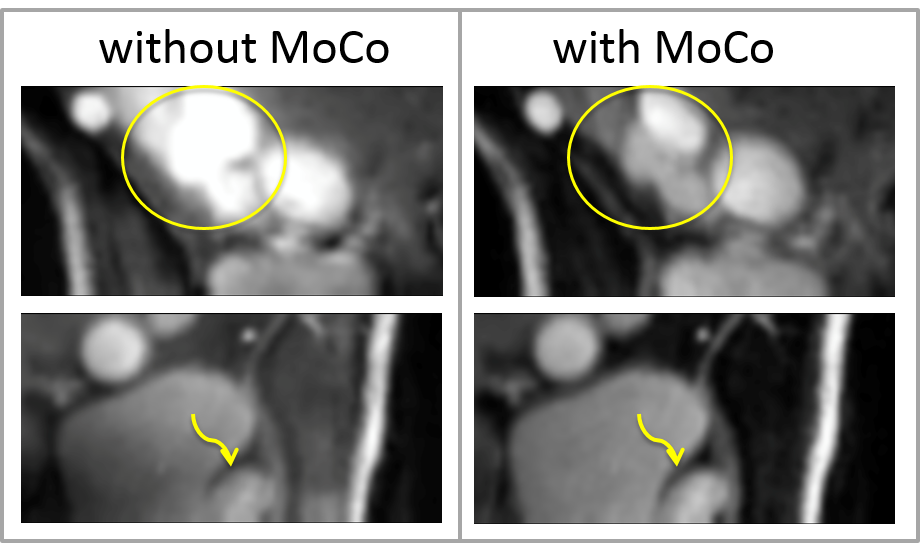
Figure 4 demonstrates the effects of motion correction. Images after motion correction showed sharper delineation and less artifacts.
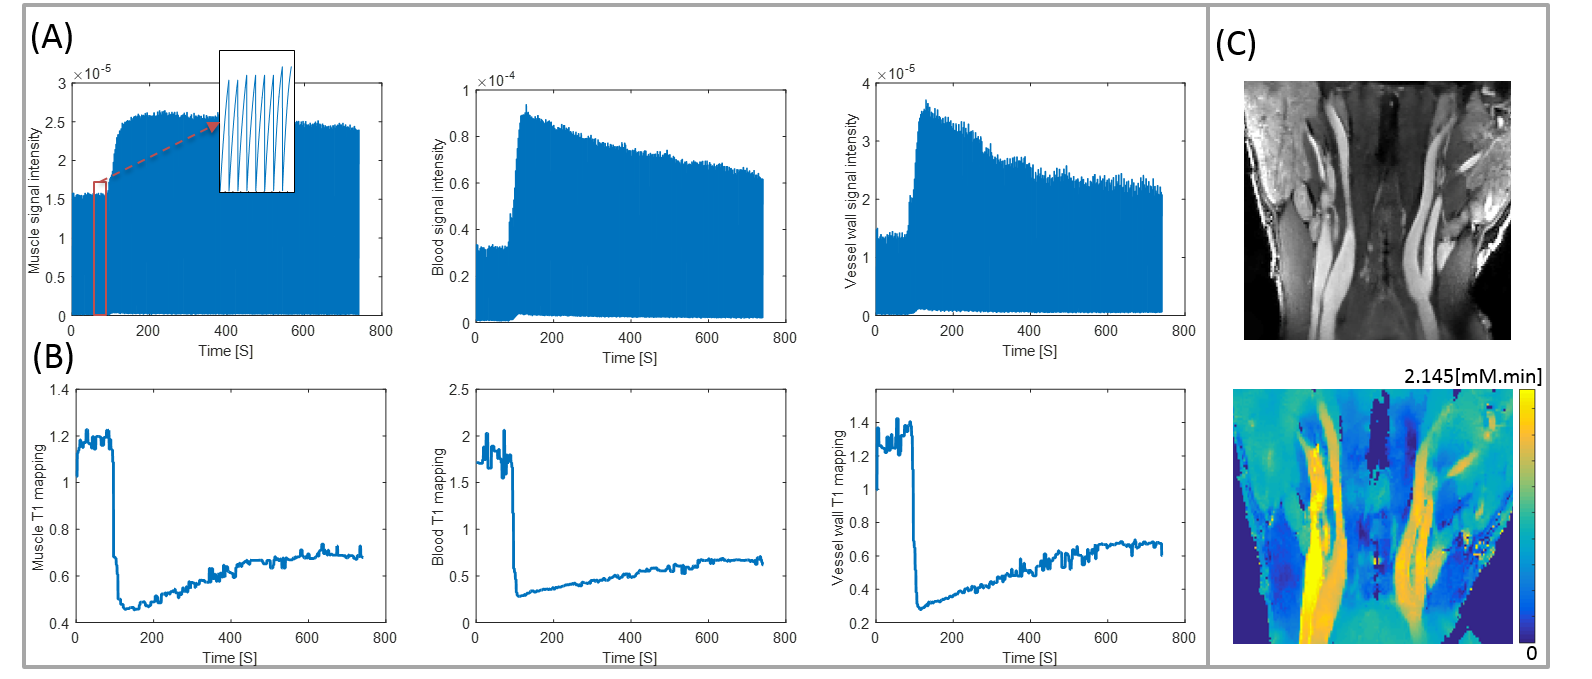
Figure 5 shows the real-time signal evolution, dynamic T1 mapping, and AUC mapping. Vessel wall vp and Ktrans was 0.276 and 0.121 ±0.02 min-1, respectively.
Discussion
Kinetic modeling was feasible based on the in vivo DCE data. Motion correction alleviated the bulk motion issues which were frequent during DCE scans. The vessel wall in normal subjects is thin which added difficulty in accurate segmentation. For in vivo study, automated image processing is needed to quantify the multi-phase images.Conclusion
We have demonstrated the feasibility of high resolution (0.7mm) 3D DCE imaging of carotid arteries based on dynamic T1 mapping. Studies on phantom and human subjects showed excellent image quality, accurate T1 quantification, and robustness to motion. Patient study is warranted to investigate the potential benefits of the proposed technique.Acknowledgements
No acknowledgement found.References
1 Kerwin, W. et al. Quantitative magnetic resonance imaging analysis of neovasculature volume in carotid atherosclerotic plaque. Circulation 107, 851-856 (2003).
2 Dong, L. et al. Carotid artery atherosclerosis: effect of intensive lipid therapy on the vasa vasorum--evaluation by using dynamic contrast-enhanced MR imaging. Radiology 260, 224-231, doi:10.1148/radiol.11101264 (2011).
3 Calcagno, C. et al. Three-dimensional dynamic contrast-enhanced MRI for the accurate, extensive quantification of microvascular permeability in atherosclerotic plaques. NMR Biomed 28, 1304-1314, doi:10.1002/nbm.3369 (2015).
4 He, J. et al. Accelerated High-Dimensional MR Imaging With Sparse Sampling Using Low-Rank Tensors. IEEE transactions on medical imaging 35, 2119-2129, doi:10.1109/TMI.2016.2550204 (2016).
5 Christodoulou, A. G. et al. Fast dynamic electron paramagnetic resonance (EPR) oxygen imaging using low-rank tensors. Journal of magnetic resonance 270, 176-182, doi:10.1016/j.jmr.2016.07.006 (2016).
6 Stanisz, G. J. et al. T1, T2 relaxation and magnetization transfer in tissue at 3T. Magnetic resonance in medicine : official journal of the Society of Magnetic Resonance in Medicine / Society of Magnetic Resonance in Medicine 54, 507-512, doi:10.1002/mrm.20605 (2005).
Figures