2788
Three-dimensional T1-Weighted Black-Blood Turbo Spin-Echo with Navigator Respiratory Gating for the Vessel Wall Imaging: A Novel Approach to Evaluate Plaque in the Aortic ArchKenichi Nakagawa1, Noriyoshi Morimoto1, Sachi Fukushima1, and Takashi Tabuchi2
1Department of Radiological Technology, Kurashiki Central Hospital, Okayama, Japan, 2Department of Medical Technology, Kurashiki Central Hospital, Okayama, Japan
Synopsis
Complex plaques in the aortic arch on transthoracic echocardiography (TEE) can cause brain embolism. However, TEE, which is associated with a number of complications and contraindications, is not suitable for all patients. Therefore, we focused on contrast evaluation of MRI with 3D T1w black-blood TSE as an adjunct to diagnosis of complex plaques. The aim of this study is to clarify the optimal scan method for 3D T1w black-blood TSE. Our results suggest that 3D T1w black-blood TSE in the aortic arch can reduce the amount of artifact by using the optimal trigger timing by ECG-gating and navigator respiratory gating.
INTRODUCTION
When classifying atherosclerotic plaques, irregular surface plaques, ulcerated plaques, and mobile plaques are classified as complex plaques. Complex plaques in the aortic arch on transthoracic echocardiography (TEE) can cause aortogenic brain embolism [1]. However, TEE, which is associated with a number of complications and contraindications, is not suitable for all patients [2]. Therefore, we focused on contrast evaluation of magnetic resonance imaging [3] as an adjunct to diagnosis of complex plaques in the aortic arch, which was difficult to scan in the aortic arch because of several artifacts. As a solution to these problems, we devised the scan methodology of three-dimensional T1-weighted black- blood turbo spin-echo (3D T1wBB-TSE) in the aortic arch. The aim of this study is to clarify the optimal scan method for 3D T1wBB-TSE.MATERIALS and METHODS
Five healthy volunteers (mean age 33.8 years, range 25.0 to 57.0) participated in this study. We obtained Institutional Review Board approval and informed consent from all subjects. All experiments were acquired by volume isotropic TSE acquisition (VISTA) with anti-DRIVE using a 1.5T unit (Ingenia, Philips Healthcare, Best, The Netherlands). Imaging parameters were: TR, 1beat; TE, 24ms; FOV, 260*260*70mm; acquisition matrix, 1.1*1.1*4mm; reconstruction matrix,0.55*0.55*2mm; refocusing flip angle, 30°; TSE factor, 25; start up echo, 4, and Fat saturation pulse used SPAIR. The study protocol was divided into two parts: 1) To evaluate the combination of six patterns for phase direction, with and without ECG-gating and navigator respiratory gating, respectively, and 2) To compare the timing of ECG-gating on systole and diastole to determine the optimal trigger timing. There were evaluated by visual assessment.RESULTS and DISCUSSION
Figure 1 shows the images of six patterns and Figure 2 shows the systolic and diastolic images. The combination of phase direction AP or FH, with ECG-gating, and using navigator respiratory gating were best scan methods. The ECG-gating and navigator respiratory gating can reduce motion artifacts but result in extended scan duration. Also, there were cases in which phase direction AP may be better able to reduce motion artifacts by using pre-saturation pulse for thorax suppression. When we compared the timing of ECG-gating systole with diastole, diastole was better because movement of the vessel wall was less on diastole. However, for the patients with reduced blood flow, black blood effect can result in weakness. Therefore, it was necessary to divide patients according to the optimal trigger timing by ECG-gating at systole and diastole. Figure 3 shows the clinical images. We were able to obtain a clear image of the vessel walls by using the optimal trigger timing in 3D T1wBB-TSE.CONCLUSION
Our results suggest that 3D T1wBB-TSE in the aortic arch can reduce the amount of artifact by using the optimal trigger timing by ECG-gating and navigator respiratory gating.Acknowledgements
No acknowledgement found.References
1] Shimada Y, Cerebrovasc Dis 35:282-290; 2013. 2] Daniel WG, Circulation 83:817-821; 1991. 3] Yoshida K, AJNR Am J Neuroradiol 29(5):868-874; 2008.Figures
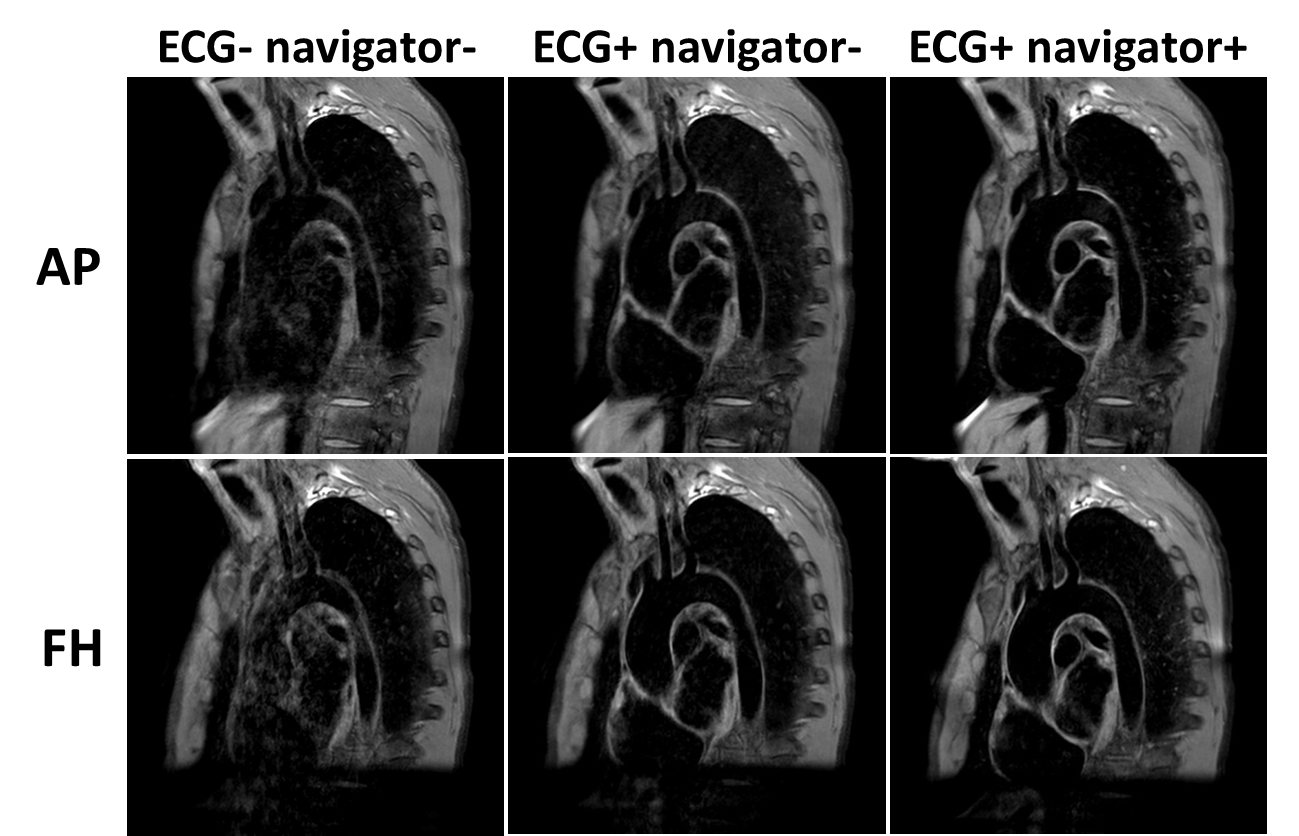
Fig.1. Phase direction AP (top row) and FH (bottom
row).Comparison of 3D T1wBB-TSE images obtained from the ECG- navigator-, ECG+
navigator-, and ECG+ navigator+ scans, respectively.
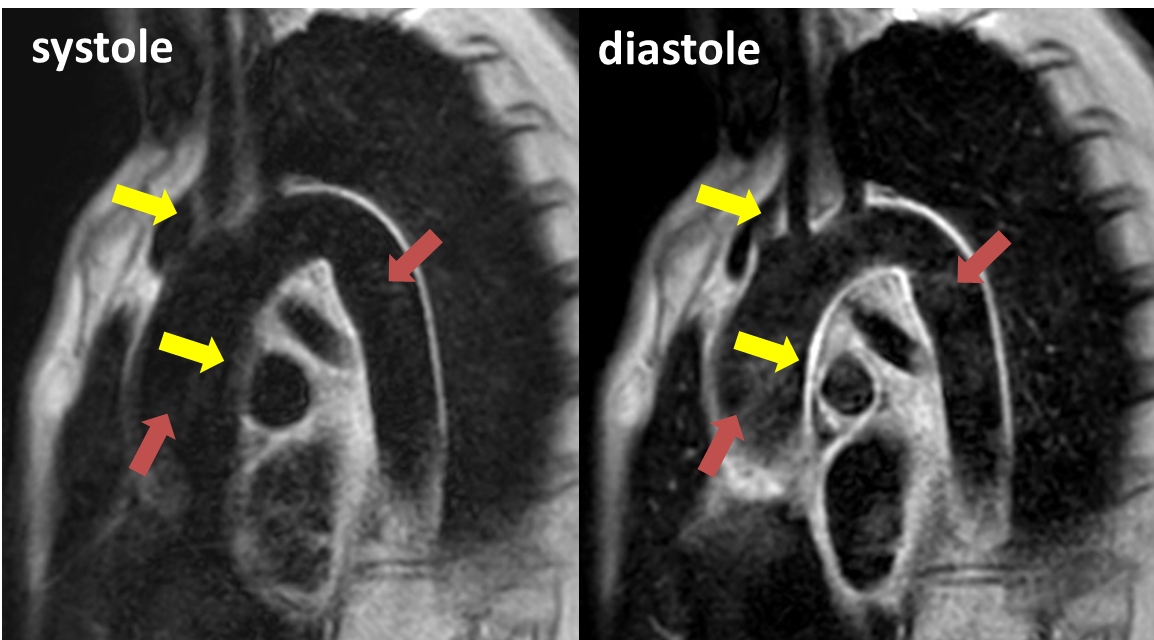
Fig.2. Comparison of the systolic and the diastolic
images. The yellow arrow shows movement of the vessel wall, and the red arrow
shows the black blood effect.
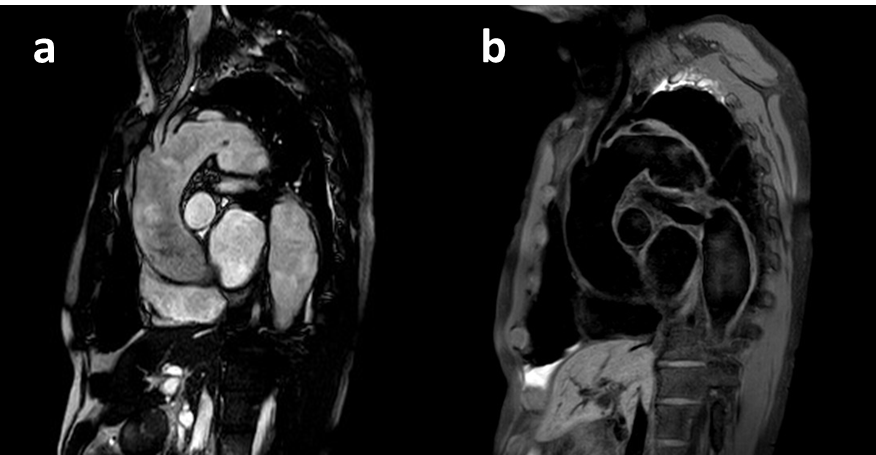
Fig.3. Clinical images of a man in his 60s with thoracic aortic aneurysm (TAA). Bright-blood image (a) using balanced TFE, and black-blood image (b)
using 3D T1wBB-TSE.