2786
Comparison of black-blood T2 mapping sequences in carotid artery at 3T1Department of Radiology, University of Cambridge, Cambridge, United Kingdom, 2Department of Radiology, Cambridge University Hospitals NHS Foundation Trust, Cambridge, United Kingdom, 3GE Healthcare, Amersham, United Kingdom
Synopsis
Carotid black-blood quantitative T2 mapping sequences have the potential to help plaque component segmentation and are more suitable for multi-centre studies across different MRI systems. The purpose of this study is to compare the accuracy of three different black-blood quantitative T2 sequences in the phantom and healthy volunteers at 3T.
Purpose
Black-blood quantitative T2 mapping sequences have been used in carotid imaging to measure the relaxation time of carotid artery plaque1,2. Quantitative T2 values were reported to be statistically different among major plaque components3. While there are several sequences available for blood suppressed quantitative T2 measurement1,2, no study has systematically compared the accuracy and T2 map quality of the different sequences. The purpose of this study is to compare three different black-blood quantitative T2 sequences in phantom and a cohort of healthy volunteers.Methods
Sequences: Three different black-blood T2 mapping sequences were developed, comprising 1) a double inversion recovery (DIR) prepared 2D multi-echo fast spin echo sequence (MEFSE) with ECG gating; 2) an improved motion sensitive driven equilibrium (iMSDE)4 prepared 3D fast spin echo (FSE) with variable flip angle; and 3) an iMSDE prepared 3D fast spoiled gradient echo (FSPGR). In the 3D FSE/FSPGR sequences, three different echo times were achieved by varying the RF and gradient pulse intervals in the iMSDE preparation, while keeping the readout the same for each echo. To achieve adequate blood suppression, the first moment of the iMSDE preparation for the first echo in 3D FSE and FSPGR were 412 and 6666.7 mTms2/m, respectively. The 2D MEFSE and 3D FSE sequences acquired the echoes in an interleaved scheme, whilst the 3D FSPGR acquired the echoes sequentially. Other scanning parameters were listed in Table 1. All the scans were performed using a 3 T system (MR750, GE Healthcare, Waukesha, WI), with a 4-channel phased-array neck coil (PACC, MachNet, Roden, The Netherlands).
T2 fitting: The noise of the images was corrected by using Miller’s algorithm5, followed by the pixel based T2 fitting of the power images over the echoes5: $$$I_{c}(TE)^{2}=I_{0}^{2}e^{-2TE/T_{2}}$$$. In the DIR 2D MEFSE sequence, the first TE was discarded due to the imperfection of the 180° refocusing pulses. In the 3D FSPGR sequence, the sequentially acquired echoes were first co-registered to the first echo before performing the fitting, using an intensity-based registration algorithm developed in-house in Matlab (MathWorks, Natick, MA, USA).
Phantom: The three sequences were tested using a Eurospin Test Object phantom with known T2 values. The 2D MEFSE sequence without DIR preparation was used as the reference. Mean, standard deviations (SD), the concordance correlation coefficient (CCC) and Bland-Altman statistics of T2 measurements were compared to the reference sequence.
Volunteers: Ten healthy volunteers (seven men, mean age 33.2, range: 23-44 years) were recruited in this study. The volunteer experiments were conducted under a research ethics agreement and all volunteers gave informed written consent. For the 2D sequence, a single slice 3mm below the bifurcation of the carotid artery was chosen. For the 3D sequences, an axial slab was centred on the bifurcation. Contours of the carotid vessel wall and lumen were manually drawn by an experienced reviewer using a DICOM viewer (OsiriX 5.5.2, Pixmeo, Geneva, Switzerland). Mean and SD of T2 values, signal-noise-ratio (SNR), SNRefficiency (defined as $$$SNR/\sqrt{Time}$$$) and the coefficient of variance (CoV) of the carotid vessel wall were compared. A student’s t-test was used to compare the T2 values. The statistical analysis was performed using R (version 3.2.2).
Results
An example of images and T2 maps from sequences was shown in figure 1. The result of Bland-Altman analysis for the phantom study was shown in Table 2. When comparing to the reference, the CCCs with 95% CI for DIR 2DMEFSE, iMSDE 3D FSE and FSPGR were all high: 0.98 (0.64-1.00), 0.99 (0.96-1.00) and 0.95 (0.67-0.99), respectively. All the volunteers completed the MRI scans. In total 20 carotid arteries were analysed. The mean T2, SNR, SNRefficiency, and CoV of the vessel walls were summarised in Table 3. The DIR 2D MEFSE yields significantly higher T2 values than the other two sequences (p<0.05). The 3D FSPGR sequence had higher T2 values than 3D FSE, however, this difference is not significant (p>0.05). The highest SNR was found in the 3D FSE sequence, while the 2D DIR MEFSE has the lowest SNR for the first echo analysed. The SNRefficiency for the three sequences is comparable.Discussion and conclusion
This study compares three different black-blood T2 mapping sequences in phantom and healthy volunteers at 3T. The results show that although accurate T2 quantification could be obtained using the phantom, the in vivo T2 measurements varies among the sequences. Factors such as field inhomogeneity and blood suppression pulses could influence the accuracy of T2 measurement. This indicates that the choice of sequence and careful analysis of impacting factors in the fitting process are important for accurate T2 measurement in the carotid vessel wall.Acknowledgements
We acknowledge funding from NIHR BRC and Addenbrooke's Charitable Trust.References
1. Biasiolli L, Lindsay AC, Chai JT, Choudhury RP, Robson MD. In-vivo quantitative T2 mapping of carotid arteries in atherosclerotic patients: segmentation and T2 measurement of plaque components. Journal of Cardiovascular Magnetic Resonance. 2013 Aug 16;15(1):1.
2. Coolen BF, Poot DH, Liem MI, Smits LP, Gao S, Kotek G, Klein S, Nederveen AJ. Three-dimensional quantitative T1 and T2 mapping of the carotid artery: Sequence design and in vivo feasibility. Magnetic resonance in medicine. 2015 Apr 1.
3. Degnan AJ, Young VE, Tang TY, Gill AB, Graves MJ, Gillard JH, Patterson AJ. Ex vivo study of carotid endarterectomy specimens: quantitative relaxation times within atherosclerotic plaque tissues. Magnetic resonance imaging. 2012 Sep 30;30(7):1017-21.
4. Wang J, Yarnykh VL, Yuan C. Enhanced image quality in black-blood MRI using the improved motion-sensitized driven-equilibrium (iMSDE) sequence. Journal of Magnetic Resonance Imaging. 2010 May 1;31(5):1256-63.
5. Miller AJ, Joseph PM. The use of power images to perform quantitative analysis on low SNR MR images. Magnetic resonance imaging. 1993 Dec 31;11(7):1051-6.
Figures
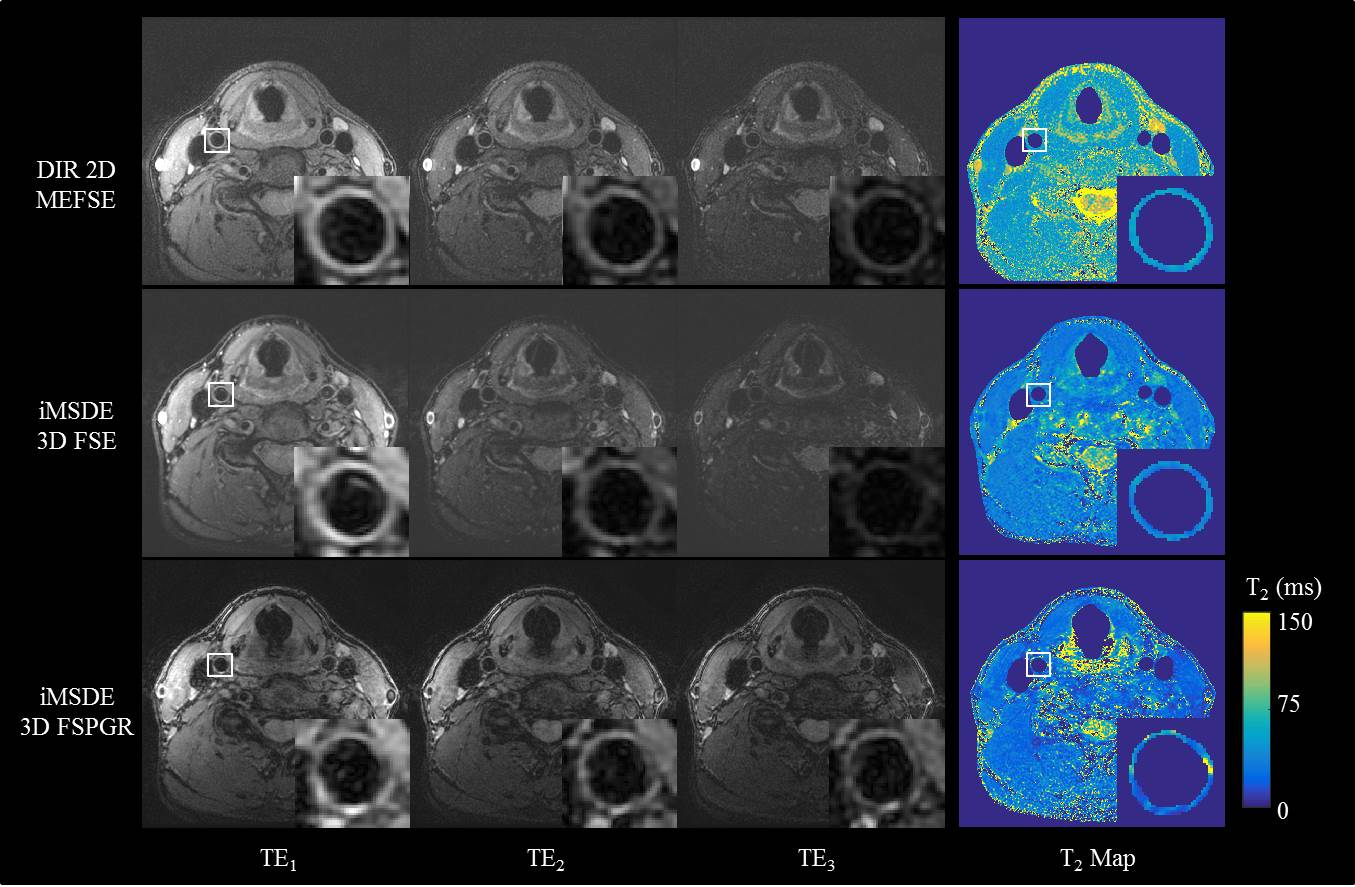

Table 1.Scanning parameters of the sequences.
FSE: fast-spin-echo; MEFSE: multi-echo FSE; FSPGR: fast spoiled gradient echo; DIR: Double Inversion-recovery; iMSDE: improved motion sensitive driven equilibrium; ETL: echo train length; VPS: views per segment;

Table 2. Bland-Altman analysis of the three sequence compared to the reference sequence.
FSE: fast-spin-echo; MEFSE: multi-echo FSE; FSPGR: fast spoiled gradient echo; DIR: Double Inversion-recovery; iMSDE: improved motion sensitive driven equilibrium;

Table 3. Mean and SD of T2 measurement, SNR and SNRefficiency and CoV derived from three sequences in the volunteer scans.
FSE: fast-spin-echo; MEFSE: multi-echo FSE; FSPGR: fast spoiled gradient echo; DIR: Double Inversion-recovery; iMSDE: improved motion sensitive driven equilibrium;