2782
Assessment of Local Pulse-Wave-Velocity Distribution in Mice using k-t BLAST MRI with Semi-Automatic Area Segmentation1Department of Physics, University of Würzburg, Würzburg, Germany, 2Department of Diagnostic and Interventional Radiology, University Hospital Würzburg, Würzburg, Germany, 3Department of Internal Medicine I, Division of Cardiology, University Hospital Würzburg, Würzburg, Germany
Synopsis
Arterial stiffness (AS) assessed by pulse wave velocity (PWV) has been shown to represent a valuable biomarker of cardiovascular disease risk. Local elastic properties of the murine aortic vessels such as the pulse-wave-velocity (PWV) can be examined using PC-MRI [1]. In the present study we provide an accelerated method based on a k-t BLAST undersampling scheme combined with a new semi-automatic segmentation algorithm to quantify the distribution of the local PWV along the aortic vessel.
Introduction:
Arterial stiffness (AS) assessed by pulse wave velocity (PWV) has been shown to represent a valuable biomarker of cardiovascular disease risk. PWV can be examined using PC-MRI by simultaneously measuring the blood volume flow Q(t) and the cross-sectional area A(t). However, the PWV calculation is often very sensitive to inaccuracies when manually segmenting the cross-sectional area of the vessel. In the present study we provide an accelerated method based on a k-t BLAST undersampling scheme combined with a new semi-automatic segmentation algorithm to quantify the distribution of the local aortic PWV along the aortic vessel.Methods:
kt-BLAST PC-MRI
The local pulse wave velocity (PWV) was estimated using the QA-method (i.e. PWV=dQ/dA for early systolic time points) [1]. For data acquisition we implemented an interleaved k-t BLAST acquisition scheme as exemplarily shown in Fig. 1.a. The measurement sequence consisted of a fully motion compensated FLASH-sequence supplemented with two through-plane velocity encoded sequences as shown in Fig. 1.b. All in vivo measurements were performed on a Bruker Avance 750 spectrometer (17.6T) with a maximum gradient strength of 1.0T/m and a 27mm homebuilt TEM resonator.The proposed methods were applied in two animal groups both at the age of 8 months (ApoE(-/-) and C57BL/6J-mice (n=4,n=6 respectively). Animals were anesthetized using isoflurane (1.5-2 Vol. %) and 02 (2L/min)). Cardiac triggering and respiratory gating was applied for all MR measurements with a pressure-sensitive ballon. Imaging parameters were: r=6, TE 2.1 ms, FOV 25×25 mm2, slice-thickness 1.0 mm, resolution 98×98 μm2, total measurement time per slice approx. 1 min..
Semiautomatic Segmentation
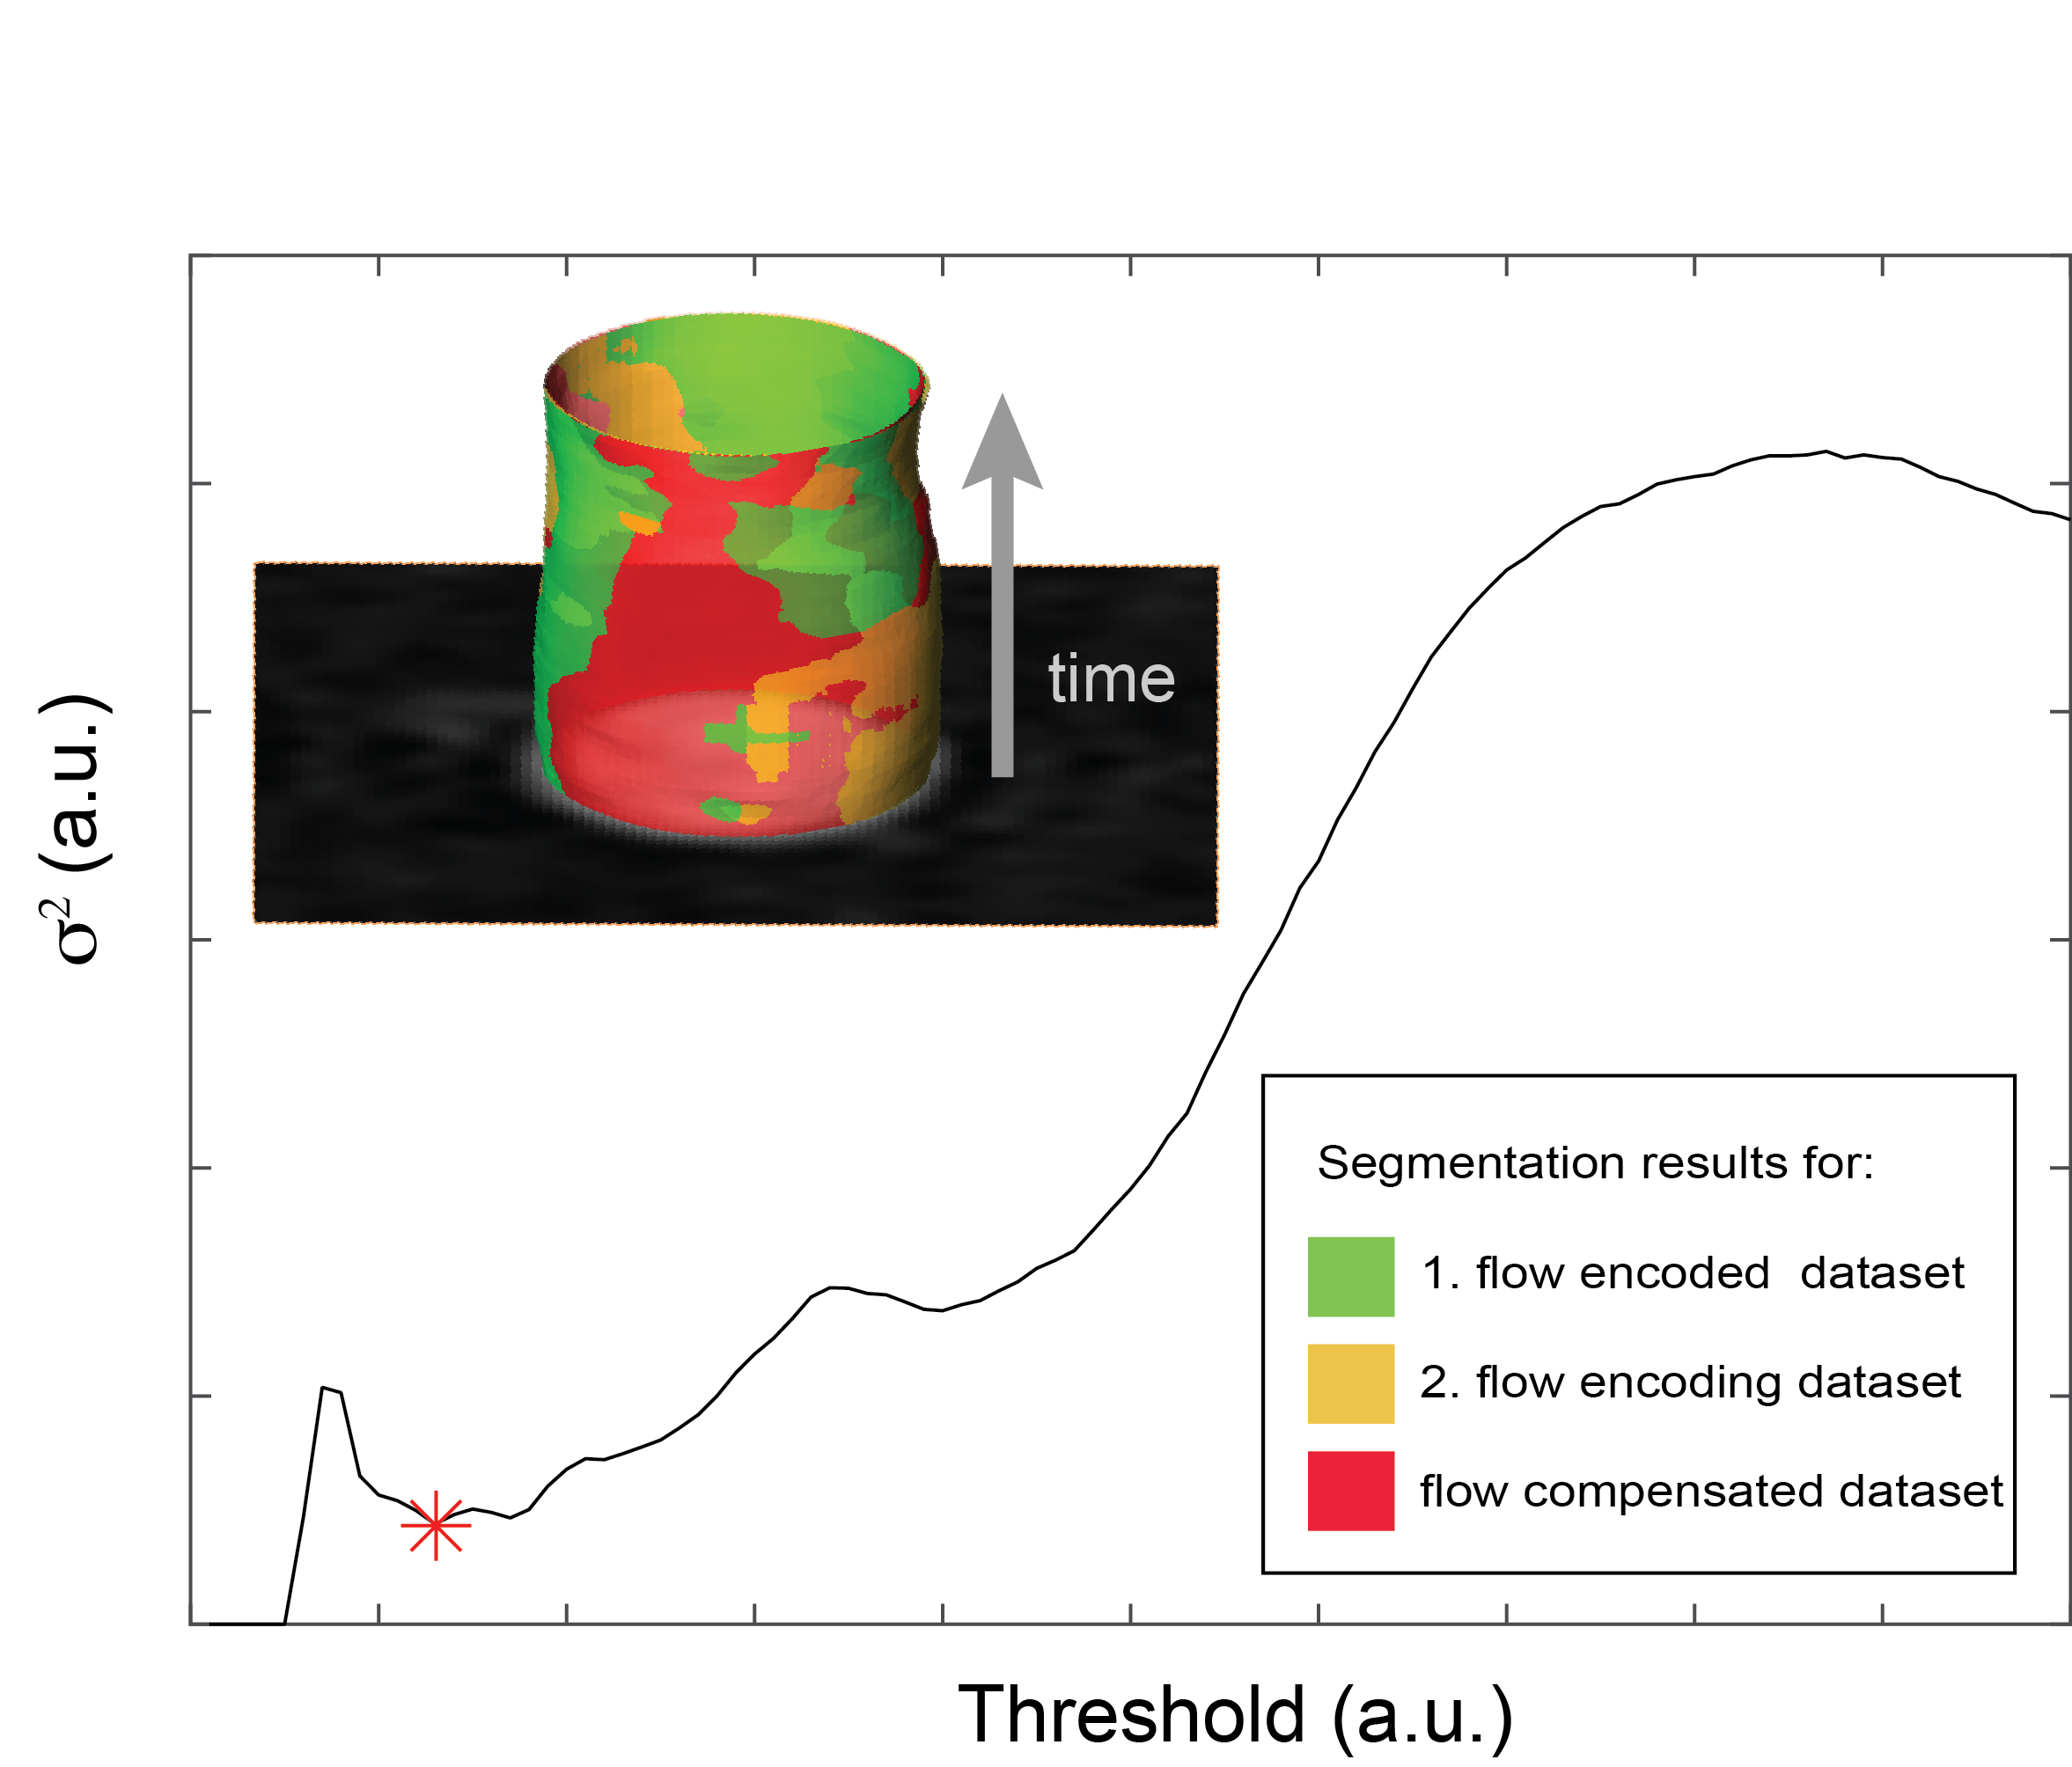
Semiautomatic segmentation was realized with a classification method incorporating prior knowledge about the measurement process. The basic principle was to involve magnitude data from all three motion encoding data sets into the segmentation process. The segmentation was based on the assumption that the magnitude images of each of the three motion encoded data sets should lead to the same segmentation result. The segmentation process can then be formulated as an optimization problem:
$$\underset{{\tau}}{\arg\min} \{ \operatorname{E}[( {\mathcal{P}}(\tau) - \operatorname{E}[ {\mathcal{P}} (\tau)]) ^2] \}$$
where $$${\mathcal{P}}(t)=(\mathcal{P}_1(\tau) , \mathcal{P}_2(\tau) , \mathcal{P}_3(\tau) )$$$ gives the number of identified pixels in the binary masks for each flow encoding step when applying a certain threshold $$$\tau$$$. The cost function represents the variance $$$\sigma^2$$$ of the threshold segmentation result for the different flow encoding steps. The threshold value belonging to a minimum deviation between the flow encoding steps was found by evaluating the cost function for a given range of threshold values and numerically finding the minimum. Fig. 2 shows the course of $$$\sigma^2$$$ as a function of threshold $$$\tau$$$ and the representative segmentation results for the different flow encoding steps.
Results:
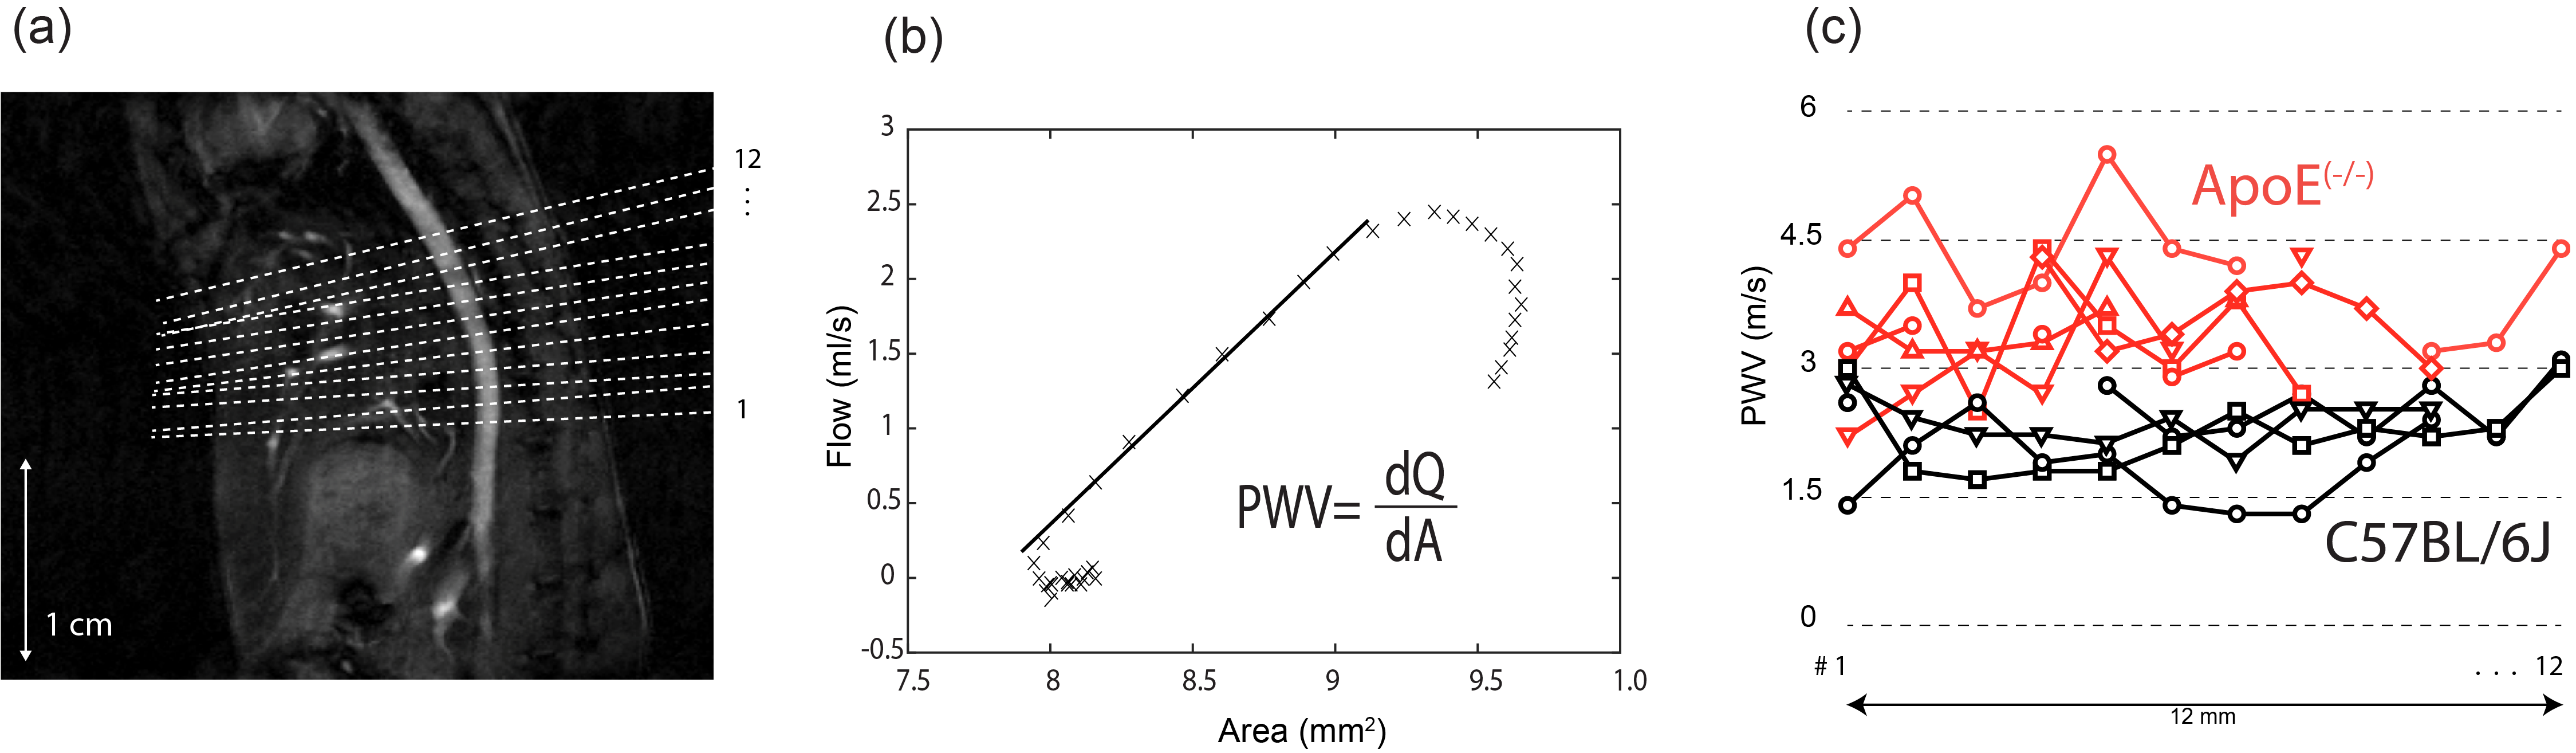
PWV was measured at 12 contiguous locations along the abdominal aorta as shown in Fig. 3.a. For each location blood flow and cross sectional area changes were measured and successively the PWV was calculated as depicted in Fig. 3.b. An overview of the distribution of the single PWV-measurements can be found in Fig. 3.c. If evaluating mean values for each animal group, the results yield a significant elevated PWV for the ApoE(−/−)-mice. Mean PWV for the ApoE(−/−)-group was measured to be (3.5 ± 0.7 ) m/s (Mean ± standard deviation), whereas wild-type mean PWV was (2.2 ± 0.4 ) m/s. When considering the individual distributions of the local PWV, no formative patterns for the local elasticity could be identified in neither animal group. PWV-values in the ApoE(−/−)-group however are subject to a significant stronger form of individual fluctuations along the flow path way.Conclusion:
In this paper we presented a fast MRI method to quantify local PWV in the murine aorta based on highly undersampled PC-MRI in combination with a semiautomatic segmentation algorithm. The findings of this study demonstrate the ability of high field MRI to non-invasively quantify and distinguish the distribution of local PWV in the aorta of wild-type and ApoE(−/−)-mice, respectivelyAcknowledgements
This work was supported by grants from the Deutsche Forschungsgemeinschaft (SFB 688), the Bundesministerium für Bildung und Forschung (BMBF01 EO1004) and the Comprehensive Heart Failure Center (CHFC).References
[1] Herold et al., Magn Reson Med, [2009]; 61:1293–1299.
[2] Tsao et. al, Magn Reson Med., [2003]; 50:1031–1042.
Figures
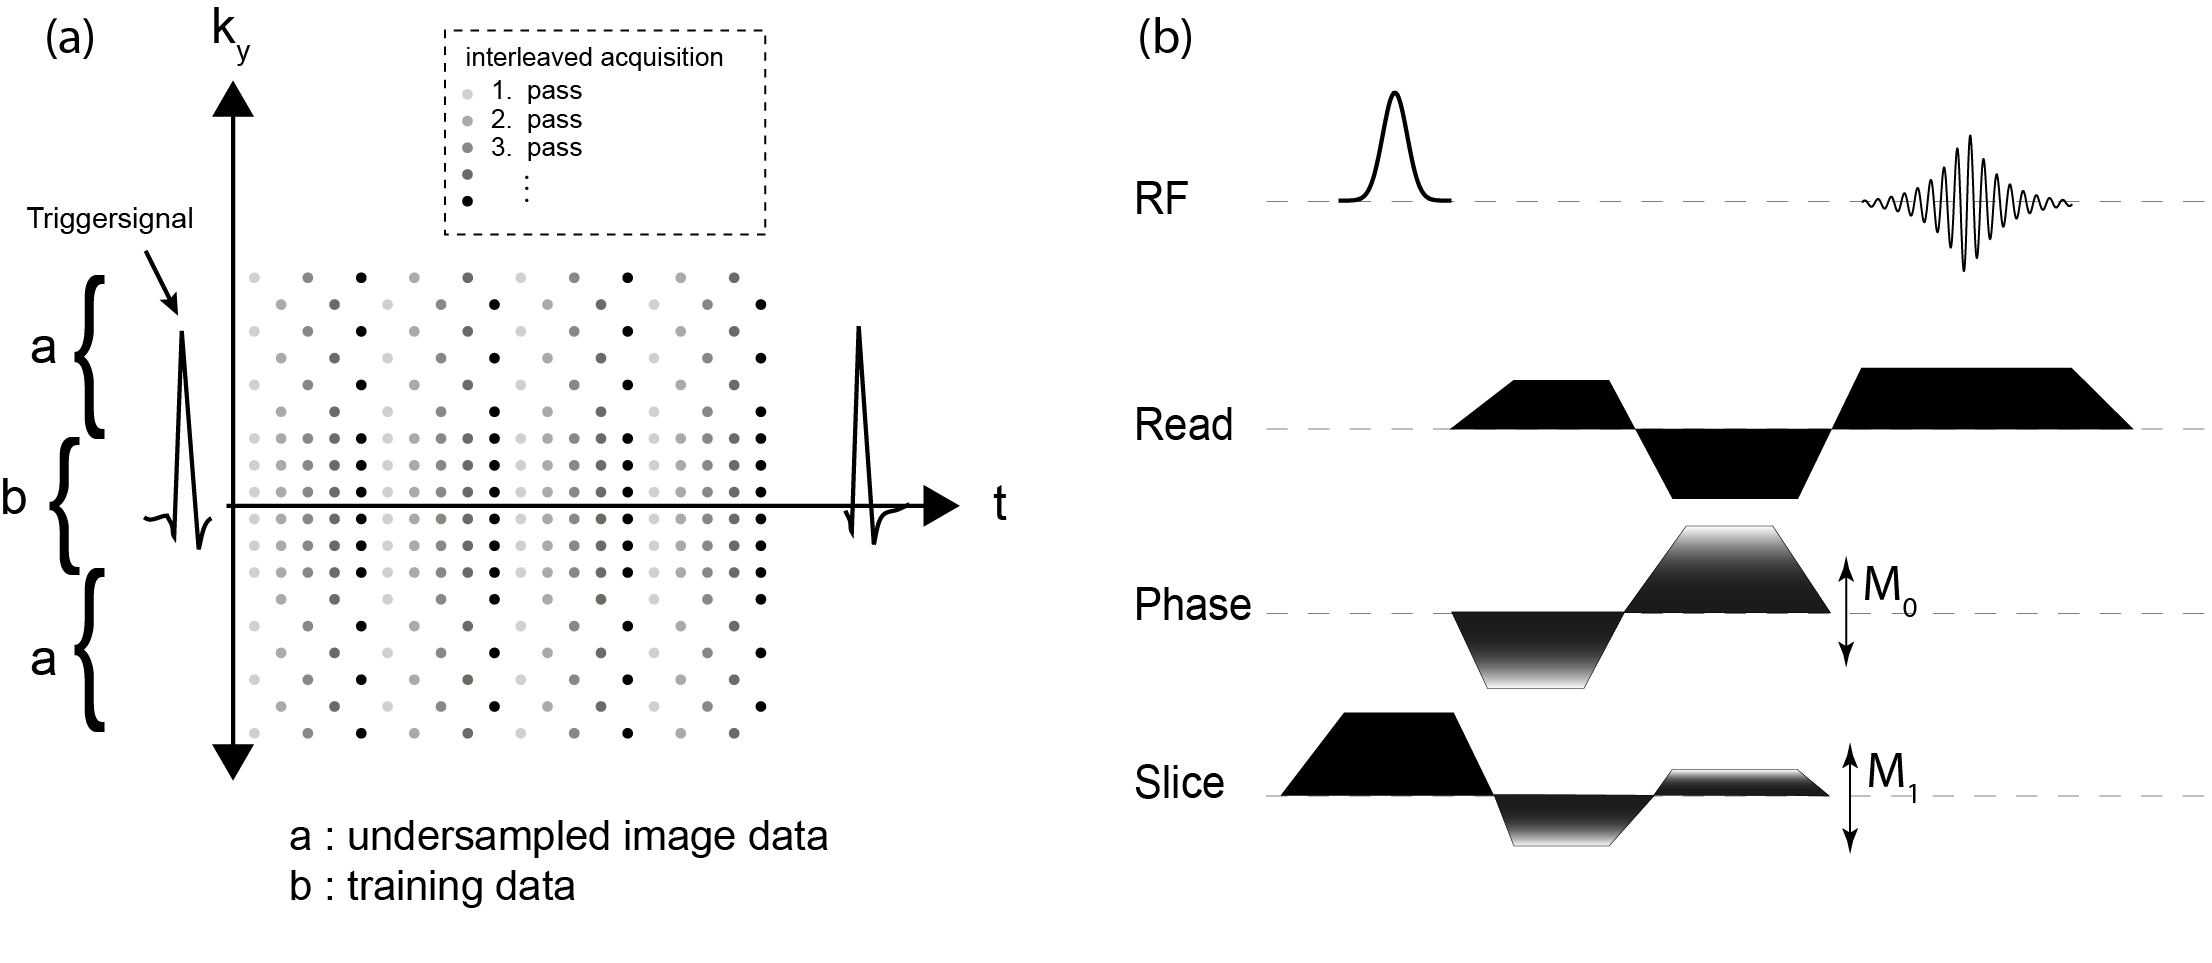
a): Undersampling scheme for the k-t BLAST data acquisition (shown for R=2). The different shadings of the data points represent the different repetitions of the sequence. Altogether five repetitions, each one shifted by a temporal delay of 1 ms were, performed.
b): 2D-Phase-Contrast-CINE-FLASH sequence with through-plane flow encoding. Flow-compensation was applied for all three-gradient directions.