2781
Optimization of whole-brain intracranial arterial wall imaging sequence using Bloch equation simulation1Paul C. Lauterbur Center for Biomedical Imaging, Shenzhen Institutes of Advanced Technology, Chinese Academy of Sciences, Shenzhen, People's Republic of China, 2Neurology, Shenzhen Second People’s Hospital, Shenzhen, People's Republic of China
Synopsis
T1 weighted SPACE has gain popularity in intracranial wall imaging, but its long scan time makes it impractical and its multiple parameters make it very difficult to be optimized. In this study, we looked into the effect of various imaging parameters of T1w SPACE on the signal-to-noise (SNR) and contrast ratio (CR) between vessel wall and cerebrospinal fluid using Bloch equation simulation. An optimized whole-brain intracranial artery wall imaging protocol which had comparable higher CR and SNR within 8min and 0.55mm iso resolution was found. The simulation results were verified by the volunteer study and matched the experiments well.
Introduction
Magnetic resonance imaging is the most promising technique for intracranial vessel wall imaging [1]. 3D fast spin echo sequence with variable-flip-angles[2] (SPACE for Siemens, VISTA for Philips, CUBE for GE) has gain popularity in this research area due to its high sample efficiency, large spatial coverage and intrinsic black blood property [3,4]. However, its relative long scan time (10~12min) makes it clinically impractical [5,6], and its multiple imaging parameters make it very difficult to be optimized. In this study, we looked into the effect of various imaging parameters of T1 weighted SPACE on the signal-to-noise (SNR) and contrast ratio (CR) between vessel wall and cerebrospinal fluid (CSF) using Bloch equation simulation, based on spatial coverage and scan time constraints.Methods
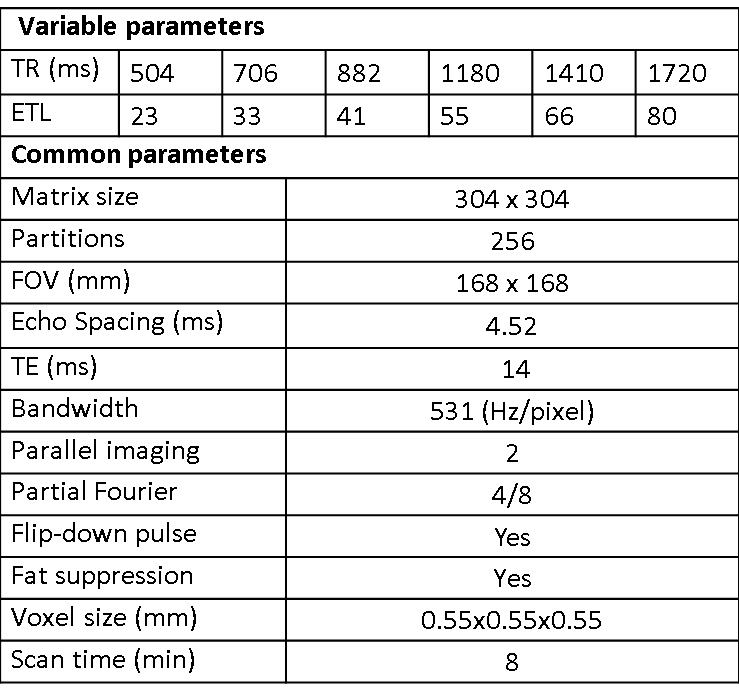
Sequence and simulation: The sequence was based on T1 weighted SPACE with flip-down pulse[7]. A non-selective excitation pulse was used to achieve whole-brain coverage [8]. Bloch equation simulation was performed to help understand the effect of various imaging parameters on signal intensity and CR (CR = Sa/Sb) between vessel wall and CSF [3]. The simulation setup is as following: Spatial coverage (256 partitions) and scan time (8min) were fixed, ETL was varied from 23 to 80, TR was varied (430~1410ms) correspondingly. Variable refocusing RF pulse flip angle series were calculated from a prescribed signal evolution of a reference tissue with specific T1 and T2 values. We fixed T1 value to 1000ms and T2 varied from 100 to 500ms. Other common parameters were shown in Figure 1. Human study: The studies were IRB approved, and informed consents were obtained from all human subjects. 6 healthy volunteers (24~56 years old, 4 female) were scanned on a 3T scanner (Siemens Tim Trio) using a 32-channel head coil to verifying the simulation results. T2 varied (100 130 150 170 200ms) while ETL and TR were fixed at 41 and 882ms (3 subjects), respectively; ETL varied (23 33 41 55 66) while T2 was fixed at 150ms (3 subjects), and the corresponding TR was (504 706 882 1180 1410ms). Optimized parameters giving good T1 contrast between vessel wall and CSF and sufficient vessel wall signal were determined. The optimal imaging protocol was then applied to a pilot patient study. 3 patients diagnosed with intracranial stenosis were recruited for this study. After spatial localization, T2 TSE and DWI were performed. Optimized T1w SPACE was then scanned. ceMRA was acquired during gadolinium (BeiLu Pharmaceutical Co.) administration. Optimized T1w SPACE was repeated 1~2 minutes after contrast administration. Data analysis: In the volunteer study, SNR and CR between white matter (T1 and T2 values similar to vessel wall [9]) and CSF from different imaging parameter combinations were calculated. Noise was obtained from the artifact free background air region nearby. Simulation data were linearly scaled to facilitate comparison with experimental results.Results
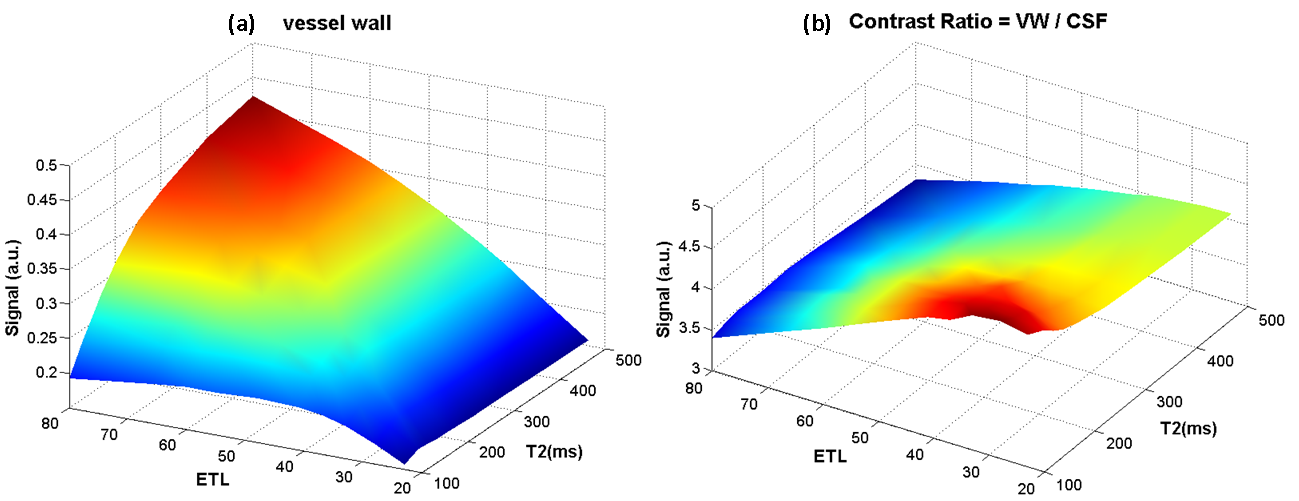
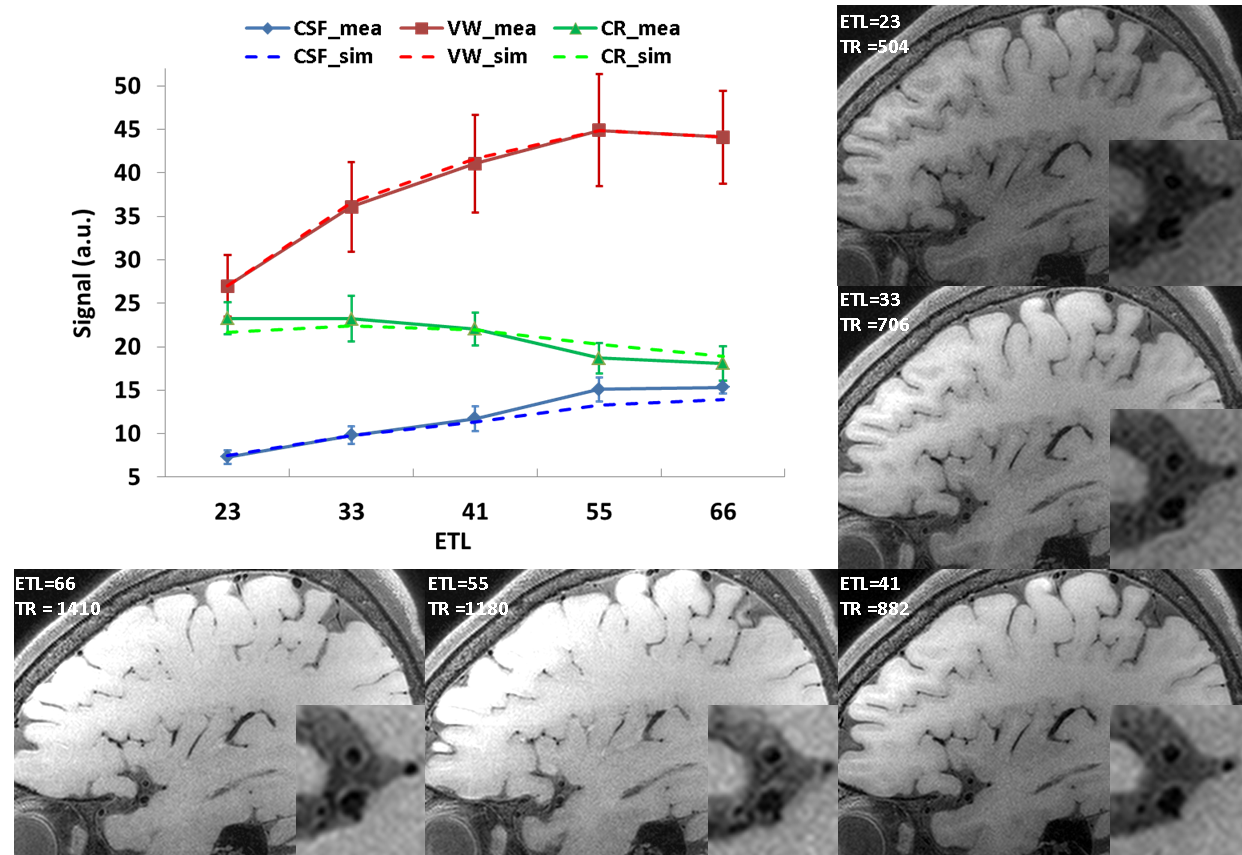
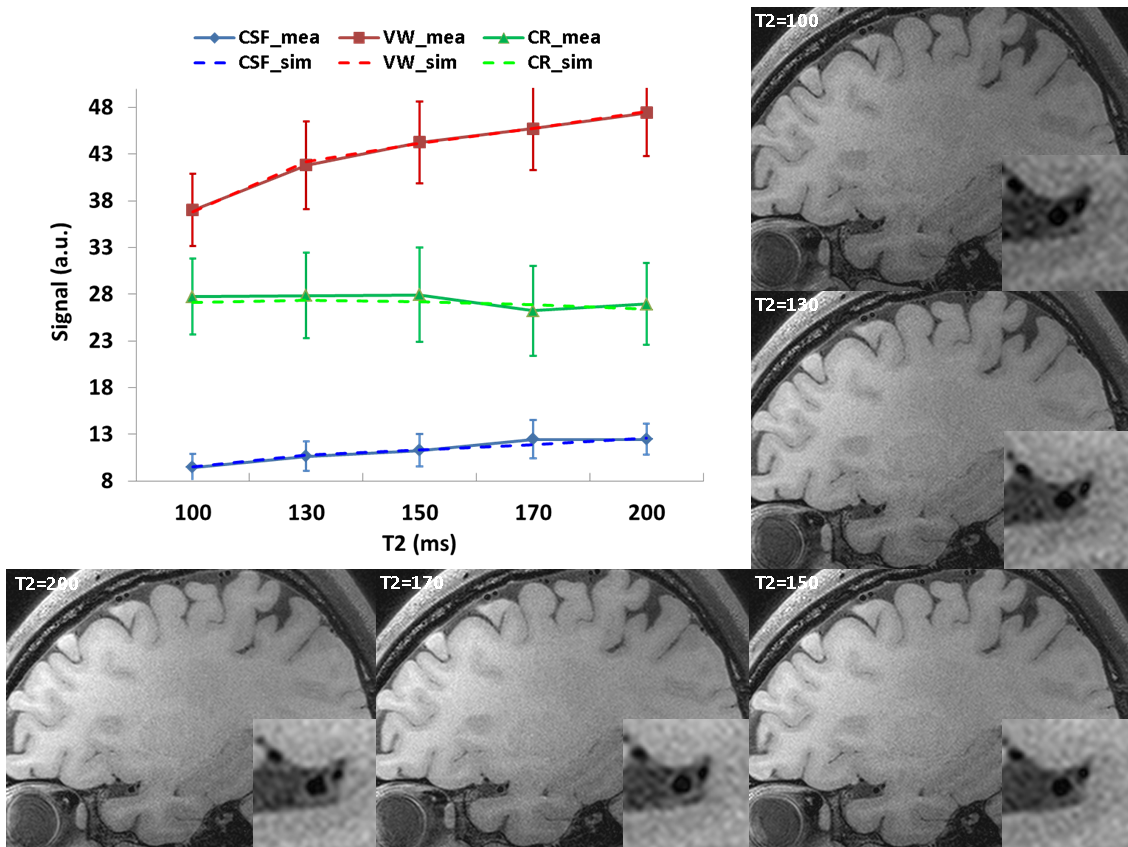
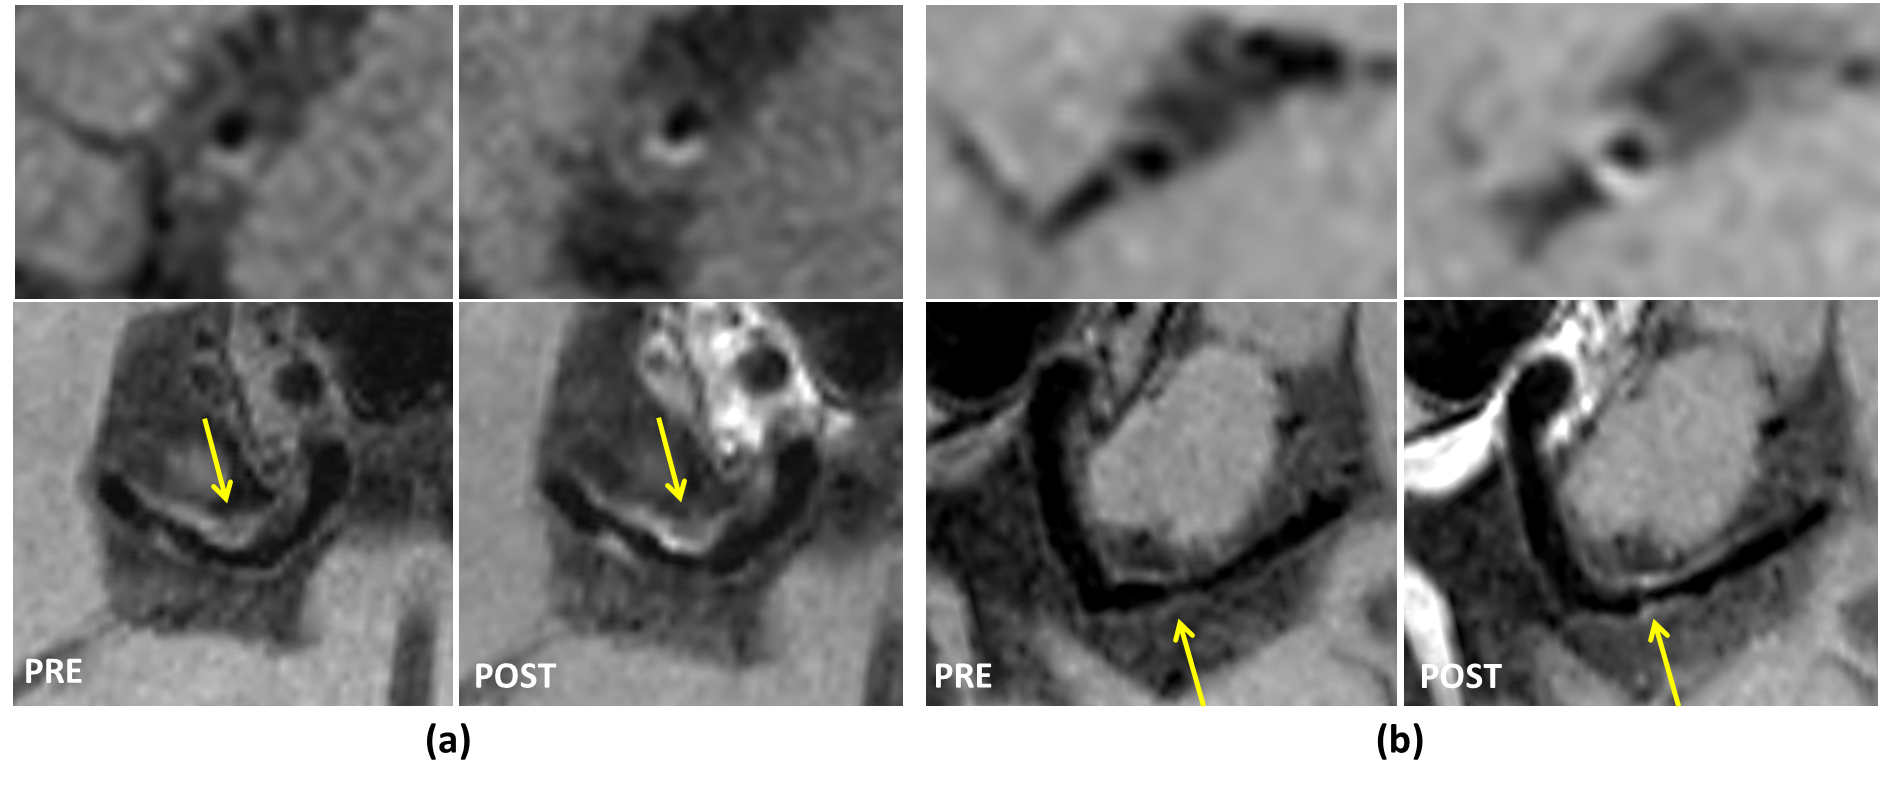
Figure 2 shows the simulation results of (a) vessel wall signal and (b) wall-CSF CR. The wall signal intensity increases with increasing ETL and T2. CR is optimal around T2 (100~200ms) and ETL (30~40). Figure 3 and 4 show how vessel wall SNR, CSF SNR and CR between the two tissues evolve with ETL and T2. The signal of vessel wall exhibits peak at ETL=55 (TR=1180ms) and increases with increasing T2 value. In opposite, the wall-CSF CR decreased with increasing ETL and T2. The simulation results matched well with the experimental results.The dependence of contrast on ETL and T2 in vivo are shown in Figure 3 and 4, we can see that the combination of ETL=41/TR=882ms and T2=200ms provides the image with good T1 contrast and sufficient wall SNR, and was chosen as an optimal imaging protocol. Figure 5 shows the images from 2 patients scanned with this optimal imaging protocol.Discussion and conclusion
In this study, we looked into the effect of various imaging parameters (ETL/TR, T2) on SNR and CR between vessel wall and CSF using Bloch equation simulation. An optimal intracranial artery wall imaging protocol with comparable higher CR and SNR within 8min and 0.55mm can be found from the simulation. There is a good agreement between simulation and experiment results. It has been noted that contrast is the primary concern in this study, therefore we limited ETL/TR and T2 values. Otherwise, if signal intensity is the primary consideration, ETL/TR and T2 can be boosted at the cost of compromising contrast according to our simulation results. In summary, this work provideS an optimization framework to analyze the trade-offs between contrast, signal intensity, scan time and resolution quantitatively, in intracranial vessel wall imaging using T1 weighted SPACE sequence.Acknowledgements
No acknowledgement found.References
[1] Dieleman N, et al., Circulation, 130:192, 2014
[2] Mugler JP 3rd, J Magn Reson Imaging, 39:745, 2014
[3] Zhang L, et al., MRI, 33:1026, 2015
[4] Qiao Y, et al., J Magn Reson Imaging, 34:22, 2011
[5] Fan Z, et al., Proc. 23th ISMRM, Toronto, Canada, p.4538, 2015
[6] van der Kolk AG, et al., Stroke, 42:2478, 2011
[7] Park J, et al., Magn Res Med, 58:982, 2007
[8] van der Kolk AG, et al., Eur Radiol, 23:2996, 2013
[9] Stanisz GJ, et al., Magn Res Med, 54:507, 2005
Figures