2780
Quantitative characterization of calcified and lipid-laden blood clot in vitro at 3T1Imaging Research Laboratories, Robarts Research Institute, Western University, London, ON, Canada, 2Dept. of Medical Biophysics, Schulich School of Medicine & Dentistry, Western University, London, ON, Canada, 3Dept. of Biochemistry, Schulich School of Medicine & Dentistry, Western University, London, ON, Canada, 4Dept. of Clinical Neurological Sciences, Western University, London, ON, Canada
Synopsis
Thrombus composition in embolic occlusion, particularly the presence of thrombolysis-resistant components such as calcium and fat, can significantly influence treatment efficacy, yet current MR methods for inferring composition are qualitative and sensitive only to red blood cells. We examined the ability of novel post-processing algorithms applied to a tailored GRE acquisition to discriminate and quantify important components within in vitro blood clots of varied hematocrit over a nine-day ageing period. Calcium and lard were readily discernable throughout the experiment, while clots were differentiable from one another between two to six days, demonstrating this protocol's potential for thrombus characterization in vivo.
Introduction
Thrombotic occlusion is the underlying cause behind a number of common and devastating pathologies including stroke, heart attack and pulmonary embolism. Knowledge of thrombus composition may provide highly useful clinical information towards the treatment of such conditions, including predicting the efficacy of thrombolytic agents1 and mechanical thrombectomy procedures,2 and possibly determination of etiology.3 Current MR methods for inferring thrombus composition rely on a qualitative “susceptibility vessel sign” obtained from late-echo GRE, a metric sensitive only to red blood cell (RBC) concentration and capable only of global assessments of composition, rendering invisible other informative components that may be present such as calcium4 and fat/cholesterol.5 This work evaluates the ability of a tailored multi-echo GRE acquisition paired with recently developed novel post-processing algorithms to characterize relevant thrombus components in a cohort of in vitro clots of varying composition and throughout clot ageing over a biologically relevant timescale.6Methods
Imaging- Scans were performed at 3T with a 32-channel transmit/receive head-coil using a custom dual echo-train 3D GRE sequence (TE1/∆TE/TE5 = 3.20/1.46/9.04 ms, TE6/∆TE′/TE10 = 16.75/7.15/45.35 ms, TR: 47.6 ms, resolution: 0.94x0.94x1 mm3, matrix: 192x192x42, BW: 142.86 kHz, flip angle: 10°, scan time = 6 min 28 sec). The dual echo-train design enables the acquisition of both in- and out-of-phase images for water-fat separation and T2* decay sensitivity for Quantitative Susceptibility (QS) and R2* maps.
Image post-processing- Individual channel phase data were saved and the inter-echo variance channel-combination algorithm7 was used to create local frequency shift (LFS) maps for QS mapping,8 and the non-iterative B0-NICE algorithm9 was used to calculate fat fraction (FF), B0 field and R2* maps.
Phantom- Arterial porcine blood anticoagulated with sodium citrate was used to create duplicate 1.5mL blood samples of 0, 20, 40 and 60% hematocrit. Samples were clotted inside 1cm diameter polystyrene tubes by the addition of calcium chloride and thromboplastin. To emulate clinically observed emboli with calcified or lipidic components,10 2.5mm length pieces of either calcium carbonate or lard were added to clots of different hematocrit. Platelet-poor plasma filled the remainder of each tube. Tubes were inserted into an agar phantom and kept at 37°C throughout the experiment except when scanning. The phantom was scanned at 2, 6 and 17 hours and daily thereafter up to 9 days post-clotting.
Statistical analysis- Repeated-measures ANOVA followed by the Tukey post-hoc test was used for statistical analysis. Significance was considered at p ≤ 0.05.
Results
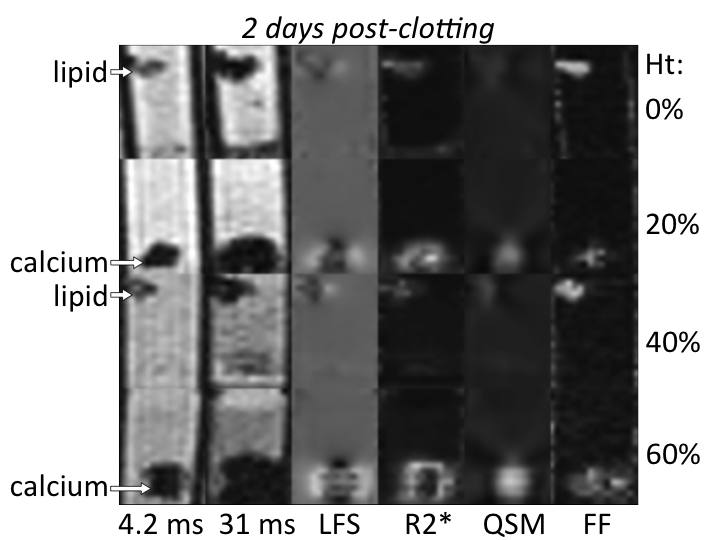
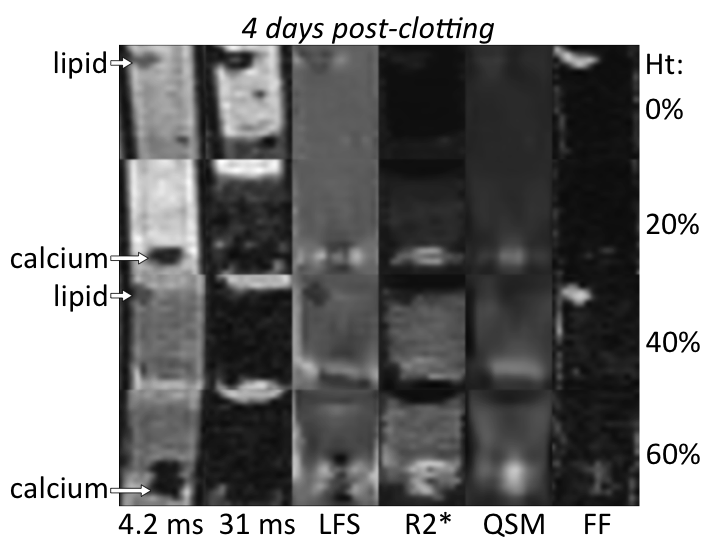
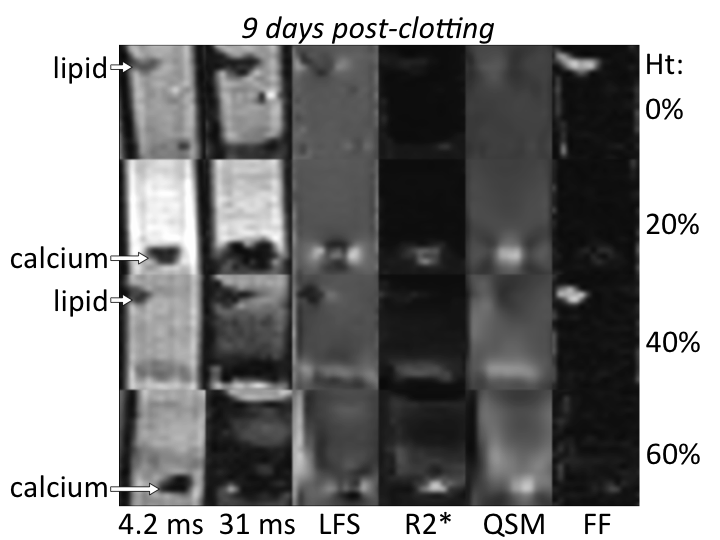
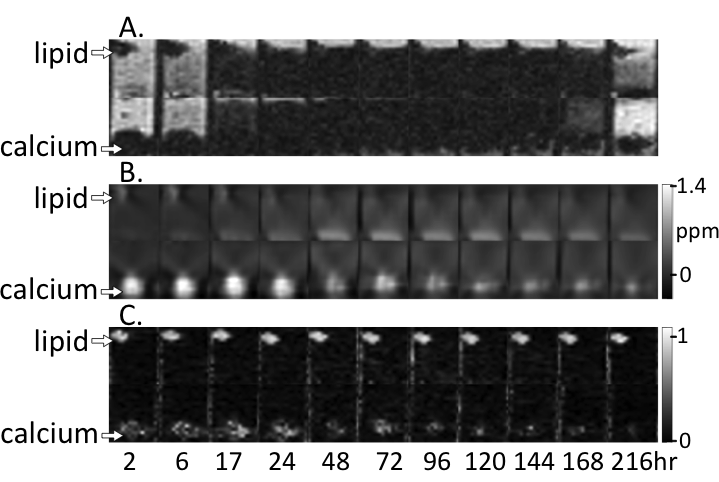
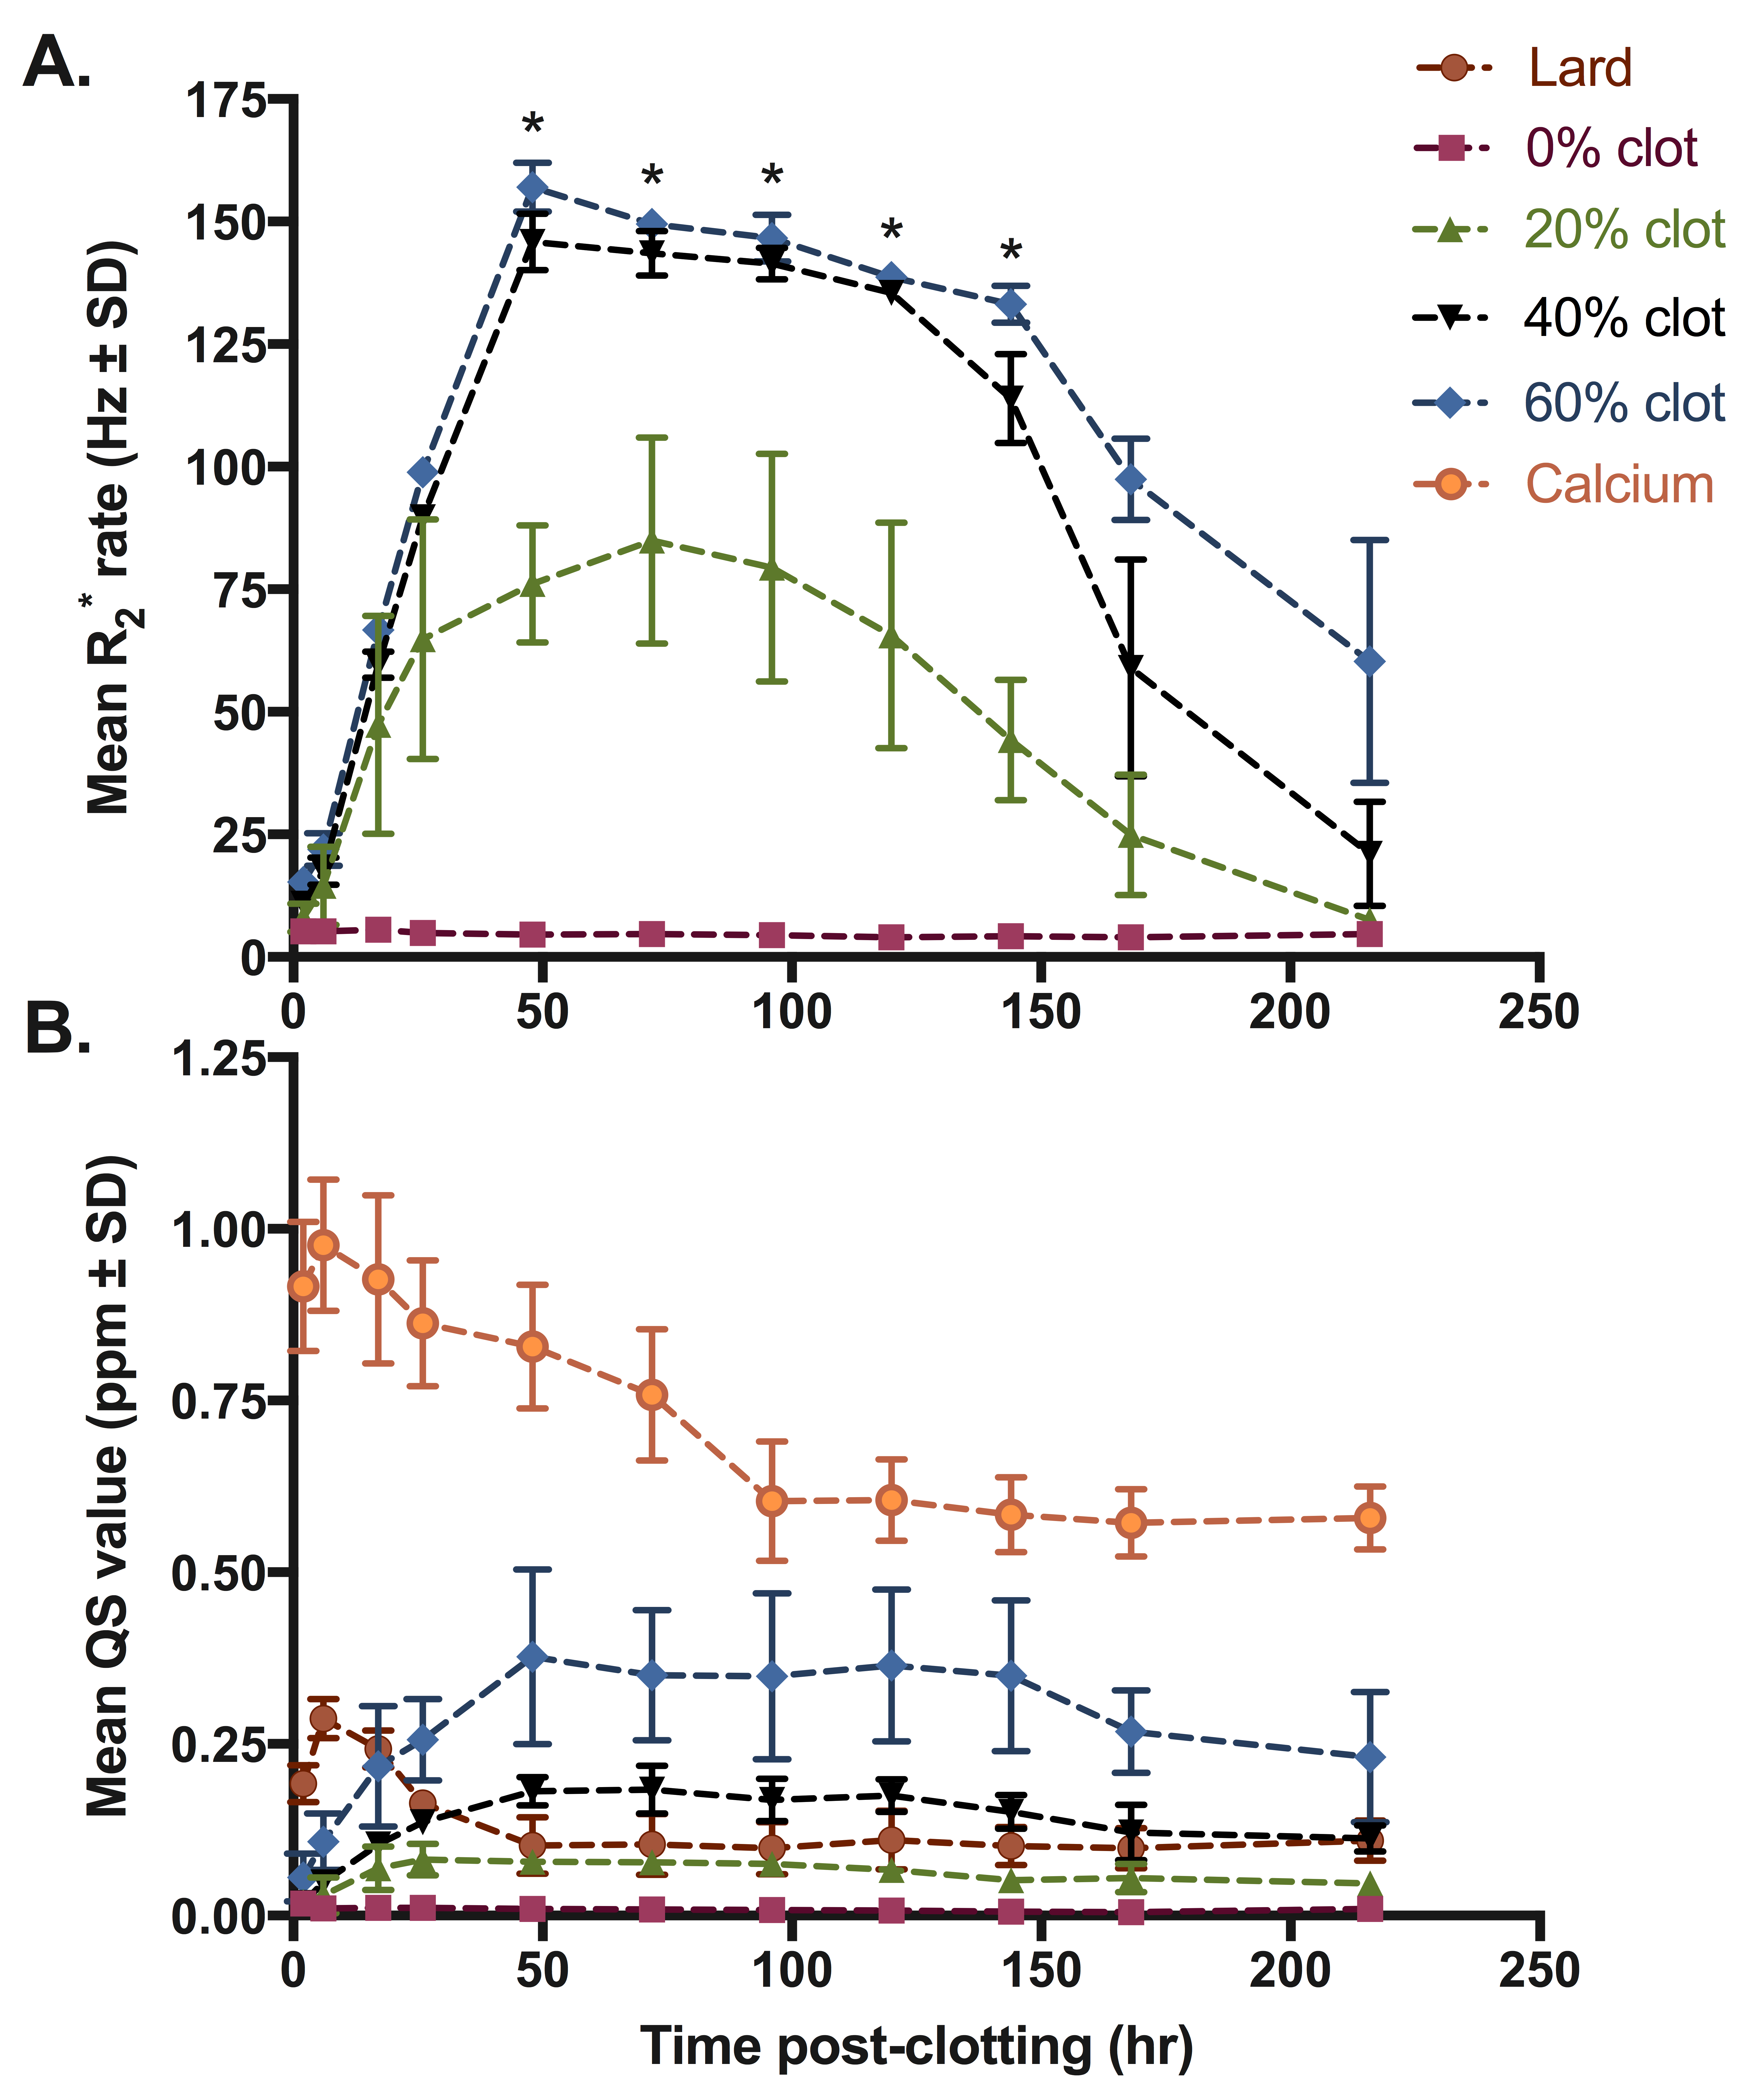
Figures 1-3 show multi-parametric composite images of clot of each hematocrit at an early, intermediate and late time point. Figure 4 shows multi-parametric images of 40% hematocrit clots containing lard and calcium at every time point in the experiment. Lard had a significantly higher mean FF value, while calcium carbonate had a significantly higher QS value, than the opposite component and all clots at every time point. Clot R2* values showed a parabolic relationship with time, peaking between 48-72 hours (Fig. 5A). The 40 and 60% clots did not significantly differ at any time in experiment, but between days 2 to 6 the R2* values of the 0, 20 and ≥40% hematocrit clots were all significantly different from each other.Discussion
Both calcium and lard remained readily differentiable from clot of every hematocrit (Figs 1-3) and at all time points (Fig. 4) in the experiment. Increasing clot R2* rates over the first days of clot formation is known to be caused by the increasing deoxygenation of RBCs as their metabolic processes fail.11 The 40 and 60% clots have highly similar R2* values because they have equivalent magnetic susceptibility heterogeneity.12 The decrease in clot R2* rates observed near the end of the experiment is likely due to diffusion of eryptotic iron components into plasma following lysis of RBCs,13 which is supported by the clot QS values remaining relatively stable throughout this period (Fig. 5B).Conclusion
With the proposed protocol, clinically relevant sized pieces of lard and calcium carbonate are readily differentiated inside blood clot of up to 60% hematocrit aged up to 9 days. Blood clots of negligible (0%), low (20%) and medium to high (40-60%) hematocrit can be differentiated on the basis of R2* values, but only once the RBCs have become sufficiently aged/deoxygenated.
This method shows high clinical promise for discriminating calcified and lipidic components within in vivo thrombi, and inferring an approximate clot hematocrit in thrombi that are not extremely fresh; neither task is possible with current clinical methods. As well, the acquisition is readily translatable to the clinic as the work presented here was completed entirely from a single, unaccelerated 6-minute scan.
Acknowledgements
The authors would like to thank Ralph Bos Meats for providing the porcine blood. M.D. is a Career Scientist of the Heart and Stroke Foundation of Ontario and S.C. acknowledges the Canadian Institutes of Health Research Canada (CIHR) Graduate Scholarships-Master’s Program for funding of his research.References
1. Niessen, F., et al., Differences in clot preparation determine outcome of recombinant tissue plasminogen activator treatment in experimental thromboembolic stroke. Stroke, 2003. 34(8): p. 2019-2024.
2. Yuki, I., et al., The impact of thromboemboli histology on the performance of a mechanical thrombectomy device. American Journal of Neuroradiology, 2012. 33(4): p. 643-648.
3. Boeckh-Behrens, T., et al., The Impact of Histological Clot Composition in Embolic Stroke. Clinical Neuroradiology, 2014.
4. Almekhlafi, M.A., et al., Calcification and endothelialization of thrombi in acute stroke. Annals of Neurology, 2008. 64(3): p. 344-347.
5. Ezzeddine, M.A., et al., Clinical characteristics of pathologically proved cholesterol emboli to the brain. Neurology, 2000. 54(8): p. 1681-1683.
6. Nosaka, M., et al., Time-dependent organic changes of intravenous thrombi in stasis-induced deep vein thrombosis model and its application to thrombus age determination. Forensic Science International, 2010. 195(1–3): p. 143-147.
7. Liu, J., et al., Inter-echo variance as a weighting factor for multi-channel combination in multi-echo acquisition for local frequency shift mapping: Local Frequency Shift Mapping. Magnetic Resonance in Medicine, 2015. 73(4): p. 1654-1661.
8. Bilgic, B., et al., Fast image reconstruction with L2-regularization. Journal of Magnetic Resonance Imaging, 2014. 40(1): p. 181-191.
9. Liu, J. and M. Drangova, Method for B0 off-resonance mapping by non-iterative correction of phase-errors (B0-NICE): B0 Mapping with Multiecho Data. Magnetic Resonance in Medicine, 2015. 74(4): p. 1177-1188.
10. Walker, B.S., L.M. Shah, and A.G. Osborn, Calcified Cerebral Emboli, A “Do Not Miss” Imaging Diagnosis: 22 New Cases and Review of the Literature. American Journal of Neuroradiology, 2014. 35(8): p. 1515-1519.
11. Bradley, W.G. and P.G. Schmidt, Effect of methemoglobin formation on the MR appearance of subarachnoid hemorrhage. Radiology, 1985. 156(1): p. 99-103.
12. Janick, P.A., et al., MR imaging of various oxidation states of intracellular and extracellular hemoglobin. American Journal of Neuroradiology, 1991. 12(5): p. 891-897.
13. Lang, E. and F. Lang, Triggers, Inhibitors, Mechanisms, and Significance of Eryptosis: The Suicidal Erythrocyte Death. BioMed Research International, 2015. 2015.
Figures