2771
Reproducibility of Semi-automatic Carotid Intraplaque Hemorrhage Quantification using SNAP MRI1University of Washington, Seattle, WA, United States
Synopsis
Intraplaque hemorrhage (IPH), a characteristic feature of high-risk atherosclerosis, can be identified as hyperintensity areas on T1-weighted MRI. Simultaneous Non-contrast Angiography and intraPlaque hemorrhage (SNAP) MRI has been shown to provide comparable IPH detection as MPRAGE with additional benefit of lumen assessment in the same scan. In this study, we developed a semi-automatic method to detect and quantify IPH on SNAP MRI with histology confirmation. An objective IPH detection threshold was identified and high scan-rescan reproducibility was obtained for semi-automatic IPH volume measurement and maximum IPH intensity.
Purpose
Intraplaque hemorrhage (IPH) is a high-risk feature of atherosclerosis, which can stimulate plaque progression and is associated with an increased risk for ischemic cerebrovascular events.1-3 Although good reproducibility of manual IPH detection has been achieved4 using MPRAGE, reproducibility of IPH volume and signal intensity has not been reported. Recent techniques such as simultaneous non-contrast angiography and intraplaque hemorrhage (SNAP) MRI were developed to concurrently increase IPH-to-wall contrast and improve flow-suppression efficiency5 and may improve IPH volume and intensity measurements. In this study, we aimed to 1) develop a SNAP-based semi-automatic method for objective and time-efficient IPH characterization and to 2) establish the scan-rescan reproducibility of IPH intensity and volume quantification.Methods
Study population: Two groups of patients were recruited: fourteen patients (Group 1) scheduled for carotid endarterectomy (CEA) were scanned prior to surgery to determine the optimal intensity threshold to detect IPH using histology as the gold standard; another thirty-three asymptomatic patients (Group 2) with carotid plaques underwent two SNAP MRI scans within one month to obtain scan-rescan reproducibility. MRI protocol: Both conventional multi-contrast 2D carotid MRI (T1 weighted, T2 weighted, PD and TOF) and SNAP (TR/TE/TI = 10/4.8/500 ms, resolution = 0.8 mm isotropic) were acquired. Histology (Group 1): After CEA surgery, carotid plaque specimens were formalin fixed, decalcified in 10% formic acid, paraffin embedded, and sectioned axially.6 IPH presence/absence of each histology specimen was recorded. Blind matching between axial SNAP images and histology sections was achieved by matching them to conventional 2D MRI. Signal intensity normalization: SNAP MRI provides three images simultaneously: highly T1 weighted image, proton density weighted reference image (REF) and the phase corrected real image (CR). The CR was used for IPH detection but the mean intensity of sternocleidomastoid (SCM) in REF was used to normalize CR signal intensity, since muscle and fibrous tissue signal in CR were close to zero. The signal intensity ratio (SIR) of each pixel in CR was calculated. IPH intensity threshold (Group 1): IPH intensity threshold was optimized by maximizing the sum of sensitivity and specificity for IPH detection, using histology as the gold standard. Heavily calcified IPHs and small IPHs (area < 0.64 mm2 in histology) were excluded from the analysis. IPH detection and quantification (Group 2): A 3D region of interest (ROI) was generated manually for each carotid artery at the first scan, avoiding hyperintense areas outside of artery. Max SIR, IPH presence/absence, IPH volume (for each artery), and IPH mean intensity (for each IPH+ artery) were recorded, using IPH threshold optimized in Group 1. Reproducibility (Group 2): The 3D ROI of the first scan was mapped to the same location at the second scan by local rigid registration. Statistics (Group 2): Cohen’s kappa and the intraclass correlation coefficient (ICC) were used to assess the reproducibility of IPH detection and quantification, respectively. Pearson’s correlation coefficients were obtained between the inter-scan time interval and within-subject coefficient of variation (CV) of IPH volume and intensity.Results
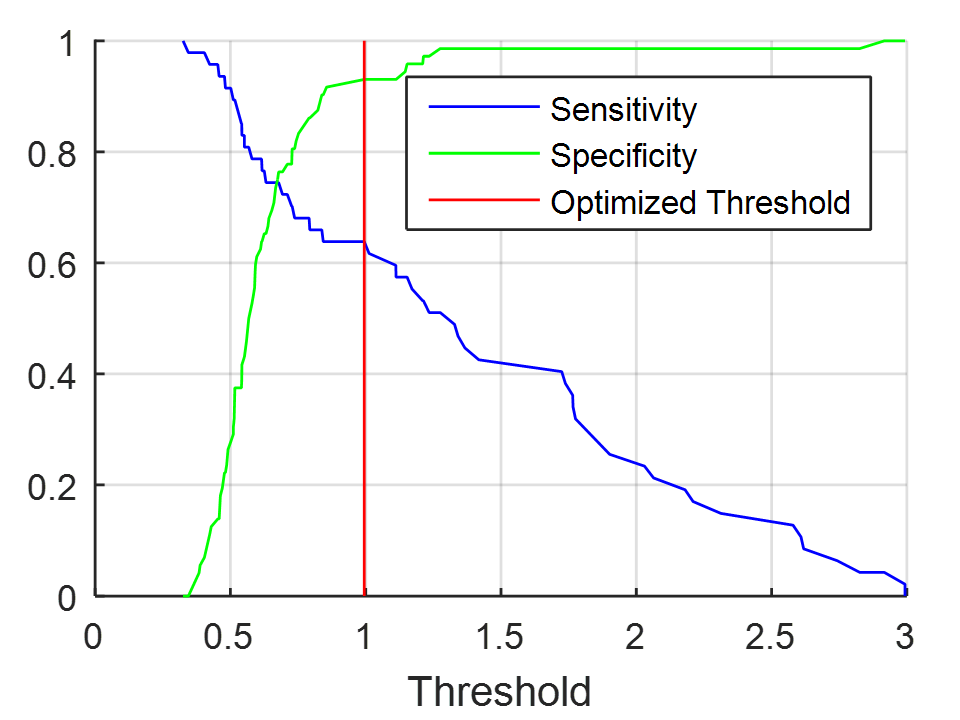
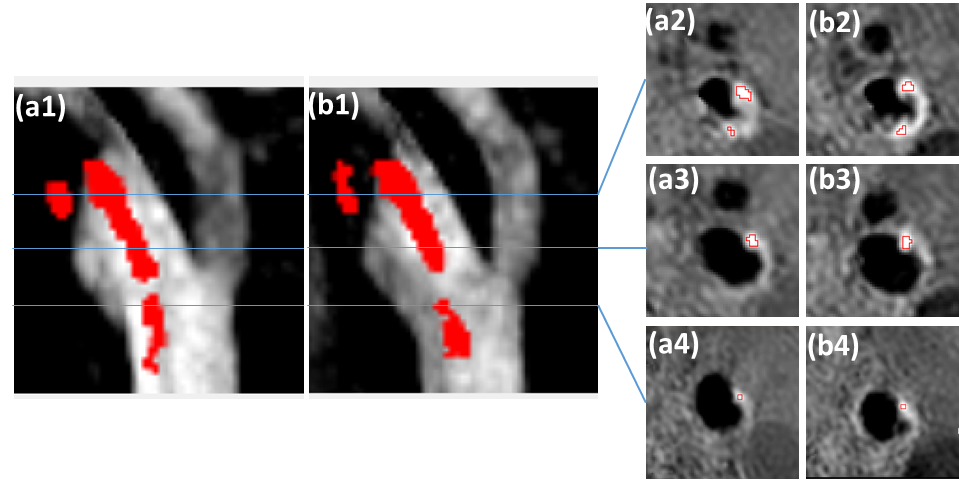
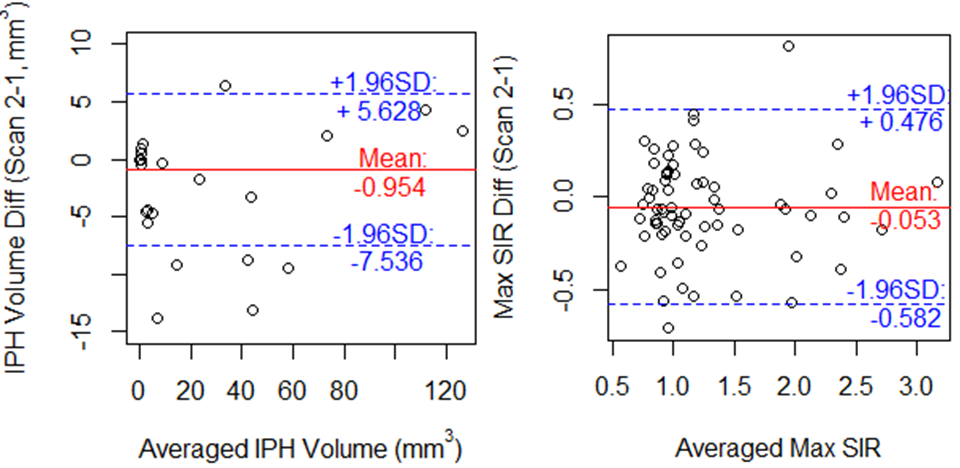
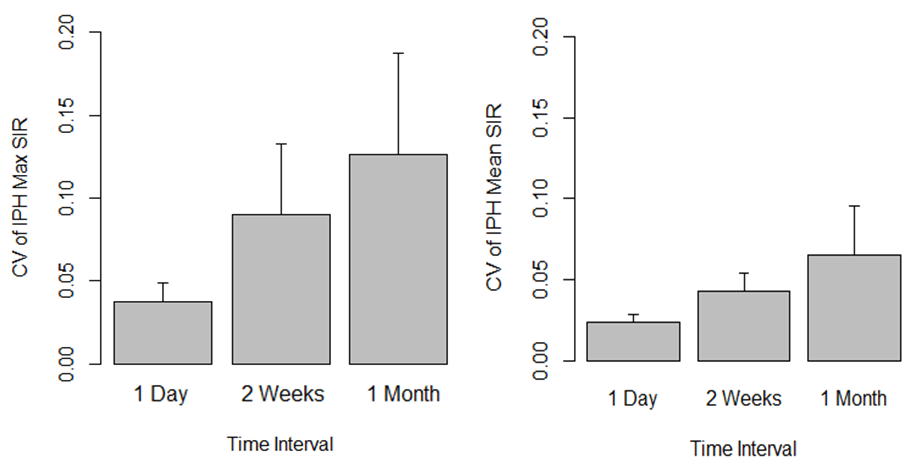
112 matched SNAP slices (40 IPH+) from 14 patients in Group 1 were included in the IPH threshold optimization. The optimized threshold for IPH detection was found to be 1.0 times the SCM in REF (Figure 1). In Group 2, using this optimized threshold (Figure 2), IPH was detected on both scans in 17 arteries (25.8%) and on only one scan in 7 arteries (10.6%), resulting in an inter-scan kappa of 0.75 (0.58, 0.93). The max SIR of all arteries had a high reproducibility with an ICC of 0.88 (0.81, 0.93) and IPH volume had an excellent scan-rescan agreement with ICC of 0.99 (0.98, 0.99) (Figure 3). Among the 17 arteries with IPH detected in both scans, IPH quantification variance increased significantly with longer inter-scan time interval for IPH intensity (max SIR: r = 0.55, p = 0.022; mean SIR: r = 0.67, p = 0.004) (Figure 4), but not for IPH volume (r < 0.01, p = 0.999).Discussion
Recently, serial studies7 have reported that IPH signal change existed and differed between symptomatic and asymptomatic arteries.8 Our study showed that IPH signal intensity variation increased with time. The variation may be due metabolic processes that might in themselves contribute significant information about the stability of the plaque itself and warrants further study.Conclusion
Using SNAP-based semi-automatic IPH detection and quantification method based on an optimized intensity threshold with histology as the gold standard, high IPH quantification (volume and intensity) reproducibility was demonstrated. This method will allow for a more accurate assessment of IPH and its relationship to plaque progression.Acknowledgements
This research was supported by National Institutes of Health (R01 HL103609, R01 NS083503 and R01 NS092207). We would also like to thank Zachary E. Miller for assistance with the abstract modification.References
1. Michel JB, Virmani R, Arbustini E, Pasterkamp G. Intraplaque haemorrhages as the trigger of plaque vulnerability. Eur. Heart J. 2011;32(16):1977-U1946.
2. Takaya N, Yuan C, Chu BC, et al. Presence of intraplaque hemorrhage stimulates progression of carotid atherosclerotic plaques - A high-resolution magnetic resonance Imaging study. Circulation. 2005;111(21):2768-2775.
3. Saam T, Hetterich H, Hoffmann V, et al. Meta-analysis and systematic review of the predictive value of carotid plaque hemorrhage on cerebrovascular events by magnetic resonance imaging. Journal of the American College of Cardiology. 2013;62(12):1081-1091.
4. Yamada N, Higashi M, Otsubo R, et al. Association between signal hyperintensity on T1-weighted MR imaging of carotid plaques and ipsilateral ischemic events. Am J Neuroradiol. 2007;28(2):287-292.
5. Wang J, Bornert P, Zhao H, et al. Simultaneous noncontrast angiography and intraplaque hemorrhage (SNAP) imaging for carotid atherosclerotic disease evaluation. Magnetic resonance in medicine : official journal of the Society of Magnetic Resonance in Medicine / Society of Magnetic Resonance in Medicine. 2013;69(2):337-345.
6. Cai J, Hatsukami TS, Ferguson MS, et al. In vivo quantitative measurement of intact fibrous cap and lipid-rich necrotic core size in atherosclerotic carotid plaque: comparison of high-resolution, contrast-enhanced magnetic resonance imaging and histology. Circulation. 2005;112(22):3437-3444.
7. Sun J, Liu J, Balu N, et al. Dynamic changes in MR signals of intraplague hemorrhage are strongly correlated with plaque progression: A serial imaging study on carotid atherosclerosis. Atherosclerosis. 2016;252:e255.
8. Wang QJ, Wang Y, Cai JM, Cai YQ, Ma L, Xu XA. Differences of signal evolution of intraplaque hemorrhage and associated stenosis between symptomatic and asymptomatic atherosclerotic carotid arteries: an in vivo high-resolution magnetic resonance imaging follow-up study. Int. J. Cardiovasc. Imaging. 2010;26:323-332.
Figures