2766
Inter-Scanner T1 and T2 Measurement Variability Evaluation on Two 3T Scanners with Identical Hardware and Software ConfigurationAnshuman Panda1, Clinton E Jokerst1, Kristopher W Cummings1, and Prasad M Panse1
1Radiology, Mayo Clinic, Scottsdale, AZ, United States
Synopsis
Inter-scanner T1 and T2 measurement variability was evaluated on two 3T scanners with identical hardware and software configuration to identify the most robust combination of sequence, parameters and post-processing that produces accurate measurement and to establish confidence intervals for T1 and T2 measurements for in-vivo studies by incorporating “native” inter-scanner variability.
Introduction
The purpose of the study was to evaluate variability in T1 and T2 measurements performed at two scanners with identical hardware and software configuration using known reference (ISMRM/NIST phantom) to understand how these measurements change with sequence/parameter choices and post-processing algorithm. The goal was two-fold: 1) identify the most robust combination of sequence, parameters and post-processing that produces accurate measurement, and 2) establish confidence intervals for T1 and T2 measurements for in-vivo studies by incorporating “native” inter-scanner variability.Methods
The scans were performed on two Siemens MAGNETOM Skyra - 3T (64ch, XQ gradient, TimTX TrueShape) scanner and VE11B software version (Siemens Healthcare, Erlangen, Germany) using a 20-ch Head/Neck coil. The ISMRM/NIST MRI system phantom was used as “gold-standard” T1 and T2 reference [1]. Conventional NIST recommended inversion-recovery spin echo and spin echo sequence parameters were used to characterize the T1 and T2 values in the phantom. Additionally, vendor provided “clinical” T1 and T2 mapping sequence scans were also performed with the following parameters: T1 Mapping - True-FISP (MOLLI), FOV 250, slice thickened 8 mm, TR 300 ms, TE 1.28 ms , and T2 Mapping - Turbo flash (SSFP); FOV 250; slice thickness 8 mm; TR 223, ms; TE 1.5 ms. Finally, the T1 and T2 measurements were generated using two separate post-processing algorithms, the scanner inline post-processing algorithm and CVI42 (Circle cardiovascular imaging), for comparison. The values were temperature corrected, and ROI contours were exactly copied between the images to eliminate any inter and intra-observer variability.Results
Figure 1 shows phantom description from NIST, scanner setup and slices from scanners 1 and 2 respectively with ROIs for T1 and T2 measurements. The measurements were performed using the scanner inline and CVI 42 post-processing algorithms for both scanners. A large variability was observed for both higher (vials 1, 2) and lower (vials 10-14) T1 and T2 measurements. Hence only measurements from vials 3 -9 were included in the final analysis. Average variability of 3.8% and 20% was observed for scanner 1 T1 measurements when compared to T1 NIST reference for scanner inline and CVI 42 post-processing, respectively. For T2 measurement for scanner 1, average variability of 22.9% and 16.7% was observed. For scanner 2, average variability of 2.9% and 18.1% was observed for scanner 1 T1 measurements for scanner inline and CVI 42 post-processing, respectively. For T2 measurement for scanner 2, average variability of 18.1% and 18% was observed. Inter-scanner variability between scanner 1 and 2 was observed to be 1.1%, using scanner inline, and 2.64%, using CV1, for T1 measurements and 39.5%, using scanner inline, and 35.8%, using CV1, for T2 measurements.Discussion
T1 measurements correlated well with the NIST reference values for both scanners for in-line processing, with less than 1% inter-scanner variability. However, the measurement showed significantly higher variability (~20%) when using CVI 42 post processing. For T2 measurements, even with identical hardware configure and same acquisition parameter/sequences, significant variability (~18%) was observed between scanners irrespective of scanner inline or CVI 42 post-processing algorithm.Conclusion
Scanner hardware, acquisition parameters/sequences, and post-processing algorithms should all be evaluated individually for each scanner to determine variability in T1 and T2 measurements. Different combination of these is demonstrated here to produce significant different measurements for the same acquisition. In particular, the choice of post-processing algorithm was found to be equally critical for these measurements. T1 measurements were observed to be more robust and consistent than T2 measurements. It is therefore recommended to evaluate each combination of hardware, acquisition parameters/sequences, and post-processing methods before establishing clinical baselines, particular for T2 values.Acknowledgements
No acknowledgement found.References
1. Russek, S et al. "Characterization of NIST/ISMRM MRI System Phantom" ISMRM 20th Annual Meeting and Exhibition: May 5–11 2012 2012; Melbourne, Australia. 2012. p. 2456.
2. Keenan, K et al. “Standardized Phantoms for Quantitative Cardiac MRI.” Journal of Cardiovascular Magnetic Resonance 17.Suppl 1 (2015): W36. PMC. Web. 10 Nov. 2016.
Figures
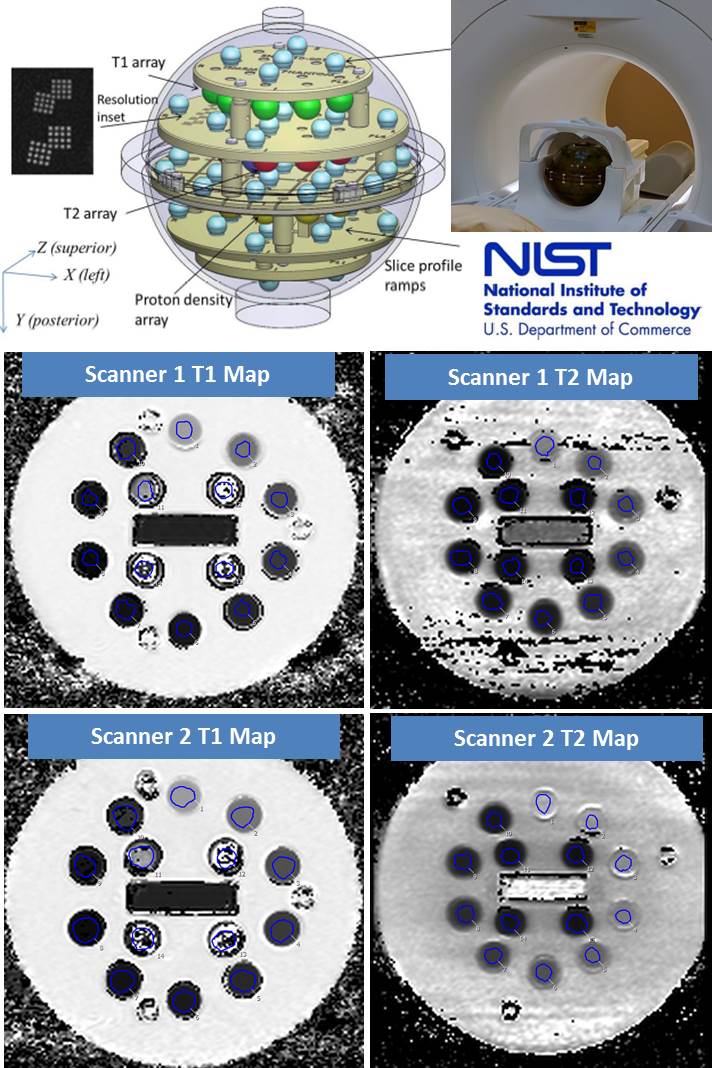
Figure 1:Phantom
setup and slices from scanners 1 and 2 with ROIs for T1 and T2 measurements