2763
Derivation and Validation of Synthetic Hematocrit Calculation from Blood Pool T1 values at multiple different cardiac blood pools, in both high and low flow states on 3T MRIOzair Rahman1, Kelvin Chow2, James Carr3, and Jeremy Collins1
1Radiology, Northwestern University, Chicago, IL, United States, 2Siemens Medical Solutions, 3Northwestern University
Synopsis
Comparison of the relationship between blood R1 and venous derived hematocrit in the left ventricle, left atrium, descending thoracic aorta, and short axis (apex, mid, and base) blood pools.
Introduction
Myocardial gadolinium extracellular volume fraction (ECV) quantification with T1 mapping is a clinically useful tool in diagnosis and prognosis of cardiac pathology. As originally described ECV calculation requires a recent laboratory hematocrit (HCTlab), which is impractical in the clinical routine and has slowed adoption of this technique. Recently, Treibel et al described a relationship between blood pool T1 values and the hematocrit using 1.5T MRI.Methods
A retrospective study was conducted on 95 consecutive patients (mean age 59.1±25.1years) who underwent cardiac MR (CMR) with gadolinium with native T1 and 15-20 minute post-contrast T1 mapping using a modified Look-Locker inversion recovery (MOLLI) sequence using a 5(3)3 scheme with single shot steady state diastolic readouts at a single center between April 4th, 2015 to February 3rd, 2016. Patients were randomly split into derivation and validation subgroups with equal health and disease representation. Patients were scanned at 3T (Magnetom Skyra, Siemens Medical Systems, Erlangen, Germany).T1 parametric maps quantified T1 values at the Left Ventricle (LV). ECV quantification was calculated with laboratory (ECVlab) and synthetic (ECVsyn) hematocrit using the tool developed by Kellman et al.Results
Proof of concept, 95 subjects (28 women, with a range of cardiac pathologies (Hypertrophic Cardiomyopathy, Amyloidosis, Sarcoidosis, etc) were randomly assigned to derivation (N=70)(mean age 63± 25.8 years) and validation (N=25)( mean age 59.1±25 years) cohort. A linear relationship between HCTlab and Left Ventricle R1Blood was used to quantify a synthetic ECV and Hct formula and subsequently this formula was applied to the validation cohort .Myocardial ECVsyn fractions calculated from were similar to those derived from laboratory-determined hematocrit (Figure 2). A fit curve was calculated and applied to the validation cohort and depicting high correlation. A bland-altman plot was performed to assess agreement between ECV calculations and lab vs synthetic hematocrit in the derivation cohort (Figure 1, 2).Discussion and Conclusion
Synthetic HCT calculation from pre-contrast blood pool T1 values at 3T derived from the relationship of blood r1 and venous hematocrit illustrated poor correlation (Figure 3). This correlation led to a significant bias (Figure 1) in synthetic hematocrit calculation, with poor estimation at both low and high hematocrit values. Our analysis also showed no significant change when comparing high flow or low flow cardiac blood pools. Interestingly, the ECV calculation compared well between lab and venous derived hematocrit, and further studies should be done to assess the importance of accurate hematocrit measurement (Figure 2).Acknowledgements
No acknowledgement found.References
No reference found.Figures
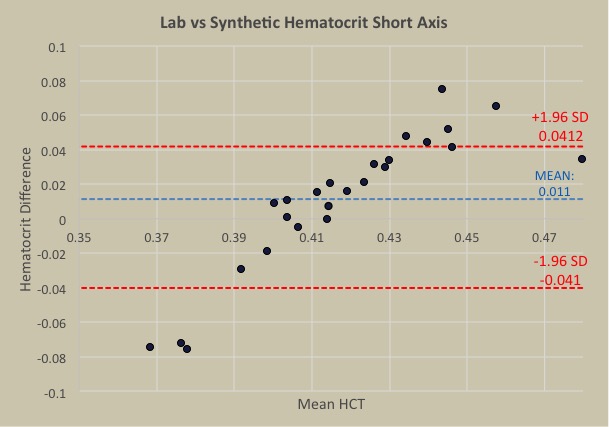
Bland altman graph depicting a positive
trend when comparing lab vs synthetic hematocrit.
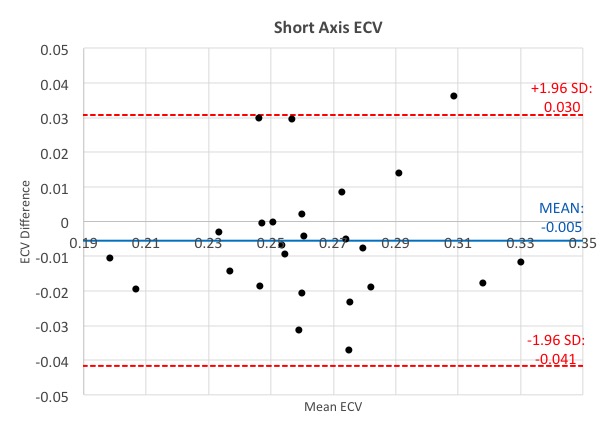
ECV calculation comparing lab vs venous
derived hematocrit.