2762
Optimization of MOLLI reconstruction for free-breathing myocardial T1 imaging1Department of Electrical Engineering, National Taiwan University of Science and Technology, Taipei, Taiwan
Synopsis
The free-breathing MOLLI (FB-MOLLI) presented in our previous study allowed T1 mapping in vivo without breath-hold. In this study, we attempted to implement unsupervised reconstruction for FB-MOLLI data sets and used a deformable method for image registration to improve the reliability of free-breathing T1 mapping. The results supported that the method improved the image alignments of the FB-MOLLI data sets and thus increased the quality of the T1 map. The variations of the repeated T1 measurements were significantly reduced in the anterolateral of the LV walls.
Purpose
Amount the myocardial T1 mapping techniques, the modified Look-Locker inversion recovery (MOLLI) sequence1 is accurate and reproducible. The free-breathing MOLLI (FB-MOLLI), presented in our previous study2, further allowed T1 mapping in vivo without breath-hold. In this study, we implemented unsupervised reconstruction for FB-MOLLI data sets and used a deformable method for image registration to improve the reliability of free-breathing T1 mapping.Materials and Methods
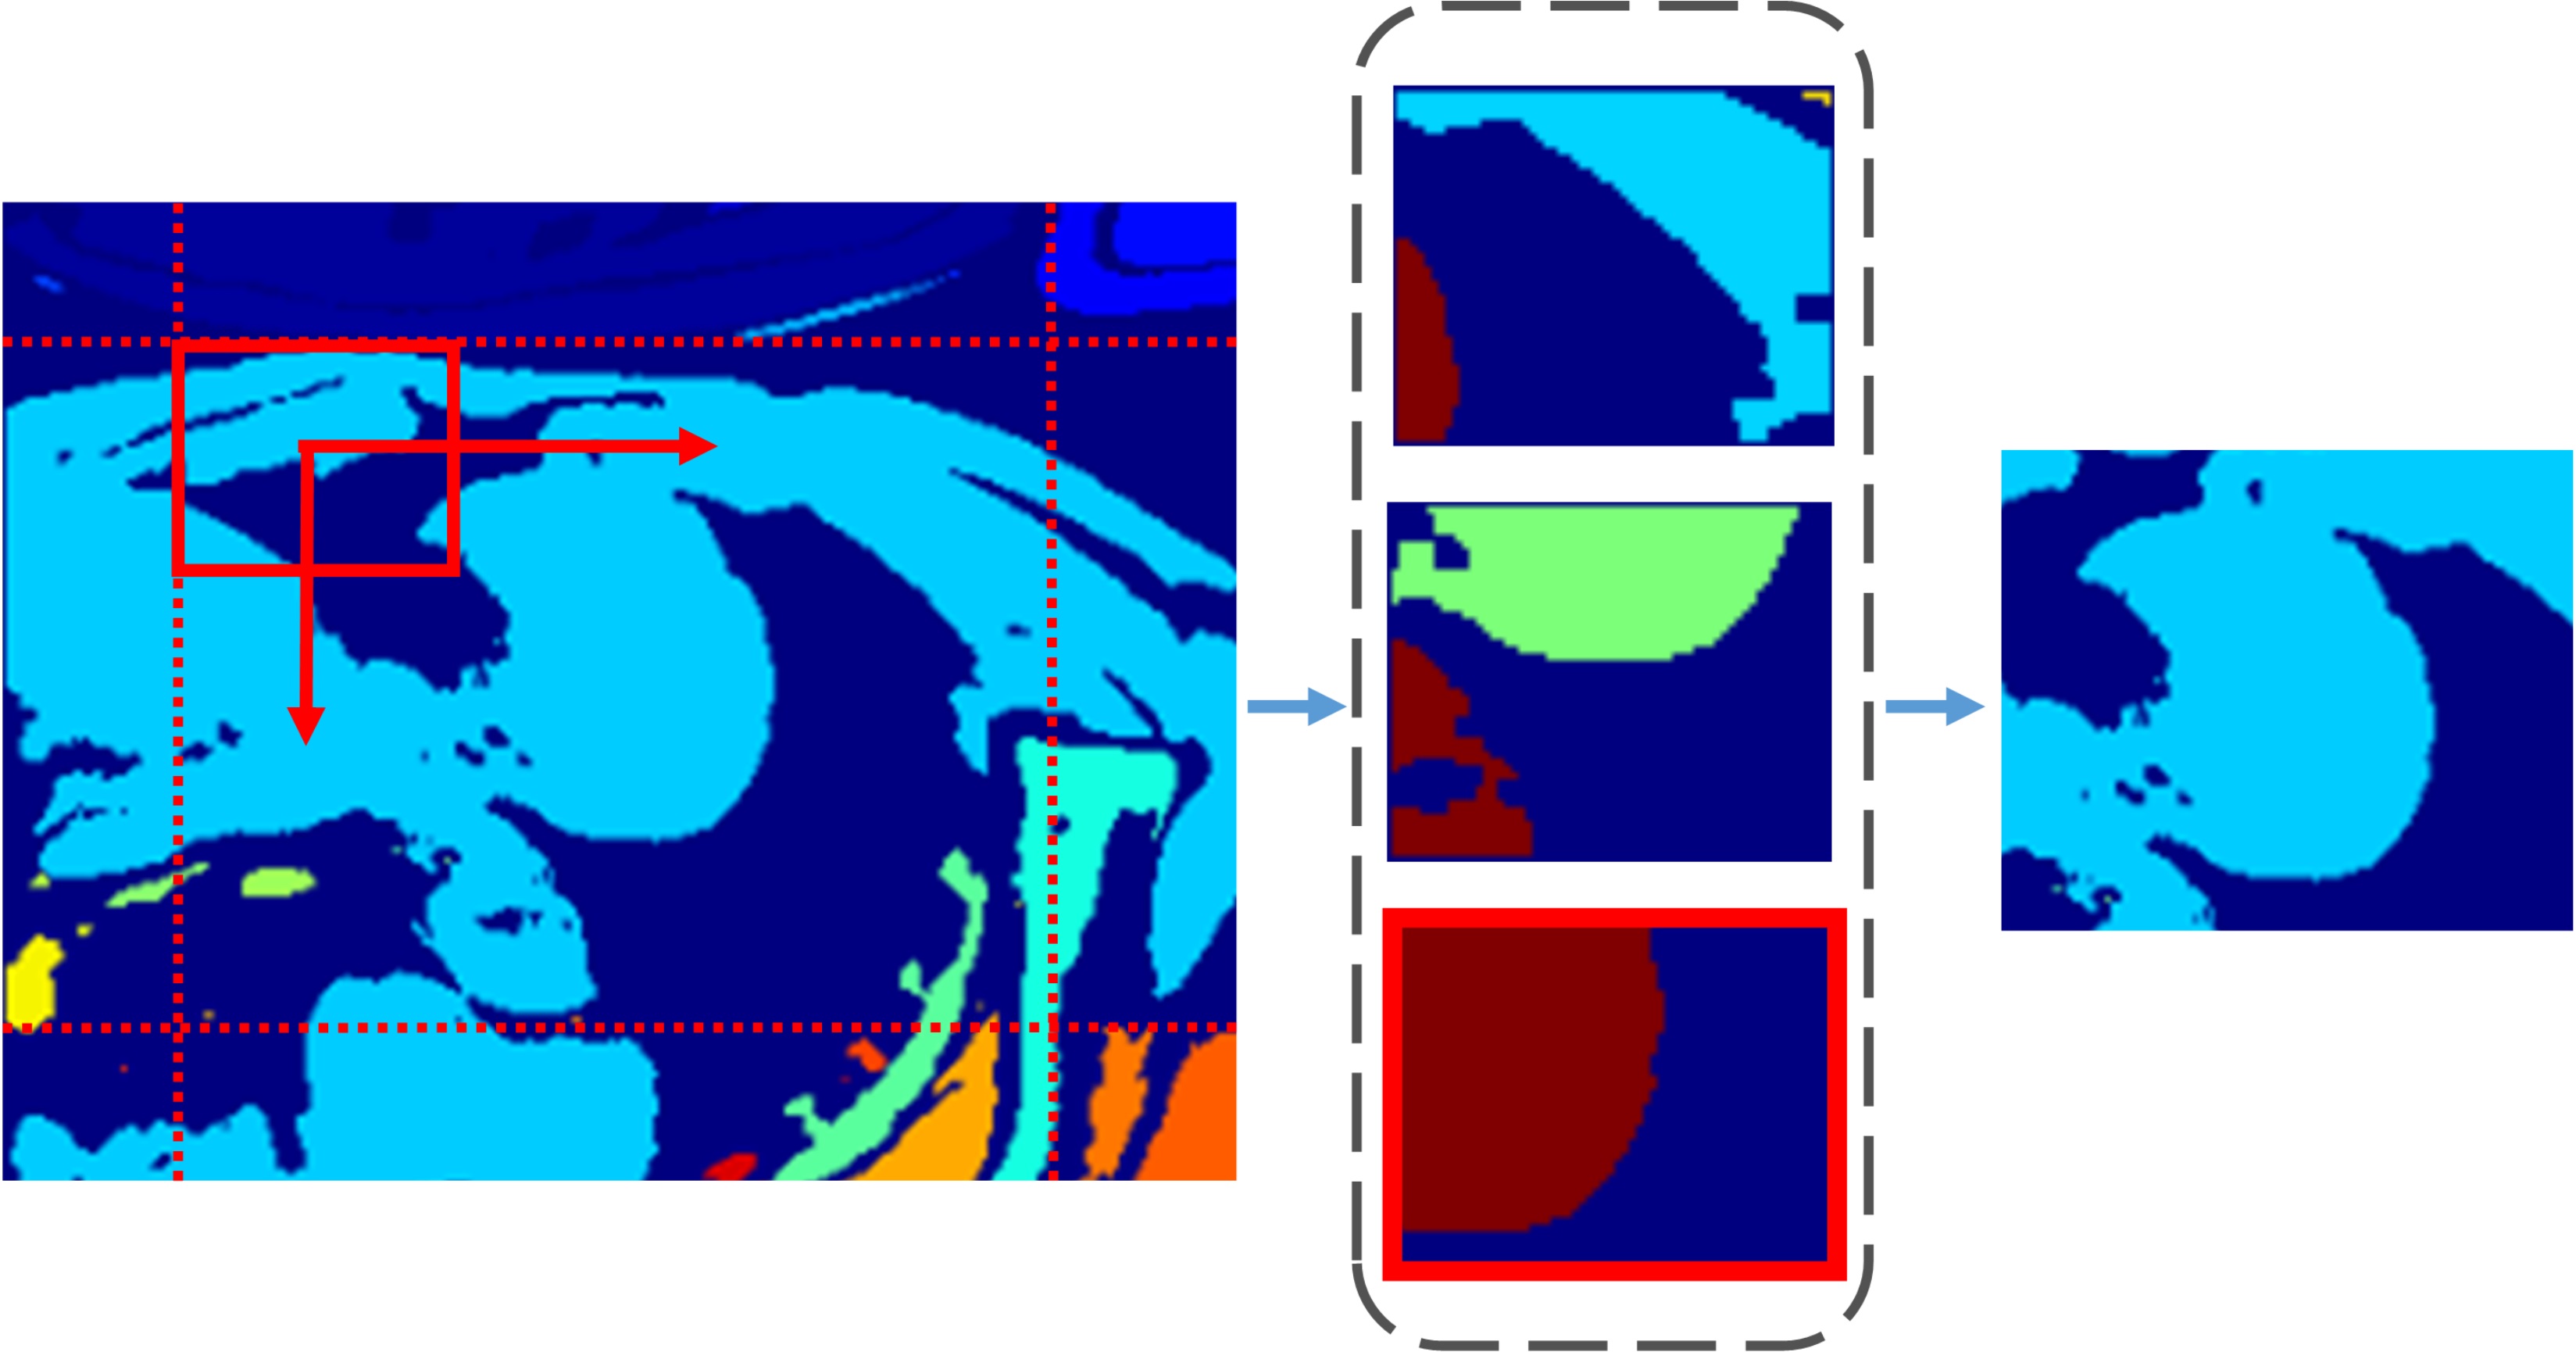
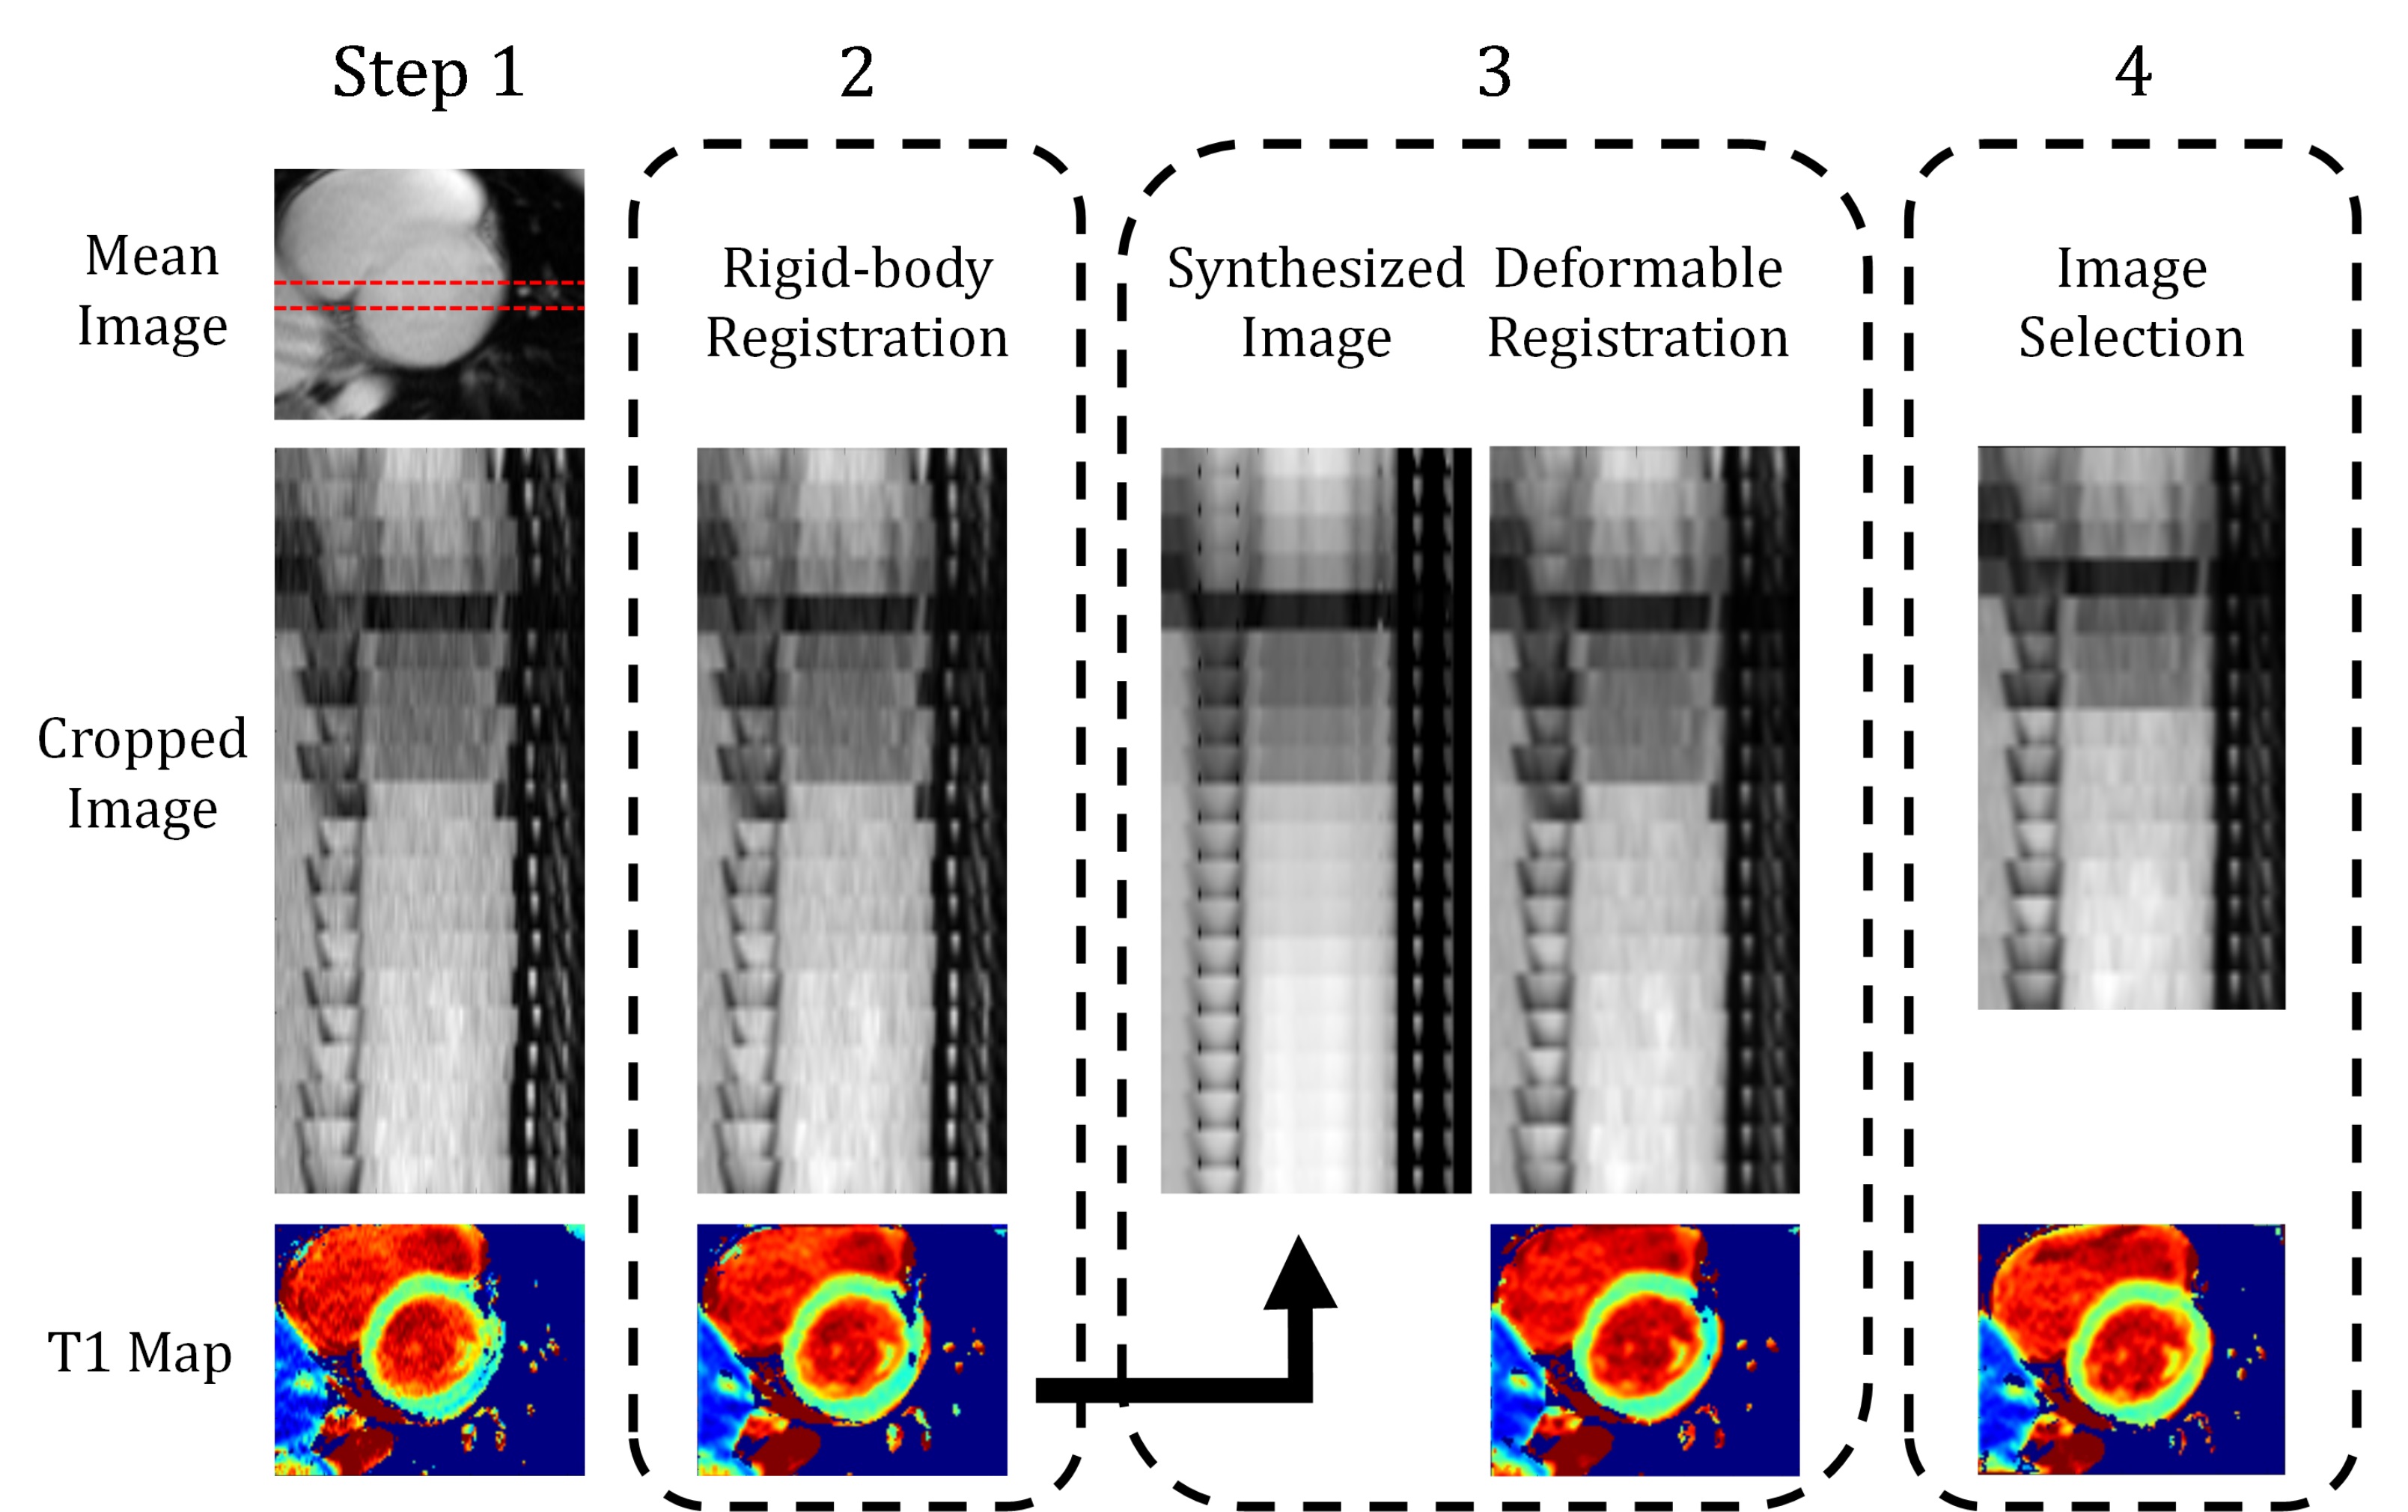
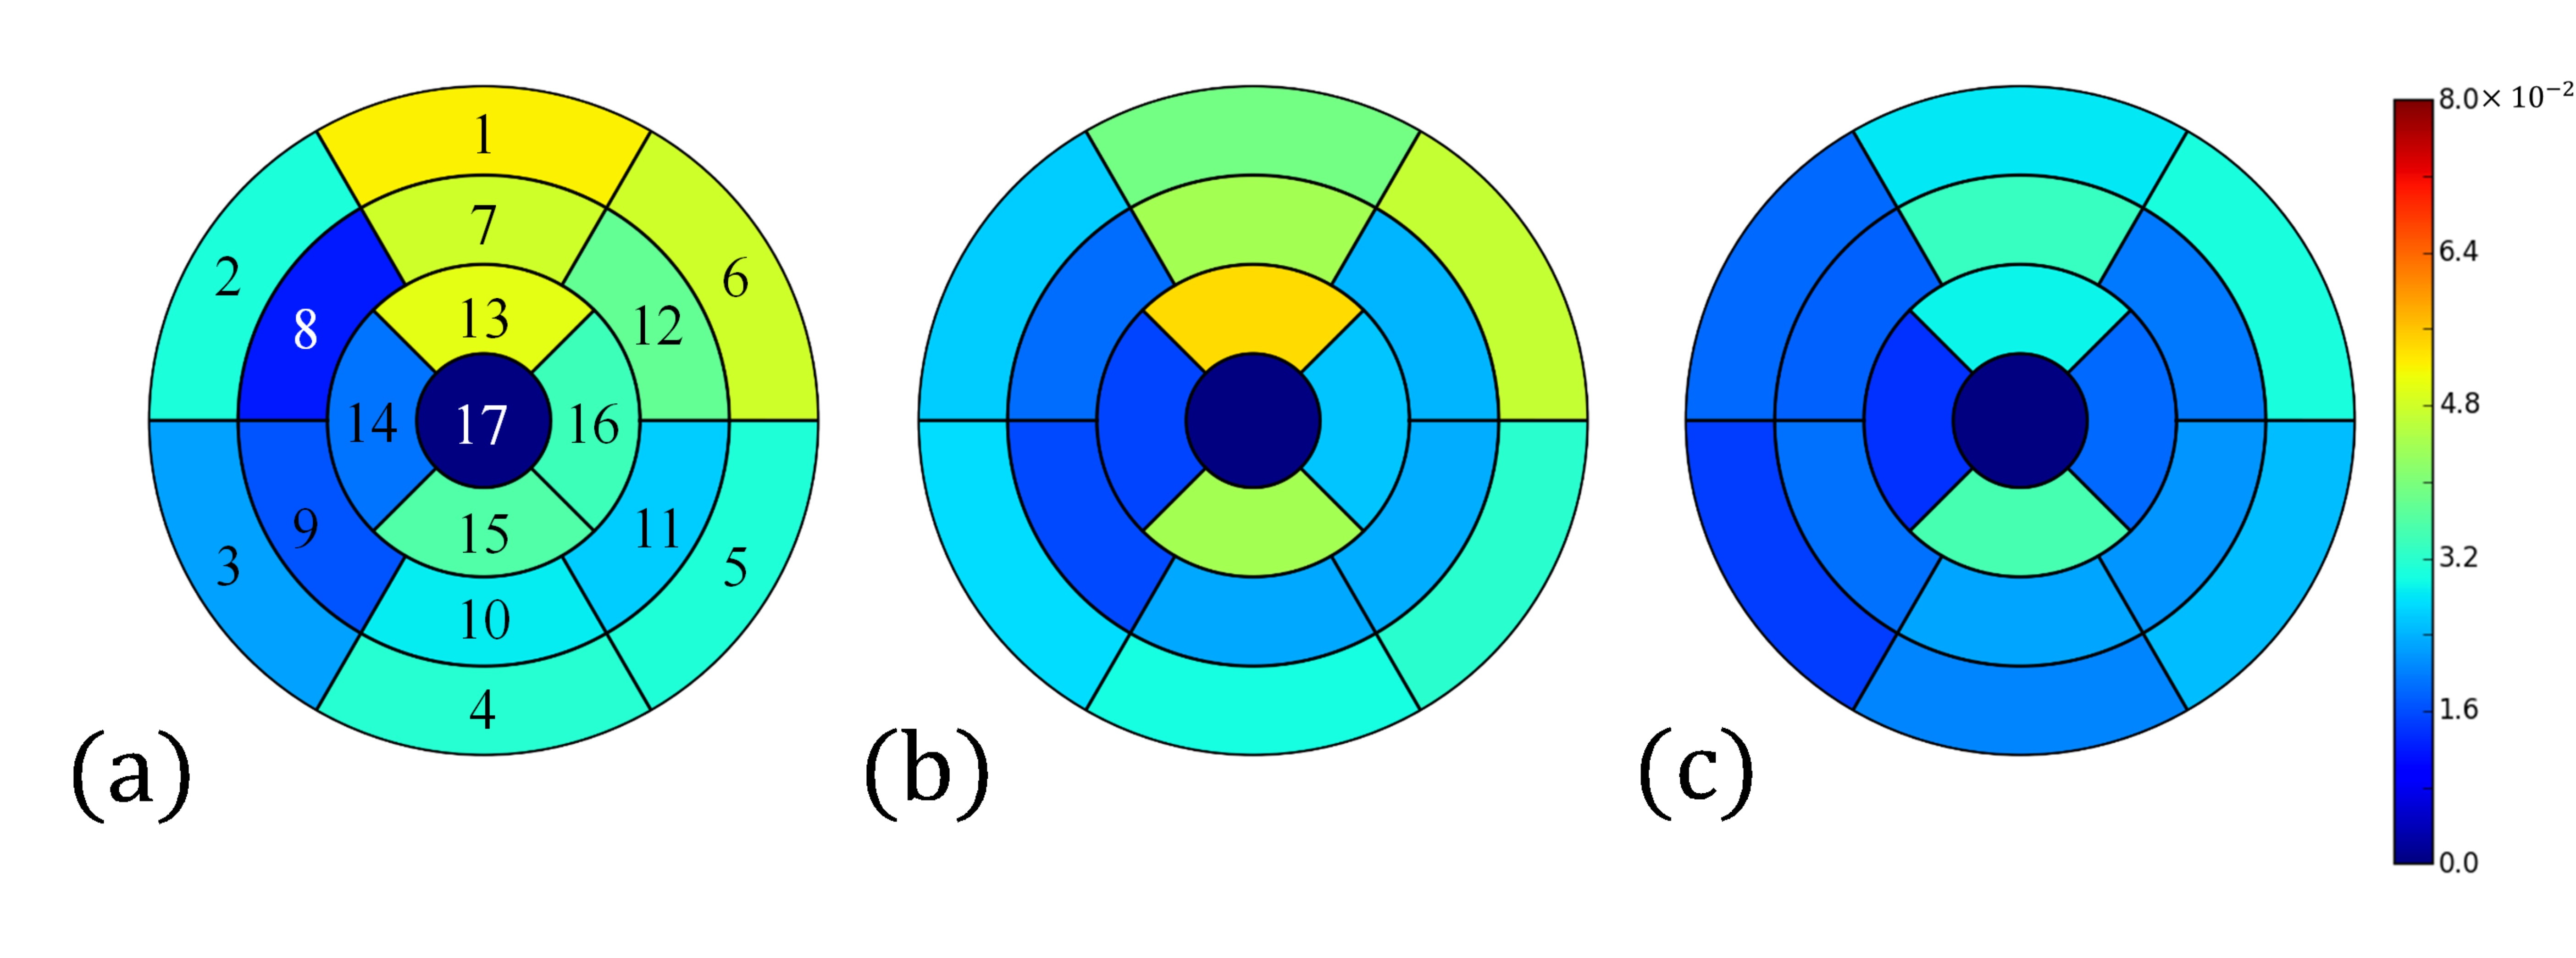
Ten healthy volunteers (10 males, age 22.1 ± 2.47 years) underwent MR imaging with a 3.0T scanner (Siemens, Tim Trio, Germany). The FB-MOLLI sequence2 were performed with the parameters (TR/TE: 2.72/1.3ms, flip angle: 8°, matrix size: 256×208, GRAPPA: 2, slice thickness: 8 mm, three short-axis slices: basal, mid-cavity, apical short axis, FB-MOLLI: 20 inversion times, 3 repeated measurements).The T1 mapping procedure consisted of four steps performed in the Python software environment with the SimpleITK package. The step 1 is to identify a rectangular region covering the heart. We calculated a mean image of the 20 images and applied Otsu thresholding to produce a mask (Fig. 1). The procedure then moved a rectangle region (height and width: 1/4 FOV) across the whole mask and used morphological labeling to identify the objects inside it. The rectangle covering the heart region, outlined by red color in Fig. 1, was selected according to the property of object distribution. The property is, two major objects almost evenly occupied the rectangle. Finally, a rectangular region (height and width: 1/2 FOV) centered at the corner near the centroid of the cardiac region was selected for the further processing. In step 2, we calculated a mean image of the 20 images and used it as a template for the rigid-body image registration. In the step 3, we calculated a T1 map and used the T1 model to synthesized 20 images corresponding to the 20 inversion times of the FB-MOLLI images. We used the synthesized images as templates to perform a deformable image registration (transformation: spline, similarity: mutual information). The inversion times of the “fixed” and “moving” images were the same to match the image contrasts. The step 4 dealt with the uncorrectable factors of the image registration methods, such as in-plane cardiac movement related to respiration or failure of ECG triggering. We selected 15 images from 20 FB-MOLLI images according to a rejecting index2 related to the summation of T1 fitting residuals of each image and reconstructed T1 maps using the selected images. To access the variations of the 3 FB-MOLLI repetitions, we manually selected 16 ROIs from the 3 slices of T1 maps according to the AHA-17 standard, calculated the average T1 values of the ROIs and obtained the standard deviations of the mean T1 values of the three measurements.
Result
The results of the steps in the reconstruction method for FB-MOLLI were demonstrated in Figure 2. Notice that the original cardiac images are not aligned well in the original image because of the respiratory motion. From step 1 to 4, the image alignment of the MOLLI images are progressively better. Figure 3 displays the standard deviations of T1 values derived after different steps (a: step 3, b: step 4, c: step 4) and with different registration methods (a: rigid-body, b: rigid-body, c: deformable) in the step 3. Comparing Figs. 3 (b) and (c) reveals that the variations are significantly reduced in several region (segments: 3, 6, 13, 16; paired t test, p < 0.05, n = 10) when the deformable registration is applied in the step 3.Discussion and Conclusions
This study improved the image reconstruction of FB-MOLLI by the automations of the post-processing procedures and the deformable registration method. Selecting the rectangle covering the cardiac region is the essential step for the image registration of the step 2. The automatic identification of this region leads to unsupervised reconstruction of the FB-MOLLI data sets and therefore extends the clinical applications. In the results, the reduced variations in the final T1 maps supported that the deformable image registration, synthesizing, and selection methods all contribute to greater image alignments and quality of the T1 map. The variations of the repeated T1 measurements were significantly reduced in the anterolateral of the LV walls. The limitation of this study is that the algorithm was only evaluated using the short-axis images. The reconstruction of the long-axis views warrants further investigations. In conclusion, we implemented automatic post-processing procedures and the advanced image registration for FB-MOLLI. The improved FB-MOLLI could be a practical T1 imaging tool for patients who could not perform a voluntary breath-hold.Acknowledgements
Supported by the Ministry of Science and Technology under grants 101-2320-B-011-003-MY3 and 104-2314-B-011-001-MY3References
[1] Messroghli, DR et al. Modified Look-Locker inversion recovery (MOLLI) for high-resolution T1 mapping of the heart. Magn Reson Med. 2004 Jul;52(1):141-6.
[2] Tsai, JM et al. Free-breathing MOLLI: application to myocardial T(1) mapping. Med Phys. 2012 Dec;39(12):7291-302. doi: 10.1118/1.4764915.
Figures