2761
Comparison of SASHA and MOLLI sequences for Iron Quantification in the Myocardium.1Medical Physics Department, Guy's and St Thomas' Hospital, London, United Kingdom, 2Department of Medical Physics and Bioengineering, Division of Imaging Sciences and Biomedical Engineering, King’s College London, London, United Kingdom, 3Philips Healthcare, Surrey, United Kingdom, 4Cardiology Department, King’s College Hospital, United Kingdom, 5Division of Imaging Sciences & Biomedical Engineering, King’s College London, London, United Kingdom, 6Department of Pediatric Cardiology, University of Texas Southwestern, TX, United States
Synopsis
Development of T1 mapping in the myocardium in recent years has demonstrated that the technique can add information to inform the diagnosis or management of patients in a number of pathologies. Sequences have been developed to enable T1 mapping of the myocardium within a single breath-hold and the limitations of these sequences have been well characterized. Recent studies have investigated myocardial T1 mapping in iron overload patients using variants of the MOLLI sequence. These studies have concluded that T1 mapping could be more sensitive and reproducible than T2* mapping for the measurement of iron overload in the myocardium. The current study aims to determine the optimal T1 mapping sequence for iron overload. Simulations, phantom studies and in-vivo studies were carried out to investigate MOLLI and SASHA sequences used for T1 mapping of low T1 and T2 tissues (comparable to iron overload in the myocardium).
Background
Development
of T1 mapping in the myocardium in recent years has demonstrated that the
technique can add information to inform the diagnosis or management of patients
in a number of pathologies. A number of sequences have been developed to enable
T1 mapping of the myocardium within a single breath-hold and the limitations of
these sequences have been well characterized1. Recent studies2-4 have investigated
myocardial T1 mapping in iron overload patients using variants of the Modifed Look-Locker Inversion Recovery (MOLLI) sequence5. These studies have concluded that T1 mapping could be more sensitive
and reproducible than T2* mapping for the measurement of iron overload in the
myocardium.Background
Methods
Methods
Simulations were performed in Matlab (Mathworks, Natick, MA) using Bloch equations. Modulation of longitudinal and transverse magnetisation was simulated using parameters and timings of the MOLLI and Saturation recovery single‐shot acquisition6 (SASHA) sequences. Simulations were performed with T1 and T2 values characteristic of the healthy, moderately iron-loaded and severely iron-loaded myocardium to demonstrate the effect of read-out and short T1/T2 times on measured T1.
A T1 mapping and Extracellular Volume (ECV) Standardisation in CMR (T1MES) phantom7, containing vials with a range of T1 and T2 values comparable to pathologically shortened and lengthened pre and post-contrast blood and myocardium, was scanned on a 1.5T Philips Ingenia with a 32-channel body coil and a simulated heart-rate of 60 bpm. A standard clinical multi-echo TFE T2* mapping sequence, a SASHA) sequence and two MOLLI 5(3)3 sequences (identical except for flip angle: 35° and 50°) were acquired.
MOLLI, SASHA and T2* mapping sequences with the same parameters as for the phantom, were acquired in a mid short-axis left ventricular slice in 7 healthy volunteers and included in routine clinical scans for 10 patients with known or suspected cardiac iron-overload. Each sequence was repeated 3 times in the healthy volunteers to give an estimate of reproducibility.
ROIs were drawn in the centre of the phantom and the septal myocardium for phantom and in-vivo images, respectively. The mean ROI signal intensities were fitted to recovery and decay curves for each sequence using Osirix (Pixmeo, Switzerland) plugins.
Results
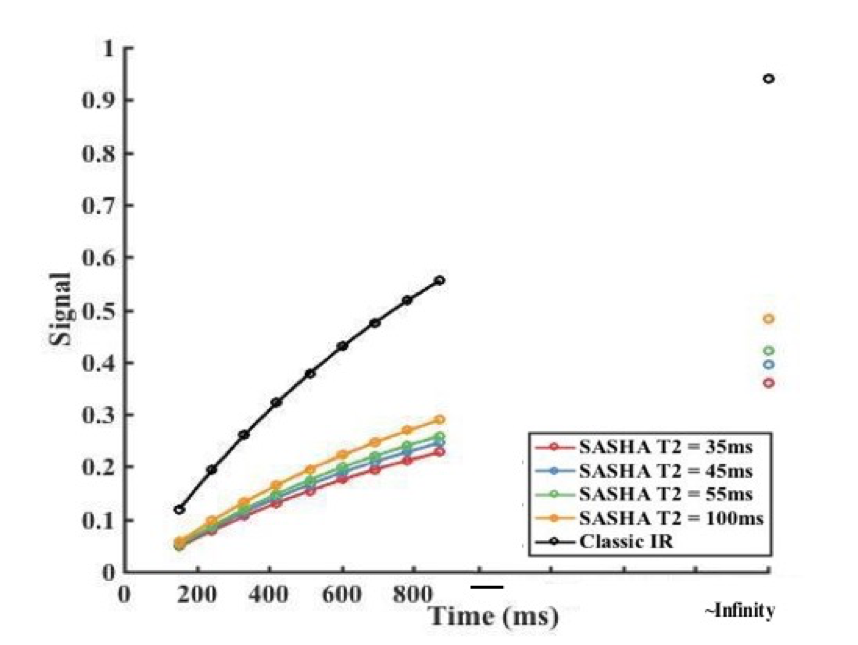
Simulations demonstrated that for MOLLI sequences the signal at maximum TI has a non-linear dependence on T2, suggesting that for very low T2 values the T1 error may become significant, unlike the SASHA sequence which shows a less complex dependence on T2.
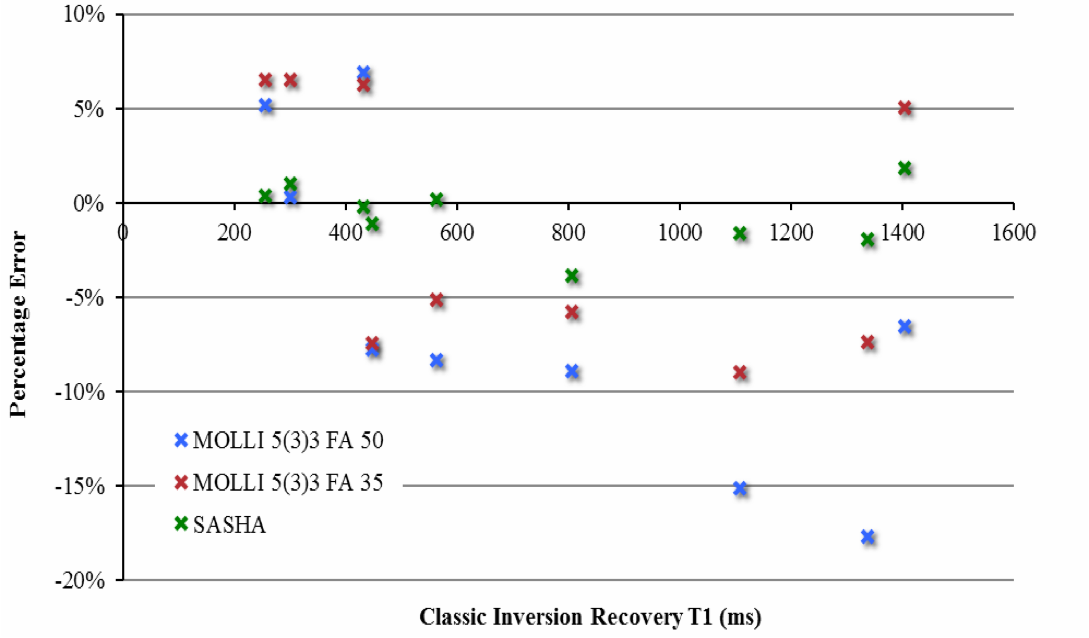
Phantom measurements with the SASHA sequence demonstrated a high absolute accuracy (mean absolute error, 1%) and no significant bias towards under- or over-estimation. A larger absolute error was observed with the MOLLI sequence (mean, 7%), with a bias towards underestimation at T1 values >400ms (mean error, -5%).
Inter-study reproducibility, assessed in healthy volunteers, was found to be comparable between T1 mapping sequences (CoV = 1-2.1%), as was inter-subject variation (CoV = 2.6-3.8%).
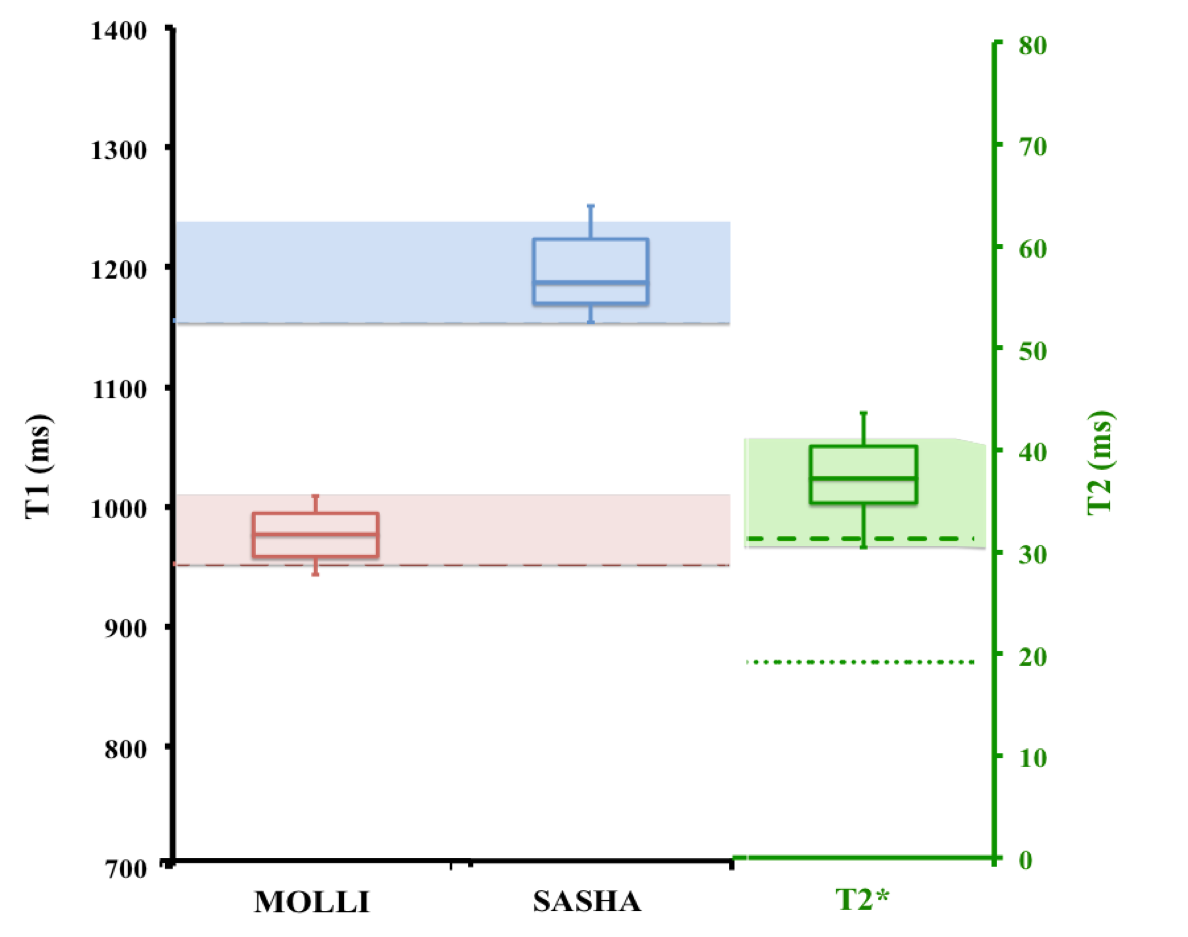
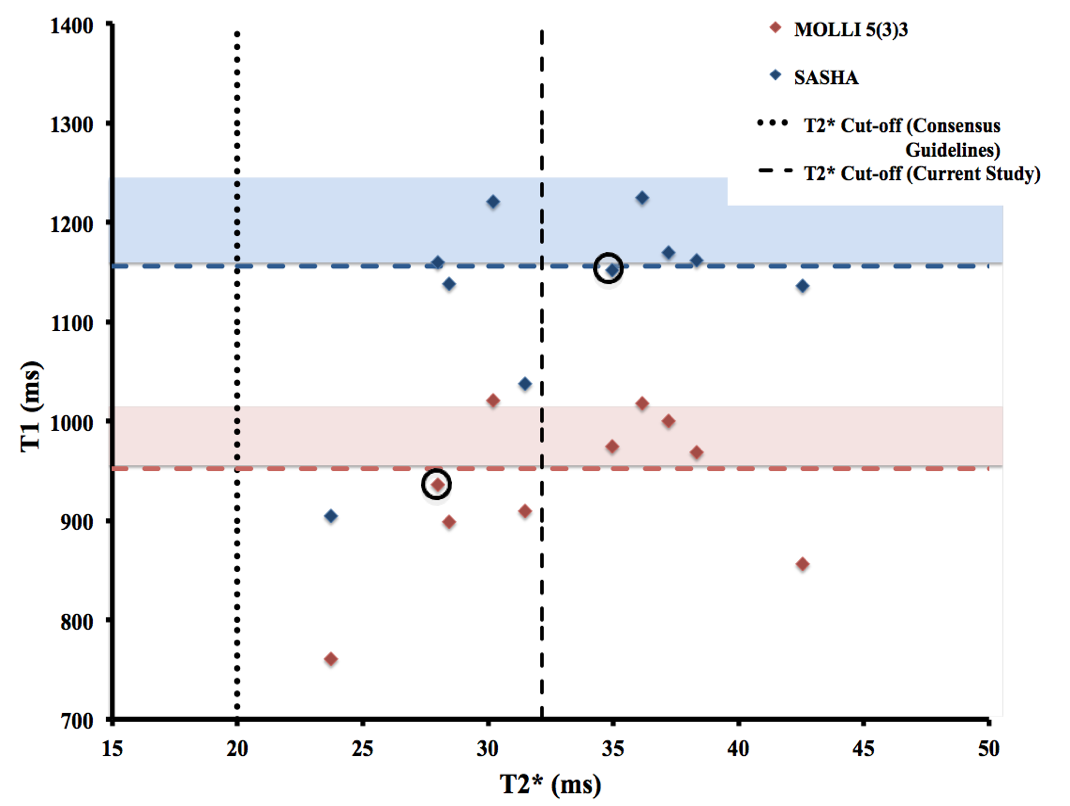
The number of patients with a low T1, assessed as significantly lower (p<0.05) than healthy volunteer measurements was identical for SASHA and MOLLI sequences (4/10 patients).
Discussion
While the increased sensitivity of the MOLLI sequence due to factors introducing a T1-shortening bias could have merit in the assessment of iron-overload in the myocardium, the increased T1-shortening due to cofounding factors other than presence of iron (e.g. intra- myocardial fat) may result in incorrect interpretation of the measurement. Furthermore, the sensitivity may be decreased due to magnetisation transfer effects in this particular patient group. The SASHA sequence has been shown to improve T1 measurement accuracy in comparison to the MOLLI sequence. This method allows for a more independent measure of T1 in iron-overload patients, which is less affected by factors other than spin-lattice relaxation effects. Therefore this sequence may prove to give a better assessment of iron- overload than the MOLLI sequence.Acknowledgements
No acknowledgement found.References
1. Kellman P and M S Hansen, T1-mapping in the heart: accuracy and precision. J Cardiovasc Magn Reson, 2014;16(2):7.
2. Sado DM, Maestrini V, Piechnik SK, et al. Noncontrast myocardial T1 mapping using cardiovascular magnetic resonance for iron overload. Journal of Magnetic Resonance Imaging, 2015;41(6):1505-1511.
3. Alam MH, Auger D, Smith GC, et al. T1 at 1.5T and 3T compared with conventional T2* at 1.5T for cardiac siderosis. J Cardiovasc Magn Reson, 2015;17(1):102.
4. Feng Y, He T, Carpenter JP, et al. In vivo comparison of myocardial T1 with T2 and T2* in thalassaemia major. J Magn Reson Imaging, 2013;38(3):588-93.
5. Messroghli DR, Radjenovic A, Kozerke S, et al. Modified Look-Locker inversion recovery (MOLLI) for high-resolution T1 mapping of the heart. Magn Reson Med, 2004;52(1):141-6.
6. Chow K, Flewitt JA, Green JD, et al. Saturation recovery single-shot acquisition (SASHA) for myocardial T1 mapping. Magnetic resonance in medicine, 2014;71(6):2082-2095.
7. Captur G, Gatehouse P, Kellman P, et al. A T1 and ECV phantom for global T1 mapping quality assurance: the T1 Mapping and ECV Standardisation in CMR (T1MES) program. J Cardiovasc Magn Reson. 2016;18:1–3.
Figures