2759
3D High Frequency Cardiac Magnetic Resonance Elastography Quantitatively Differentiates Myocardial Stiffness in Patients with HFPEF and Healthy Volunteers1Radiology, Mayo Clinic, Rochester, MN, United States, 2Cardiovascular Diseases, Mayo Clinic, 3Biomedical Engineering and Physiology, Mayo Clinic
Synopsis
Increased myocardial stiffness in patients with heart failure with preserved ejection fraction (HFpEF) is known to affect diastolic filling. The purpose of this work was to determine if 3D high frequency cardiac MR elastography (MRE) can quantitatively differentiate increased myocardial stiffness in HFpEF patients compared to healthy volunteers. Two patients with clinical diagnosis for HFpEF and 47 healthy volunteers were studied. The myocardial stiffness of HFpEF patients (mean: 10.57 kPa) was found to be significantly stiffer (p < 0.05) than healthy controls (mean: 7.79 kPa). Recruitment of more HFpEF patients is underway for further validation of this finding.
Purpose
Myocardial stiffness is a novel biomarker that plays a significant role in the LV pump function (1). In patients with heart failure with preserved ejection fraction (HFpEF) the increased myocardial stiffness impairs diastolic filling leading to heart failure symptoms (2). HFpEF accounts for about 50% of incident heart failure cases (3) with a miserable 30% one year mortality (4), and increases the health care burden overall with poor prognosis and diagnosis metrics for HFpEF (5). Currently, the clinical criteria for HFpEF diagnosis rely on a complex invasive catheterization procedure which is not a robust and a quantifiable metric for accurate clinical decision making (6). Magnetic Resonance Elastography (MRE) is a non-invasive phase contrast based imaging technique that can measure tissue stiffness in-vivo (7). Currently 3D MRE is becoming increasingly common and our recent work demonstrated a high level of agreement with dynamic material testing (intra-class correlation coefficient up to 0.99) (8). 3D high frequency cardiac MRE at 140 Hz was recently shown to be feasible in normal volunteers to measure in-vivo myocardial stiffness (9). The purpose of this work was to determine if 3D high frequency cardiac MRE can quantitatively differentiate increased myocardial stiffness in HFpEF patients compared to healthy volunteers.Methods
Two patients (ages 65 and 79, both females) with clinical diagnosis for HFpEF and 47 healthy volunteers (Male = 20; Female = 27) between ages 18-35 were enrolled with institutional review board (IRB) approval and informed consent was obtained from all the participants. Cardiac MRE was performed at 140 Hz vibration frequency as previously described (12). The MRE exam also included a “no-motion” scan with the vibration amplitude set to zero in order to establish a baseline reference for noise to differentiate scans with motion. Shear wave quality was assessed by calculating the octahedral shear strain signal to noise ratio (OSS-SNR) (10) . A noise threshold was established at two standard deviations above the mean OSS-SNR of all no-motion scans across all participants. A successful MRE exam is expected to have mean OSS-SNR in the included myocardial volume greater than this threshold. The left ventricle (LV) was segmented using Cir 42 clinical software (Cardiovascular Imaging, Calgary, Alberta) to quantify left ventricular myocardial stiffness. MRE stiffness was obtained by applying curl to the 3D displacement field and performing 3D Local Frequency Estimation (LFE) (11). MRE shear stiffness is reported as the mean stiffness in the segmented LV volume. OriginPro 2016 software (OriginLab Corporation, Northampton, MA) was used for statistical analysis and plotting. The Mann-Whitney U test of significance was used in this study by considering a p-value of less than 0.05 as statistically significant.Results
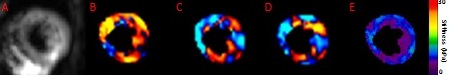
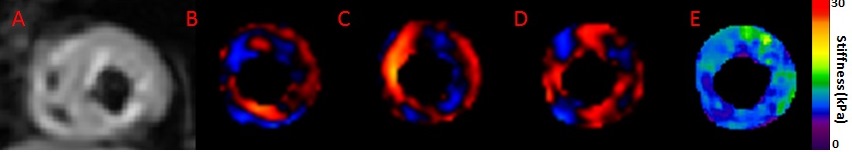
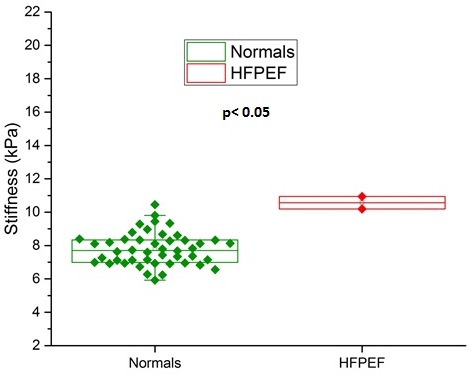
A threshold OSS-SNR value of 1.10 (two standard deviations above the mean of 0.82) was used as a shear wave quality factor to discriminate noisy MRE exams. All subjects had a mean OSS-SNR higher than this threshold except for one volunteer who was excluded from analysis in this study. Figure 1 shows the MRE images from a 22 year old healthy volunteer, (A) shows the magnitude image, (B), (C), (D) show the X, Y and Z-component of the curled images and (E) shows the corresponding elastogram. Similarly, Figure 2 shows the MRE images from a 65 year old female HFPEF patient. Figure 3 shows a box plot of MRE shear stiffness between normal volunteers and the two HFpEF patients. The LV myocardial stiffness of the two HFpEF patients (mean: 10.57 kPa, was significantly higher (p < 0.05) than the LV myocardial stiffness of 46 normal healthy volunteers (mean: 7.79 kPa (Figure 3).Discussion and Conclusions
The results from this study demonstrates the feasibility of 3D high-frequency cardiac MRE to quantitatively differentiate the increased myocardial stiffness in patients with HFpEF from normal volunteers. The myocardial stiffness of HFpEF patients (mean 10.57 kPa) was found to be significantly stiffer (p < 0.05) than healthy volunteers (mean: 7.79 kPa). These results motivate further validation of this finding in a larger HFpEF patient cohort.Acknowledgements
This work was supported by National Institutes of Health (NIH) grants 5R01HL115144 and EB001981 and Mayo Clinic Department of Radiology internal fundReferences
1. Holmes JW, Borg TK, Covell JW. Structure and mechanics of healing myocardial infarcts. Annual review of biomedical engineering 2005;7:223-253.
2. Zile MR, Baicu CF, Gaasch WH. Diastolic heart failure--abnormalities in active relaxation and passive stiffness of the left ventricle. The New England journal of medicine 2004;350(19):1953-1959.
3. Go, A.S., et al., Executive summary: heart disease and stroke statistics--2014 update: a report from the American Heart Association. Circulation, 2014. 129(3): p. 399-410.
4. Ferrari, R., et al., Heart failure with preserved ejection fraction: uncertainties and dilemmas. Eur J Heart Fail, 2015. 17(7): p. 665-71.
5. Braunwald, E., Heart failure. JACC Heart Fail, 2013. 1(1): p. 1-20.
6. Paulus, W.J., et al., How to diagnose diastolic heart failure: a consensus statement on the diagnosis of heart failure with normal left ventricular ejection fraction by the Heart Failure and Echocardiography Associations of the European Society of Cardiology. Eur Heart J, 2007.
7. Muthupillai, R., Lomas, D.J., Rossman, P.J. and Greenleaf, J.F., 1995. Magnetic resonance elastography by direct visualization of propagating acoustic strain waves. Science, 269(5232), p.1854.
8. Arunachalam SP, Rossman PJ, Arani A, Lake DS, Glaser KJ, Trzasko JD, Manduca A, McGee KP, Ehman RL, Araoz PA. Quantitative 3D magnetic resonance elastography: Comparison with dynamic mechanical analysis. Magnetic resonance in medicine : official journal of the Society of Magnetic Resonance in Medicine / Society of Magnetic Resonance in Medicine 2016.
9. Arani A, Glaser KL, Arunachalam SP, Rossman PJ, Lake DS, Trzasko JD, Manduca A, McGee KP, Ehman RL, Araoz PA. In vivo, high-frequency three-dimensional cardiac MR elastography: Feasibility in normal volunteers. Magnetic resonance in medicine : official journal of the Society of Magnetic Resonance in Medicine / Society of Magnetic Resonance in Medicine 2016.
10. McGarry MD, Van Houten EE, Perrinez PR, Pattison AJ, Weaver JB, Paulsen KD. An octahedral shear strain-based measure of SNR for 3D MR elastography. Physics in medicine and biology 2011;56(13):N153-164.
11. Manduca A, Muthupillai, R., Rossman, P. J., Greenleaf, J. F., & Ehman, R. L. . Local wavelength estimation for magnetic resonance elastography. In Image Processing, 1996 Proceedings, International Conference on 1996;3:527-530.
Figures