2756
SMART1Map: Accuracy and Influencing Imaging Parameters For Cardiac T1 Mapping.Malek I MAKKI1,2, Barbara EU Burkhardt3, and Emanuela Valsangiacomo3
1MRI Research, University Children Hospital, Zurich, Switzerland, 2BioFlow, University Picardie Jules Verne, Amiens, France, 3Cardiology, University Children Hospital, Zurich, Switzerland
Synopsis
SMART1Map sequence was performed on 6 phantoms with different T1 values. Sixteen schemes were prescribed: 4 heart rates (60, 80, 100, 120 bpm), 2 spatial resolutions (FOV = 30 cm and FOV = 48 cm) and 2 cardiac phases (systole and diastole). The results show that SMART1Map underestimates long T1 (native T1 myocardium) at any scheme. We also found an increase in error with reduced FOV (all other parameters being identical), and an influence of the cardiac phases on T1 at the levels of native and post-contrast blood and myocardium
Introduction
SMART1Map (Saturation Method using Adaptive Recovery Times for cardiac T1 Mapping) is a single-point saturation-recovery balanced SSFP technique [1] that directly measures true T1. Native T1 changes reflect myocardial pathologies related to excess of deposition of T1-altering substances, including water, protein, lipid, or iron [2]. The extracellular volume (ECV) can be calculated from T1 values and is a frequently used parameter to estimate the degree of myocardial alteration [3]. The accuracy of T1-mapping have been reported for different T1 values [4]. No study has investigated the influence of imaging parameters on these measures. This study aimed to assess the accuracy of SMART1Map by using different acquisition parameters (spatial resolution, heart rate, time delay), and to describe their influence on the measured T1 values.Material and Methods
Six phantoms (P0, P1, P2, P3, P4, P5, 500 mL each) were filled with water plus a dose of Gadolinium (0.5 mmol/mL) at respectively 0.0, 0.1, 0.2, 0.3, 0.4, 0.5 mL. All images were acquired on a GE450W 1.5T scanner and 32 channel cardiac coil. The T1 values were measured using standard FSE-IR and 35 different TI values (range 100 ms to 2500ms) by fitting the curve [SI vs TI, T1= TI/Ln(2)]. The imaging parameters were axial slice (isocenter), thickness 8 mm, TR = 15000ms, 16 ETL (180°), Xres=192, Yres=128, pFOV=75%. In addition, ten SMART1Map measurements were performed (time interval between 2 consecutive exams ranges from 1 day to 1 week). The imaging parameters matched the FSE-IR: axial image, 8mm thickness, flip angle 65°, Xres = 192, Yres=128, BW=100 kHz, pFOV=75%, TE = min full (1.4 ms). Accuracy and reproducibility were tested with 16 different acquisition schemes: Two time delays (systole and diastole), two spatial resolutions (FOV= 30 and 48 cm), and 4 different heart rates (60, 80, 100, and 120 bpm). The saturation-recovery curve-fits for SMART1Map were carried out using Medis software (Leiden, the Netherlands).Results
The reference T1 values (FSE-IR) of the phantoms ranged between 2550 ms for pure water (P0, no Gd), and 376 ms for P5 = 500 mL water + 0.5 mL Gd (Table 1). Inter-sequence comparison proved that at short T1 (range 750, ±17 to 376±7; P2-P5) SMART1Map measures accurate and reproducible values at any heart rate, FOV or cardiac-phase. . In contrast for long T1 (2550 ± 50 ms, and 1350 ± 40 ms for P1), SMART1Map systematically underestimates the T1 values (respectively 1985 ± 73 ms and 1240 ± 21 ms) regardless of the heart rate (60, 80, 100, 120 bpm), spatial resolution (FOV=30 or 48 cm), or cardiac phases (systole, diastole). Whisker curves analysis (Figure 1) shows that SMART1Map results matches quite well with myocardium native (T1 = 1350ms) and post contrast (T1 = 376 ms). Calculation of the standard errors of mean (SEM) demonstrated an important influence of the spatial resolution on the accuracy of the T1 measurements on all phantoms, regardless of the cardiac phases and the heart rate (Figure 2). For a smaller FOV (30 vs 48 cm, all other parameters equal) increases the T1 SEM values, on average, from 26ms to 39ms at long T1 = 1240 ms (pre contrast), and from 7 ms to 15 ms at short T1 = 376ms (post contrast). In addition, the acquisition phase (diastole vs systole) influences the accuracy of the T1 measurements. At short T1 (post-contrast), the SEM is smaller in diastole than in systole, all other parameters equal. (Figure 3). At long T1 (native values), the SEM is smaller in systole than in diastole. Heart rate has no influence on the accuracy of the SMART1Map measures.Discussion and Conclusion
The reported normal pre and post contrast T1 values of the myocardium at 1.5T are around 1100 ms and 300 ms, respectively. We demonstrated that SMART1Map provides accurate measures of post-contrast T1 of the myocardium, but it systematically underestimates native pre-contrast T1 values (5 to 10%). These errors can be reduced by prescribing larger FOV and acquiring pre-contrast images during systole and post-contrast images during diastole. Although the effect of these under-estimations is lower on the ECV values (due to the ratio myocardium T1 / blood T1), performing SMART1Map using optimized imaging parameters improves the accuracy of T1-mapping and may lead to improved clinical diagnosis of disease severity.Acknowledgements
No acknowledgement found.References
[1] Slavin, Proc. ISMRM, (2012), p.1244.
[2] Riesenkampff et al., Circ Cardiovasc Imaging. (2015).
[3] Moon et al., JCMR, (2013).
[4] Kellman and Hansen JCMR, (2014)
Figures
Table 1:
Reference T1 values obtained by standard FSE-IR fitting on the phantoms that
contains W=500 mL water and different doses of Gd (0.5 mmol/mL) and the
corresponding values obtained by fitting the saturation recovery curves from SMART1Map.
The values, mean ± standard deviation,
DT, and %T1,
are provided in average for the 16 schemes that include 2 FOV values (30 and 48
cm), 4 heart rates (60, 80, 100, and 120 bpm),
and 2 time-delay i.e. systole and diastole. SEM = standard-errors-means
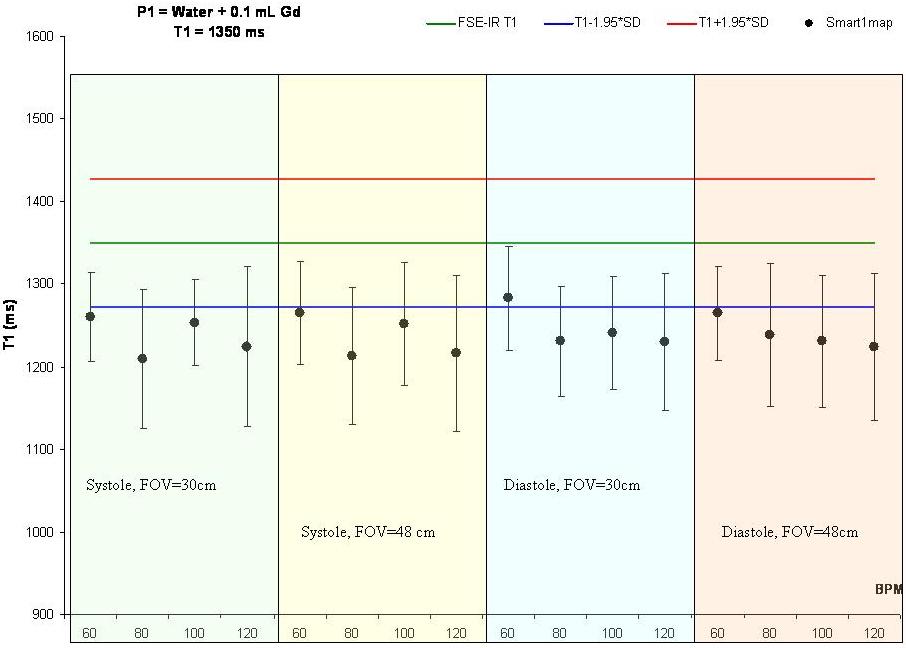
Figure 1: Whisker
graphs of long T1 measured by FSE-IR that represents
native T1 of the myocardium). The corresponding results obtained by SMART1Map
at different heart rates (60, 80, 100,
120 bpm), FOV (30 and 48 cm), and cardiac phases (systole and diastole) show
lower values at long T1.
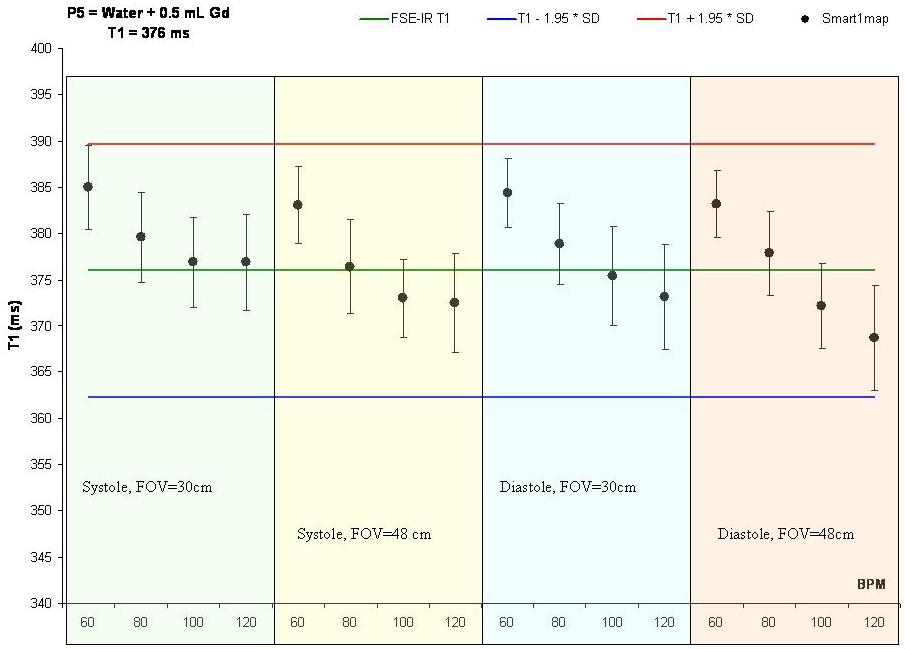
Figure 2: Whisker
graphs of short T1 measured by FSE-IR (represents the post-contrast T1 of the myocardium). The corresponding results obtained by SMART1Map
at different heart rates (60, 80, 100,
120 bpm), FOV (30 and 48 cm), and cardiac phases (systole and diastole) show matching values.
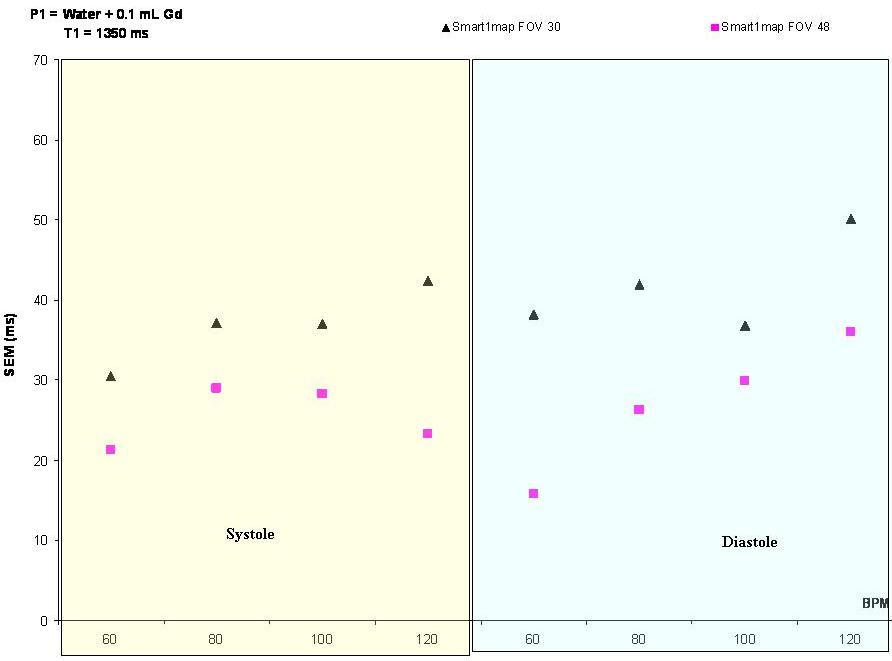
Figure 3: Standard-errors-means
shows that the errors are greater when reducing the FOV (from 48 cm to 30 cm) both
at systole and diastole and at any heart-rate (60,
80, 100 and 120) either with long or short T1.
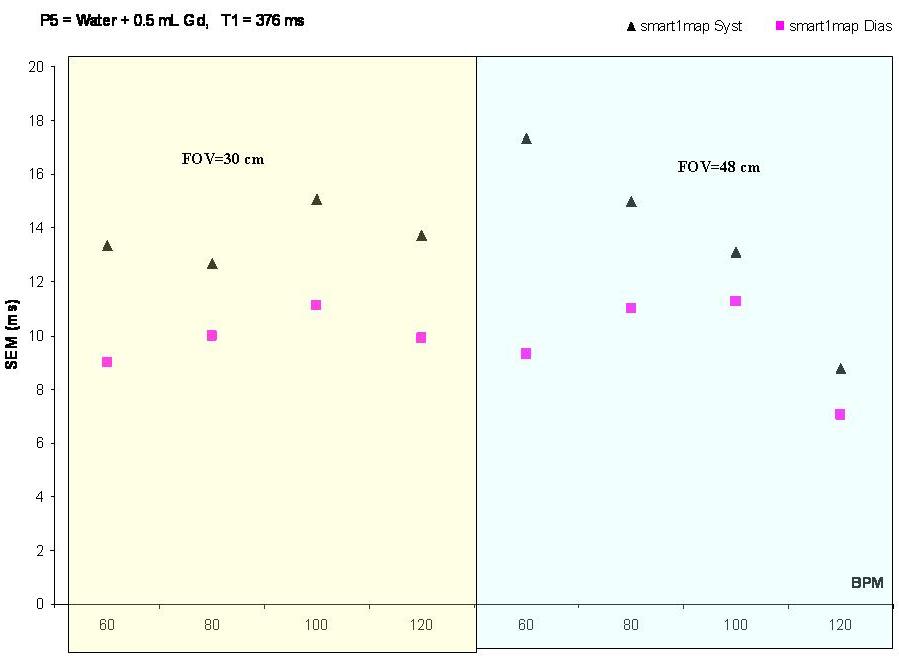
Figure 4: Standard-errors-means
calculation shows that the errors are greater when acquiring pre-contrast
SMART1Map images during diastole. In the opposite, the errors are greater if we acquire post-contrast
images in the diastolic phases. This seems to be the case for all heart-rates (60,
80, 100,
and 120 bpm) and both FOV values (30 and 48 cm).