2755
The Correlation of Clinical and Image of Acromegaly Patients Based on 3.0T Cardiac Magnetic Resonance Quantitative Analysis of Myocardial T1 and Extracellular Volume1Radiology, PUMCH, Beijing, People's Republic of China, 2Neurology, PUMCH, 3MR Collaborations NE Asia, Siemens Healthcare
Synopsis
The aim of this study was to find out if there might be some correlation between clinical information and image measurements for acromegaly patients. And it found that for acromegaly patients, the basal slice of heart might be the most involvemented position, and its contractility had a positive correlation with GH burden, and both T1 and ECV had a negative correlation with IGF-1. And we need to enlarge the sample size and compare the changes before and after the surgery in order to give more informations to the clinicians.
Purpose
Acromegaly results from persistent hypersecretion of growth hormone (GH). Excess GH stimulates hepatic secretion of insulin-like growth factor 1 (IGF-1), which causes most of the clinical manifestations of acromegaly [1]. Cardiovascular involvement is the most common and severe complication of acromegaly, and is the leading cause of death in patients with acromegaly [2]. Cardiac magnetic resonance (CMR) T1mapping and extracellular volume (ECV) measurements might have advantages over routine sequences for early diagnosis and quantification of cardiac involvements. The aim of this study was to find out if there might be some correlation between clinical information (GH, IGF-1…) and image measurements (T1 and ECV…) for acromegaly patients.
Methods
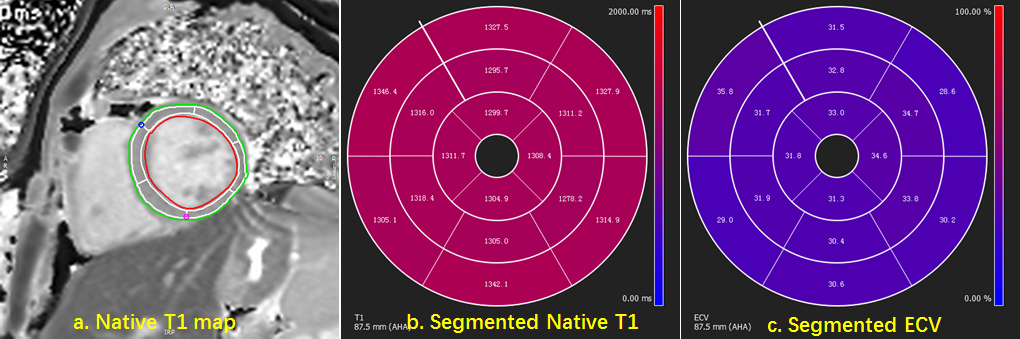
The study received local ethical approval and all patients gave written informed consent. The included patients diagnosed of acromegaly with biochemical (GH, IGF-1) and imaging examination (pituitary MRI) confirmed. The clinical information of each patient included age, height , weight, BMI, HR, course , serum concentration of GH and IGF-1, burden of GH (GH*course) and IGF-1 (IGF-1*course). Image data were collected on a MAGNETOM Skyra 3T MR scanner (Siemens Healthcare, Erlangen, Germany). All the patients underwent a standardized bolus contrast-enhanced CMR imaging including native and 15-20min post-contrast T1 mapping (modified Look-Lockers inversion recovery sequence) imaging in identical short axis 2-chamber slices of basal, middle and apical LV level. Segmented native T1 mapping and ECV quantification base on American heart association (AHA) 16-segments model were accomplished semi-automatically using CVI42 software (Circle Cardiovascular Imaging, Canada), and the mean value of segments 1-6, 7-12 and 13-16 represent the values of the basal, mid and apex slice, separately. The image measurements included LVEDV, LVESV, LVEF, wall thickness at ED and ES, myocardial contractility, mass at ED, In-mass, T1 and ECV. The correlations between these variates were compared with Pearson correlation analysis. Native T1 and ECV of separate slices were paired and compared by ANOVA analysis.Results
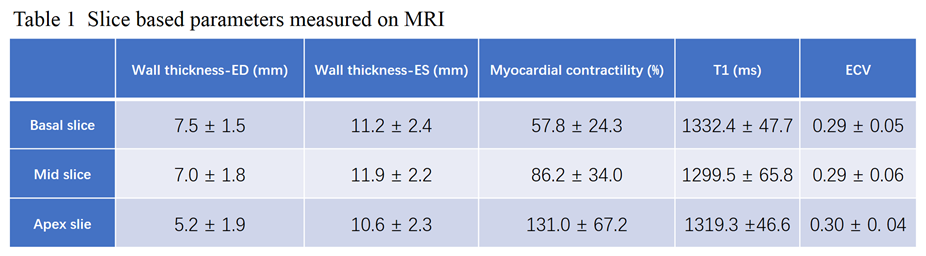
The study recruited 17 patients (mean age 45±18 years, 8 men). The results of clinical information were as follows: age 44.8 ± 18.4 y, height 1.69 ± 0.09 m, weight 73.8 ± 11.7 kg, BMI 25.6 ± 2.4 kg/㎡, HR 69 ± 9 beats/min, course 82 ± 64 m, GH 37.7 ± 40.8 ng/mL, GH burden 2277.0 ± 2127.0 ng/mL*m, IGF-1 937.4 ± 309.1 ng/mL, and GH burden 78609.9 ± 67176.4 ng/mL*m. The results of image measurements were as follows: LVEDV 161.0 ± 29.4 mL, LVECV 66.5 ± 30.3 mL, LVEF 59.7 ± 9.6 %, mass at ED 103.28 ± 34.9 g, In-mass 55.1 ± 15.7 g/ ㎡, and the other slice based results were shown in the table 1. And Pearson correlation analysis showed that myocardial contractility at basal slice had a positive correlation with GH burden (r=0.531, p= 0.028), and IGF-1 had a negative correlation with T1 of basal slice (r=-0.671, p= 0.003), ECV of basal slice (r=-0.622, p= 0.013) and ECV of apex slice (r=-0.664, p= 0.007). Average per-slice Native T1 (1332.4 ± 47.7ms vs. 1299.5 ± 65.8ms vs. 1319.3 ±46.6ms) and ECV (0.29±0.05 vs. 0.29±0.06 vs. 0.30±0. 04) showed no significant differences among basal, middle and apical LV level.Conclusions
For acromegaly patients, the basal slice of heart might be the most involvemented position, even the per-slice average native T1 and ECV showed no difference among basal, middle and apical LV level. Its contractility had a positive correlation with GH burden, and both T1 and ECV had a negative correlation with IGF-1.Acknowledgements
Thanks to Yuehua Hu,who is a employee of Chinese Center for Disease Control and Prevention(China CDC), helped us for the data analysis.
References
[1] Challenges in the diagnosis and management of acromegaly: a focus on comorbidities [J]. Pituitary, 2016, 19(4): 448-457.
[2] A consensus on the diagnosis and treatment of acromegaly complications [J]. Pituitary, 2013, 16(3): 294-302.
Figures