2752
Single Breath-hold Measurement of T2 Corrected Myocardial Proton Density Fat Fraction in Humans at 3T1BMIB, NIDDK, Bethesda, MD, United States, 2Metabolic Unit, NIDDK, MD, United States
Synopsis
Localized 1H-MRS was used to determine T2s for water and lipid signals in the human heart in a single breath hold and derive relaxation corrected proton density fat fractions.
PURPOSE
Most MRS methods for quantification of cardiac lipid content do not account for differences in relaxation rates between water and fat or biological variations in the relaxation rates. Single breath-hold multi echo MRI methods recorded with enough echo times may yield enough time points per pixel for fitting T2* of water and fat, but the T2 can only be obtained from multiple spin-echoes. Using 1H-MRS T2 were determined for water and lipid signals in the human heart to derive relaxation corrected proton density fat fractions (PDFF). The T2s of water and fat human myocardium can provide a basis for models to be used in MRI water-fat mapping methods with iterative fitting of proton densities.METHODS
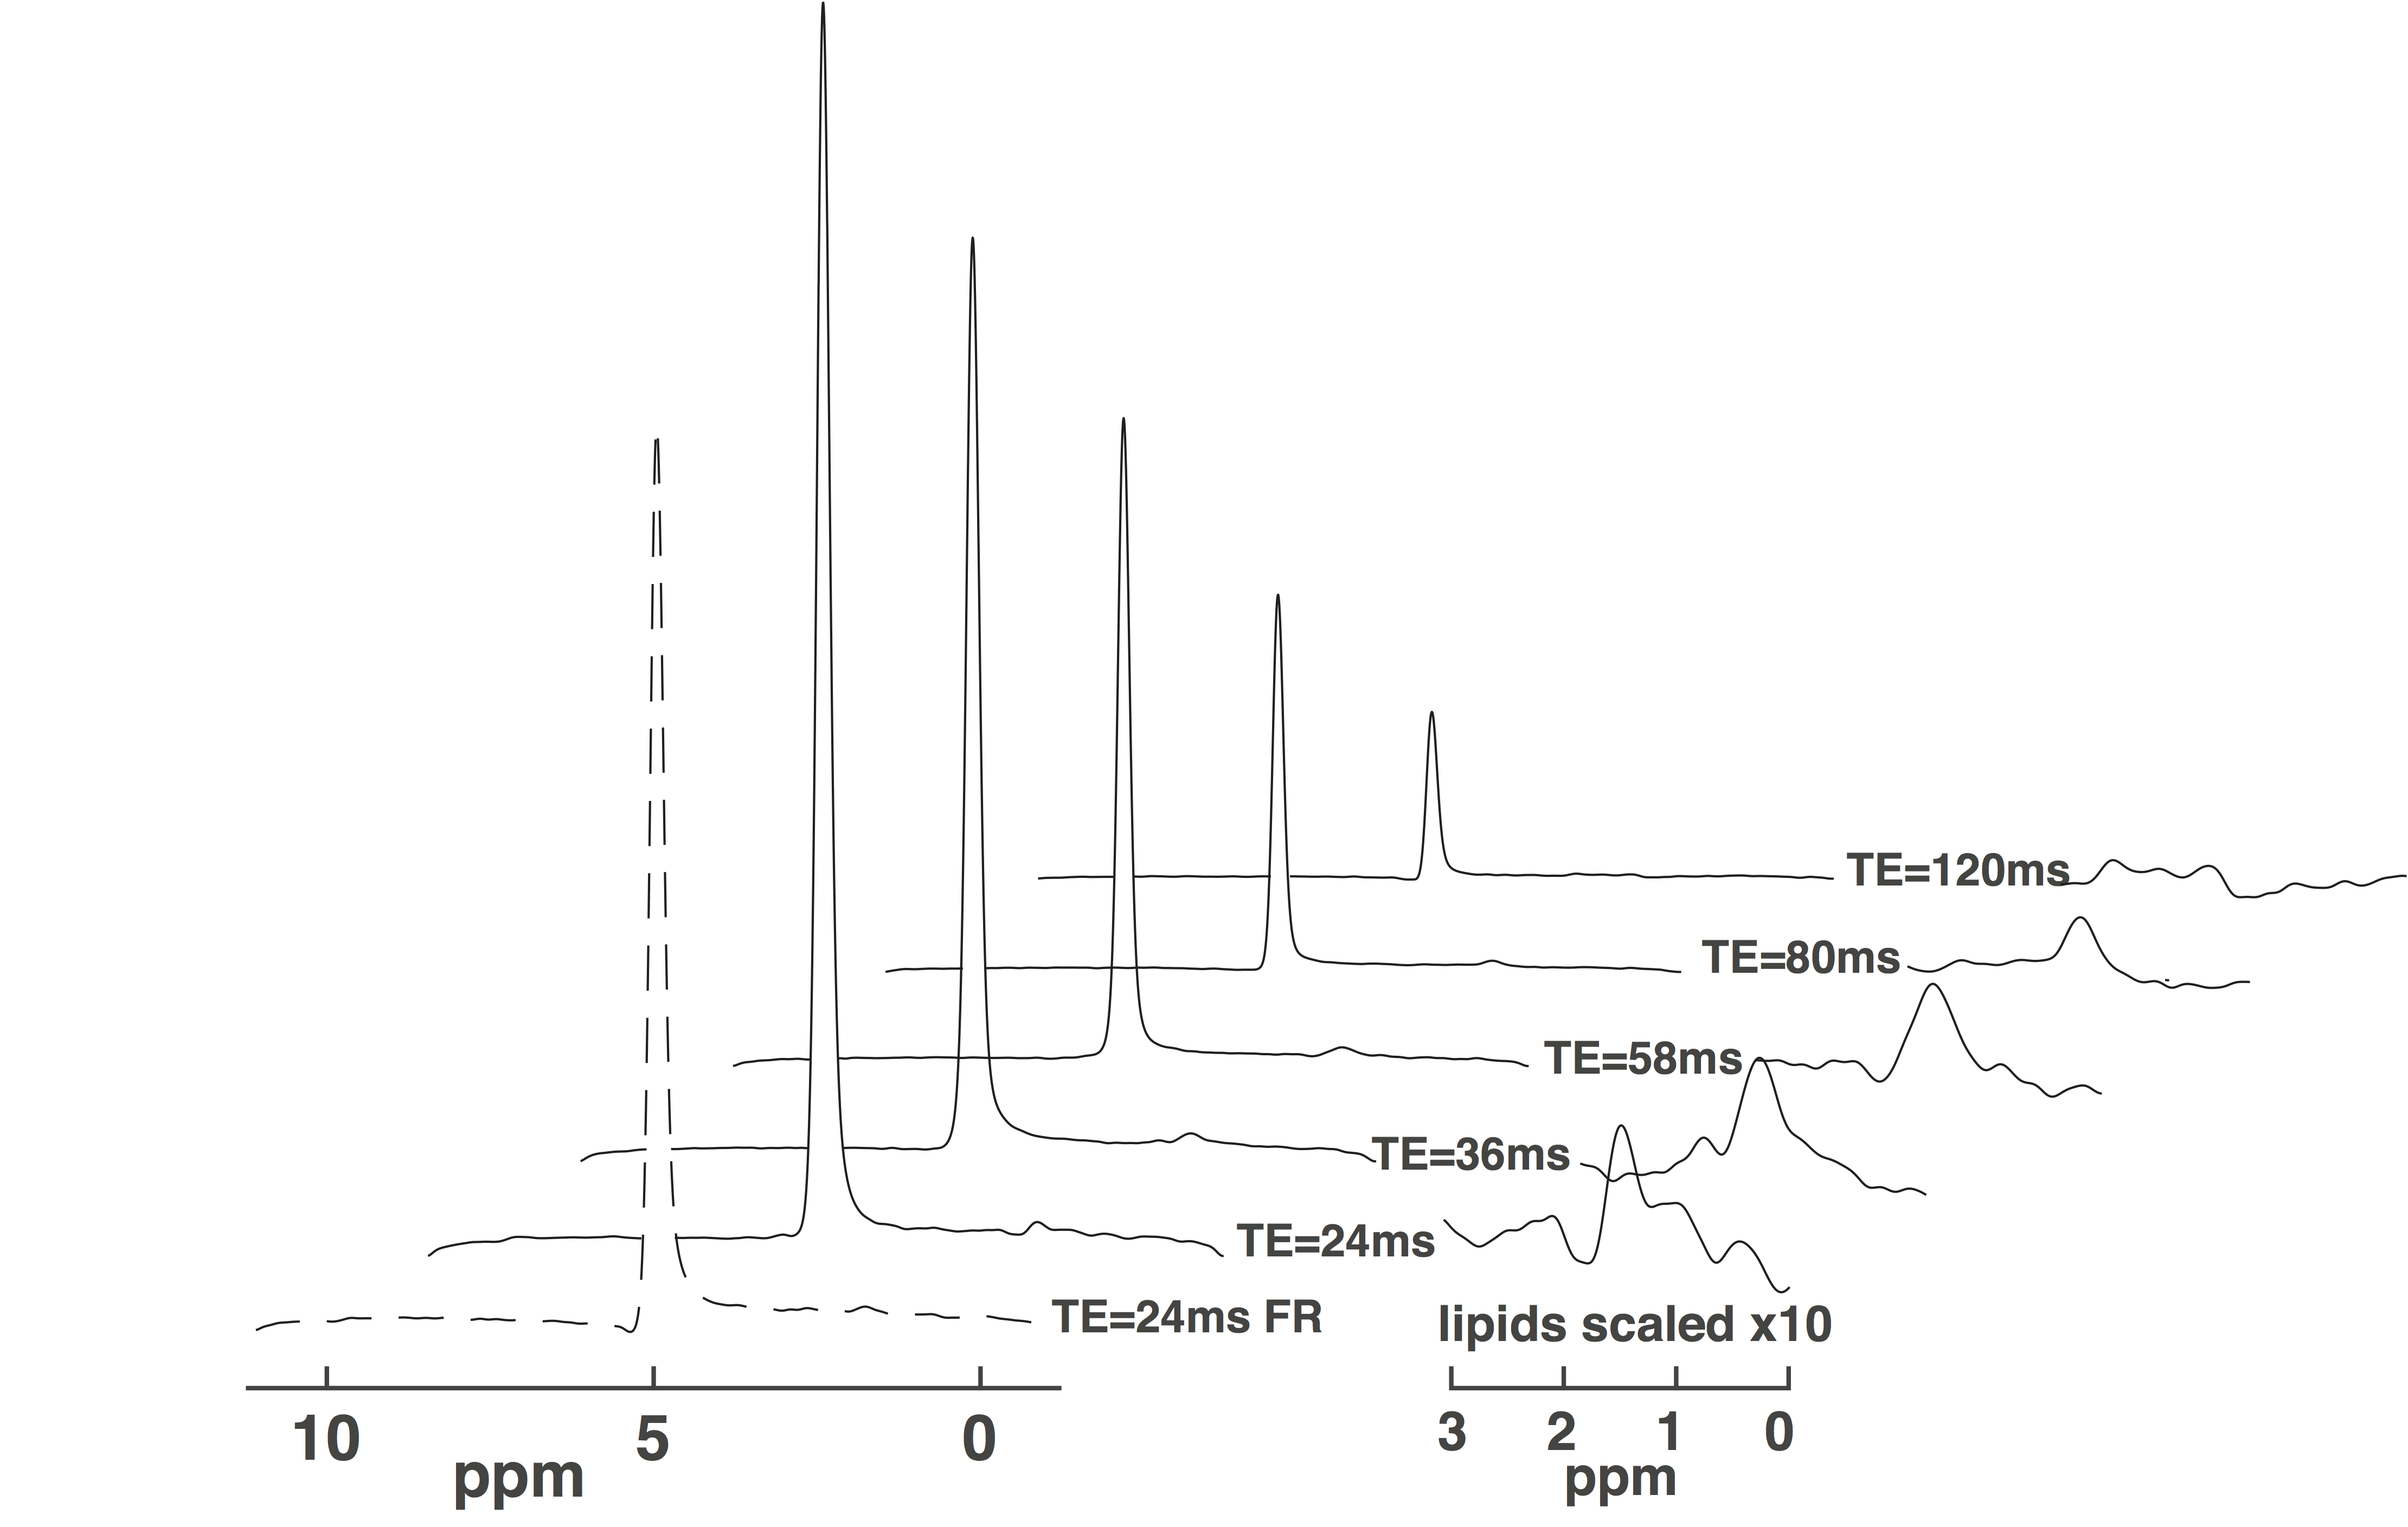
Eleven healthy subjects (age 40±8, range 28-53, ten female) were scanned in a 3T Siemens Verio. A 16-channel phased array coil over the chest was used for all subjects. After short axis and 4 chamber (4ch) scout images a 4ch T1 MOLLI1 and a 4 echo VARPRO water-fat image2 were recorded. Then a 20x6x35mm volume was prescribed on the ventricular septum for MRS. After B0 field mapping and shim correction a series of PRESS3 localized spectra was collected with cardiac gating. The first fully relaxed shot was recorded with TE 24ms, followed by five spectra with TE 24, 36, 53, 80 and 120ms. Depending on R-R intervals the number of signals averaged per TE was four (when R-R< 0.8s) or two ( R-R > 0.8s). The first spectrum served to estimate the saturation of the water resonance; the other spectra were used to estimate the T2 of the water signal and summed lipid CH2 and CH3 signals. Spectra were analyzed with AMARES4 time domain fitting in jMRUI. The log of the signal intensities was fitted against TE in linear regression to derive T2 and T1 relaxation corrected spin densities for water (w) and fat (f) at TE=0. PDFF were then calculated as PDFF= f/(w+f) %.RESULTS
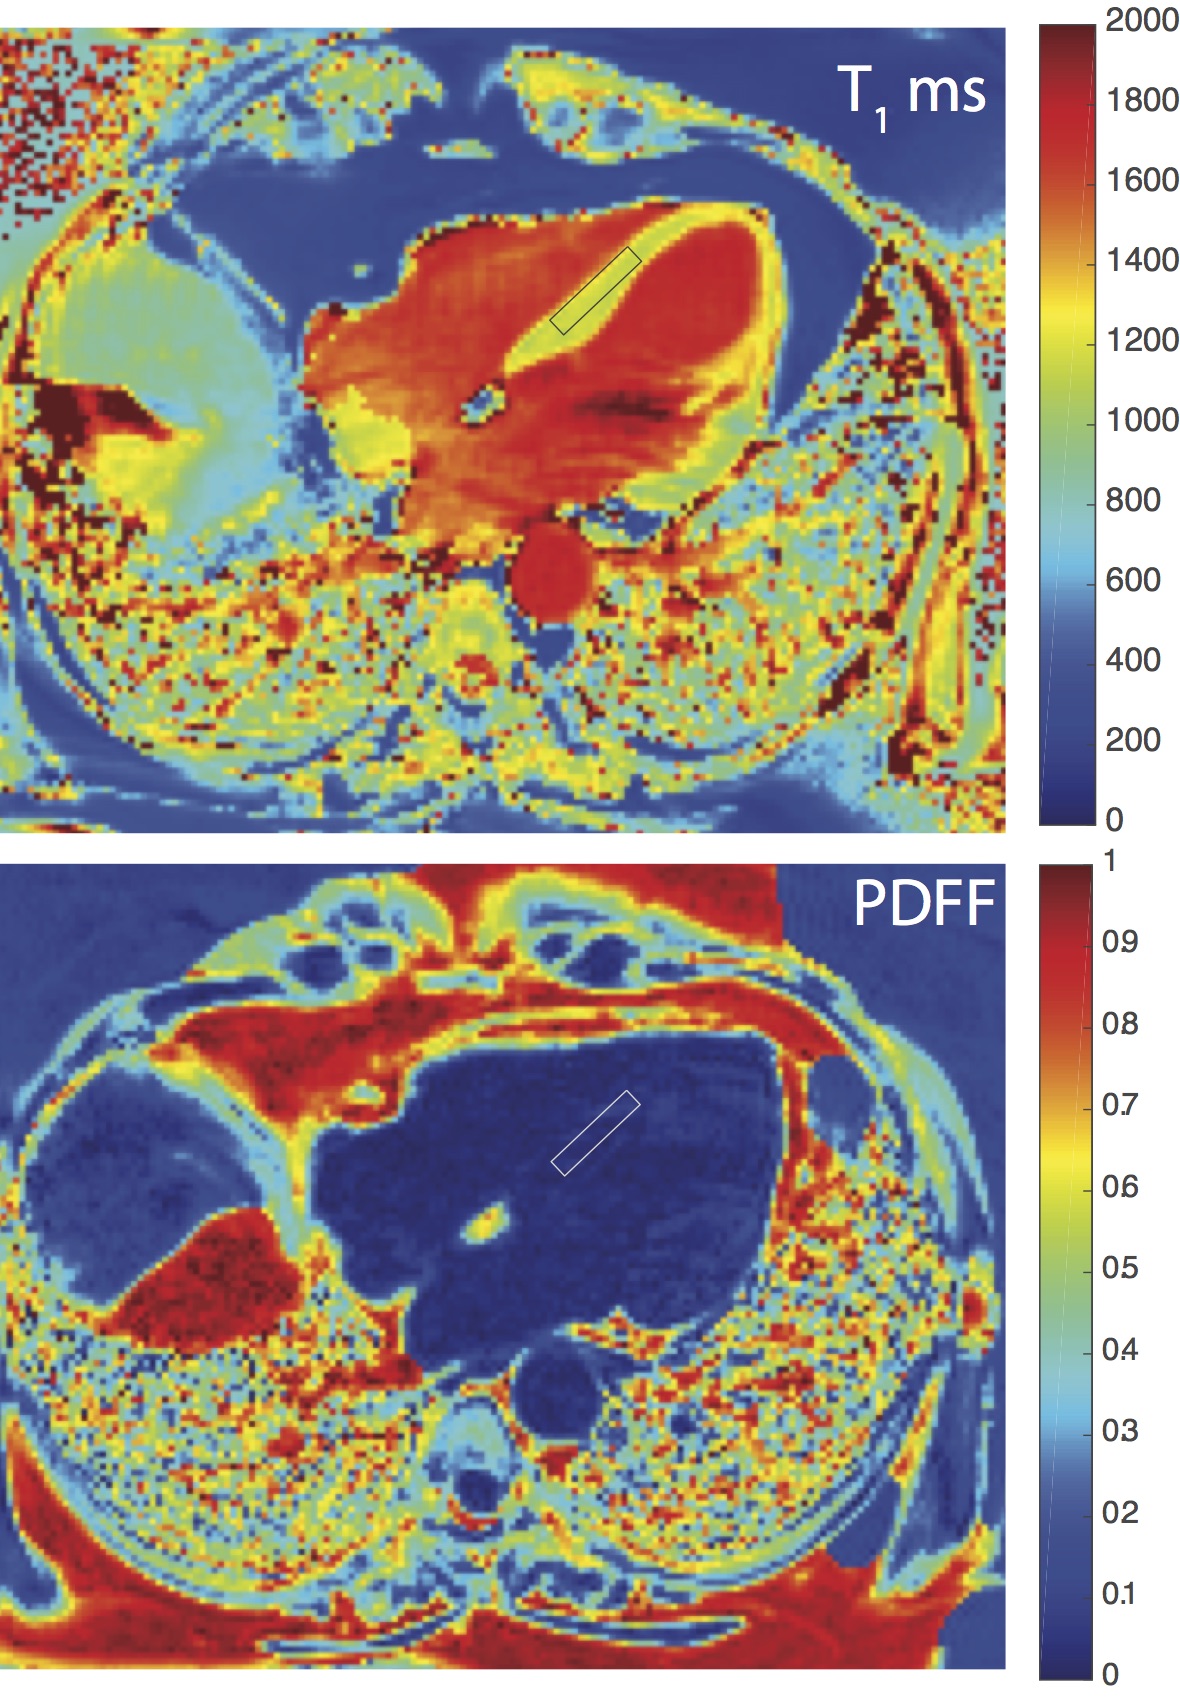
With MOLLI the tissue T1 were 1225±33 ms. A sample T1 map is shown in Figure 1. Saturation factors for the water signals in MRS were 0.72±0.11 (N=11, median 0.75, range 0.52-0.85) with R-R intervals 0.88±0.13 s (range 0.72-1.06 s). The saturation factors correlated poorly with the MOLLI T1 results. Probably because the average R-R interval recorded for the scan by scanner software was not a reliable basis for an estimate of the T1s. The T2 regression fit for the water signals showed good linearity: the correlation coefficients R2 were 0.93±0.10 ms (N=11, median 0.98 range 0.66-1.00) and the mean T2 found for water was 35±7 ms (N=11, median 33 range 26-47ms). In hearts with very low fat content and hence low fat signals, the longer TE spectra had insufficient SNR for reliable quantification and thus the correlation coefficients R2 lower 0.70±0.27 ms (N=11, median 0.70 range 0.23-1.00). The T2 for the lipid signal was 45±20 ms (N=10, median 40 ms range 17-92ms). In one subject the fit resulted in a negative T2 for the lipid signal and this result was omitted. In this series of observations the T2 of water and fat are not significantly different. The PDFF from water-fat MRI in the ROI defined by the cross section of the MRS volume with the 4ch images slice was 2.7±1.0%, (N=11, median 2.3% range 1.6-4.7%) This was higher than the T2 corrected PDFF found in the breath-hold MRS TE series: 0.93±0.61% (N=11, median 0.88% range 0.14-2.02%) the difference was significant in paired two-tailed t-test at p< 0.001.DISCUSSION
The measurement of water and lipid T2s in the human heart in a single breath-hold was possible with five TE values and signal averaging. The T2 relaxation corrected PDFF measured from the series was lower than measured with water fat imaging. MRI did not record a heart PDFF < 1.5% in any of the subjects. The water signal in these MRS acquisitions is partially saturated so the low PDFF may still be an overestimate. Measuring the T2 of lipids proved to be problematic in subject with normal low fat content.CONCLUSION
With favorable SNR and R-R intervals the T2 corrected fat fraction of the healthy human heart can be measured in a single breath-hold at 3T, but for a more reliable result the acquisition of a TE series should be recorded over multiple breath hold. This however requires the breath-holds to be reproducible. The saturation of the water signal in single R-R interval repetitions is about 25% large enough to require a T1 correction, which could be based on a T1 mapping with MOLLI.Acknowledgements
We would like to thank the NIH and NIDDK for providing the framework and funding for this research and also thank Jatin ‘Raj’ Matta, and Marissa Schoepp for their very essential efforts and enthusiasm.References
1. Messroghli DR, Radjenovic A, Kozerke S, et al. Modified look-locker inversion recovery (MOLLI) for high-resolution T 1 mapping of the heart. Magn. Reson. Med. 2004;52:141–146.
2. Hernando D, Haldar JP, Sutton BP, et al. Joint estimation of water/fat images and field inhomogeneity map. Magn. Reson. Med. 2008;59(3):571–80.
3. Bottomley PA. Spatial localization in NMR spectroscopy in vivo. Ann N Y Acad Sci. 1987;508:333–348.
4. Vanhamme L, van den Boogaart A, Van Huffel S. Improved method for accurate and efficient quantification of MRS data with use of prior knowledge. J. Magn. Reson. 1997;129(1):35–43.
Figures