2746
Segment and sexual variation of myocardium in T1 mapping and extracellular volume fraction with cardiovascular magnetic resonance in healthy volunteers1Department of Radiology, Union Hospital, Tongji Medical College, Huazhong University of Science and Technology, Wu Han, People's Republic of China, 2MR Collaboration NE Asia, Siemens Healthcare, Shanghai, China
Synopsis
This study aimed to evaluate sex and segment differences of myocardium in native T1 value and ECV in healthy volunteers. We measured native T1 value of 425 segments and ECV of 424 segments. The results showed that myocardial ECV of females was higher than that of males in basal, middle and apical segments. The ECV of the apical segments was higher than in the basal and middle segments. The mean native T1 value and ECV were not associated with age, ejection function(EF), end diastolic volume(EDV), end systolic volume(ESV), and stroke volume(SV).
Purpose
To assess variations of myocardial native T1 time and ECV for different cardiac segments and genders in healthy subjects.Methods
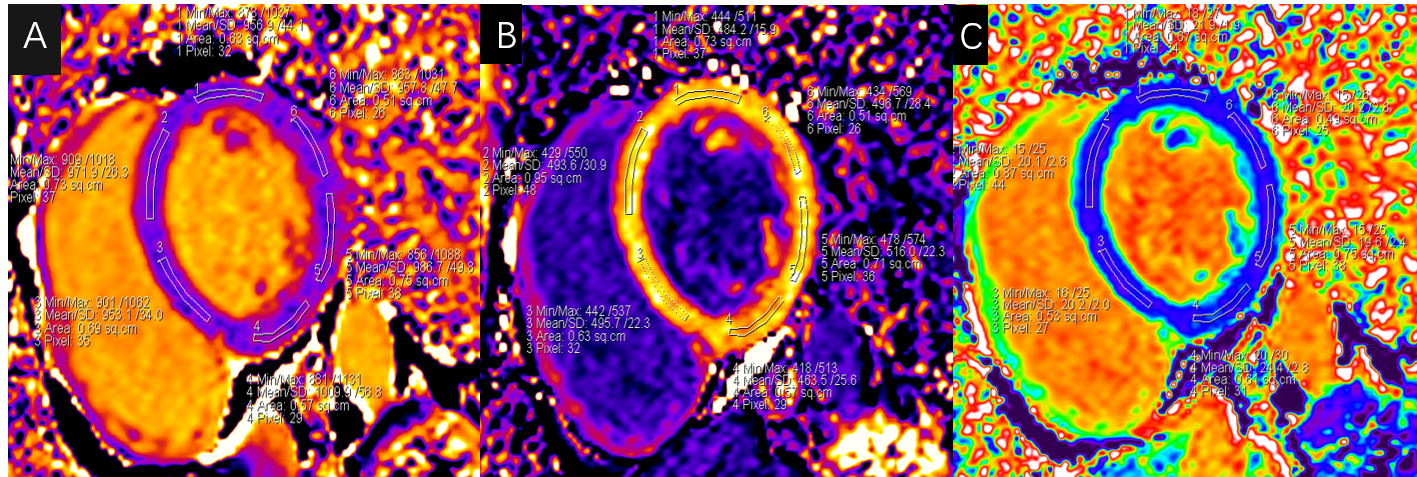
We recruited 27 healthy volunteers (mean age: 35±16 years; 14 males), without any history of cardiovascular disease to undergo contrast-enhanced cardiac magnetic resonance imaging on a 1.5T MR scanner (MAGNETOM Area, Siemens Healthcare, Erlangen, Germany). T1 mapping was performed at basal, mid and apical slices before and 15 min after administration of gadolinium using a prototype modified Look-Locker inversion recovery (MOLLI) sequence. ECV maps were automatically calculated based on the subject-specific hematocrit value. The native T1 and ECV values were measured in 16 regions of interest (ROIs) in left ventricle according to the AHA 16-segment model. Segments with artifacts were excluded.Results
Native T1 values of 425 segments and ECV values of 424 segments were assessed. The mean native T1 and ECV values of the 16 segments for all the subjects were 1018.7 ± 40.2ms and 25.4±2.8%. The ECV of the apical segments was higher than that of middle segments (26.6±2.9% vs 25.1±2.2%, P=0.037)and basal segments (26.6±2.9% vs 25.0±2.1%, P=0.020). No significant statistical differences of native T1 values were observed among the three slices. In addition, there were no differences in ECV and native T1 values among anterior, septal, inferior, and lateral wall for none of the three slices. The mean ECV of the 16 segments in females was greater than males (26.8±2.0% vs. 24.2±1.5%, p =0.001). The ECV of base, middle and apical segments in females was also higher than males (base: 26.3±1.6% vs 23.7±1.8%, P=0.01; middle: 26.5±2.0% vs 23.9±1.8%, P=0.02; apex: 28.2±3.2 vs 25.2±1.8, P=0.05). The native T1 time showed no significant differences between males and females. The mean native T1 value and ECV were not associated with individual age, ejection function(EF), end diastolic volume(EDV), end systolic volume(ESV), and stroke volume(SV).Discussions&Conclusions
In healthy volunteers, the ECV of the apical segments was higher than in the basal and middle segments. The myocardial ECV of females was higher than that of males in basal, middle and apical segments. While ECV showed significant variations among sex and segments, native T1 did not present such significant variations. In previous reports1-4, the gender differences in ECV were consistent to our study. However, the difference between septal wall and non- septal wall and the correlation between ECV and individual age were not observed. Furthermore, our result demonstrated higher value in apical segment than the other two. In later work, the reference ranges of sex and segment for ECV would be valuable to clinical quantitative diagnosis.Acknowledgements
We thanks for Siemens corporation's supports for the software and technology.References
1.Carberry, J. et al. 6 Segmental variation in myocardial extracellular volume in healthy mid-life adults: Abstract 6 Table 1. Heart 101, A4.1-A4, doi:10.1136/heartjnl-2015-307845.6 (2015).
2.Liu, C. Y. et al. Evaluation of age-related interstitial myocardial fibrosis with cardiac magnetic resonance contrast-enhanced T1 mapping: MESA (Multi-Ethnic Study of Atherosclerosis). J Am Coll Cardiol 62, 1280-1287, doi:10.1016/j.jacc.2013.05.078 (2013).
3. Piechnik, S. K. et al. Age and gender dependence of pre-contrast T1-relaxation times in normal human myocardium at 1.5T using ShMOLLI. Journal of Cardiovascular Magnetic Resonance 14, P221, doi:10.1186/1532-429x-14-s1-p221 (2012).
4.Rauhalammi, S. M. et al. Native myocardial longitudinal (T1 ) relaxation time: Regional, age, and sex associations in the healthy adult heart. J Magn Reson Imaging 44, 541-548, doi:10.1002/jmri.25217(2016).
Figures