2744
An in-vivo comparison of STEAM and 2nd order motion compensated spin-echo imaging in multi-phase cardiac DTI at 3T1Cardiovascular Biomedical Research Unit, Royal Brompton Hospital, London, United Kingdom, 2National Heart and Lung Institute, Imperial College London, London, United Kingdom, 3National Heart Lung and Blood Institute, National Institutes of Health, Bethesda, MD, United States
Synopsis
Cardiac diffusion tensor imaging (cDTI) is a novel non-invasive method of interrogating myocardial microstructure that has seen a recent surge in interest. Many of the most interesting clinical results were obtained using stimulated echo acquisition mode (STEAM) imaging at multiple cardiac phases. Recently however, spin-echo cDTI with second order motion compensated diffusion gradients (M012-SE) was proposed. In this study we report results of a comparison of M012-SE and STEAM imaging in multiple cardiac phases at 3T in 15 healthy subjects with matched sequence parameters. While M012-SE provides comparable quality data in systole, STEAM is the more reliable technique in diastole.
Introduction
Stimulated echo acquisition mode (STEAM) cardiac diffusion tensor imaging (cDTI) is robust, reproducible1,2 and has recently produced interesting clinical results3. However STEAM is signal to noise inefficient and the influence of strain on the measured diffusion is not fully understood. Alternatively, spin-echo (SE) with acceleration and velocity compensated diffusion gradients (M012) has been demonstrated and compared to STEAM at 1.5T in systole using high-performance gradient systems4,5. In previous work we compared STEAM to M012-SE6 at 3T for multiple cardiac time points, but subsequent investigations discovered a slice thickness inconsistency between the sequences. Here we compare the sequences using matched slice thicknesses and sequence parameters on a standard clinical 3T scanner at three cardiac phases.Methods
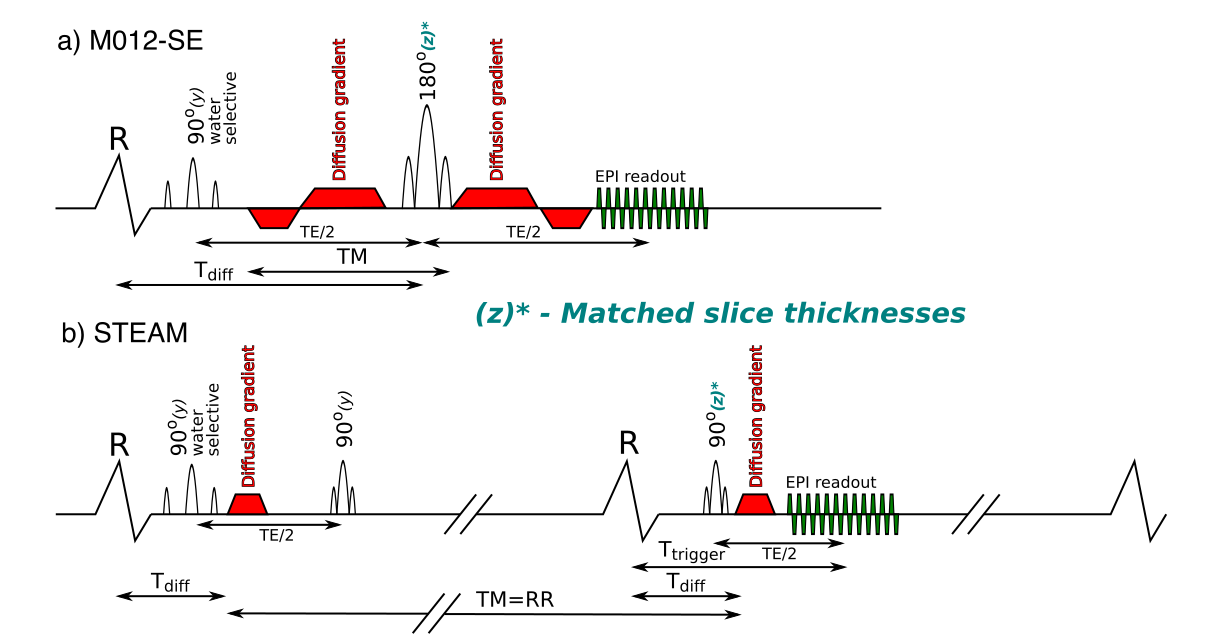
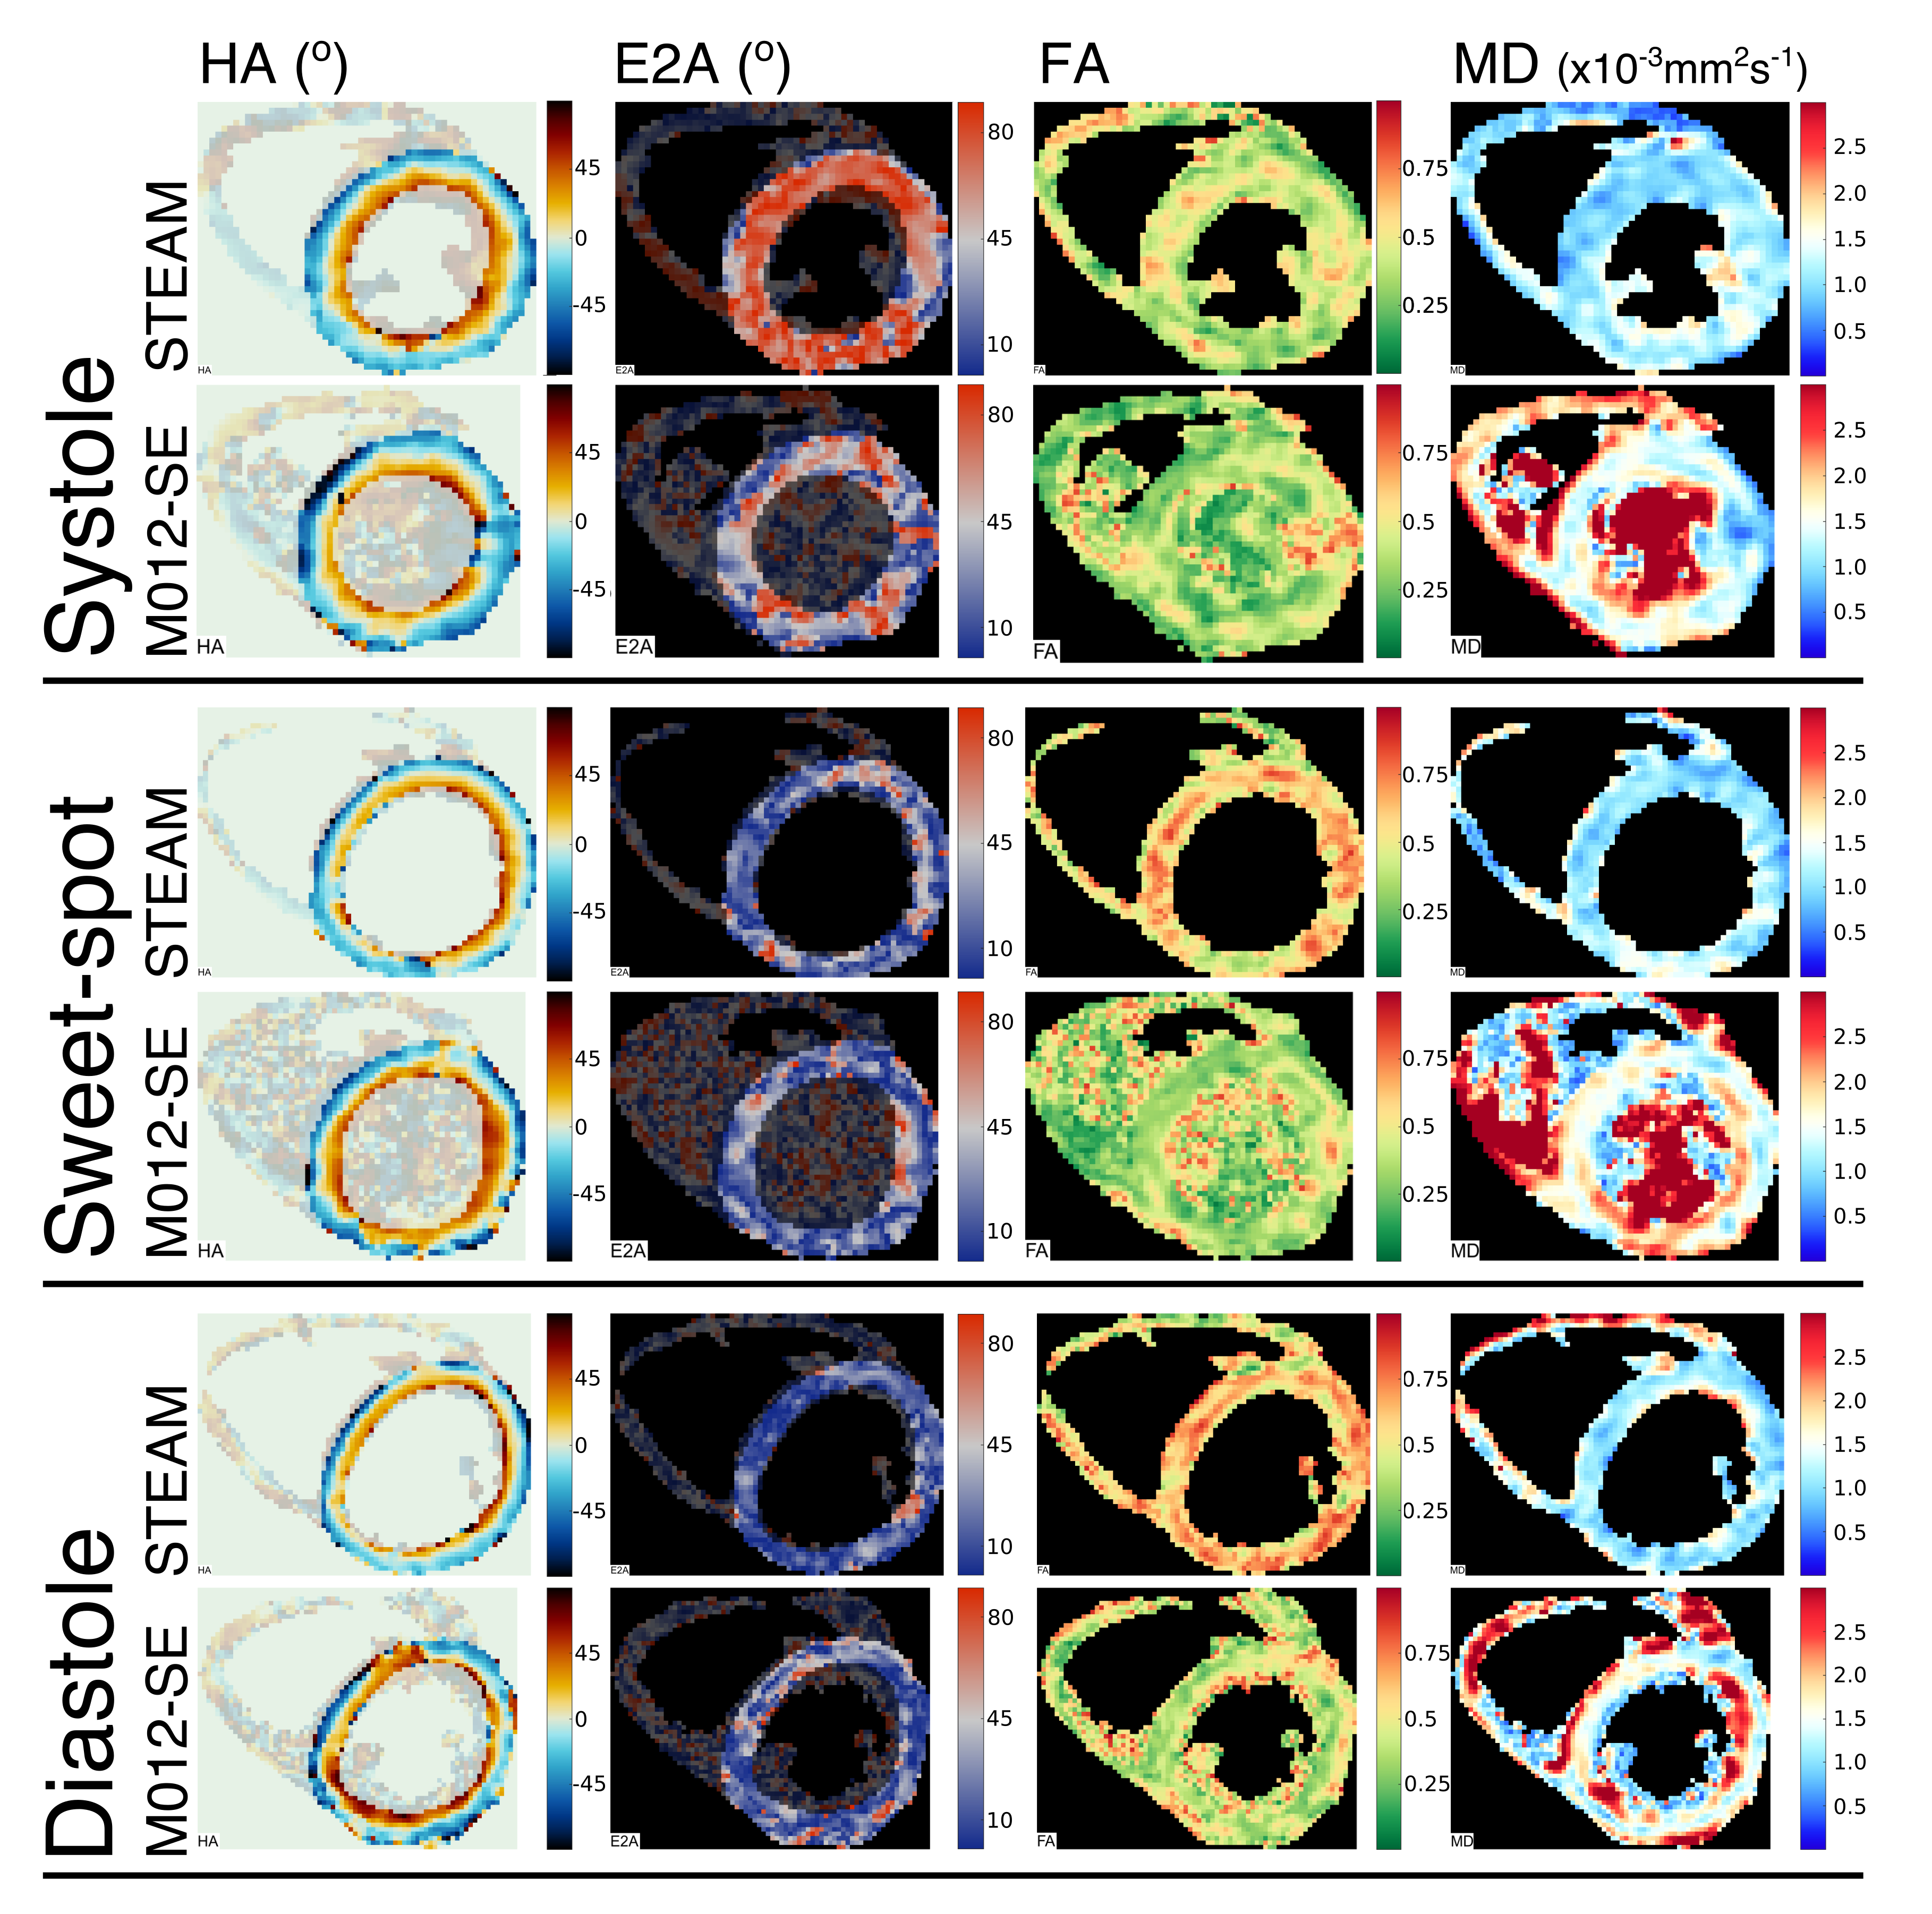
STEAM and M012-SE sequences were implemented with identical EPI readouts and matched slice thicknesses(figure 1). Imaging was performed on a Siemens Skyra 3T scanner (40mT/m, 200T/m/s) at 2.8x2.8x8mm3 (1.4x1.4x8mm3 reconstructed), SENSE x2, read field of view (FOV) 360mm and phase FOV 135mm (using a slice selection gradient on the second RF pulse). Both sequences used binomial (1-2-1) water excitation, bmain=450smm-2, bref=150smm-2 and 6 directions. STEAM imaging used TE=23ms, TR=2RR-intervals and 8 averages. M012-SE imaging used TE=75ms, TR=1RR-interval and 16 averages. Imaging was performed in an agar phantom (T1=1090ms, T2=51ms, 50 averages) to the compare relative SNR of the two sequences to theoretical values5 and in 15 volunteers (9 male, 24 [20–36]years, median [range]). In-vivo data was acquired in a mid-ventricular short-axis slice during breath holding with diffusion encoding timed to end-systole, diastasis and the systolic sweet-spot7. Previous analysis of DENSE strain data acquired in 13 volunteers identified the systolic sweet-spot as 150ms from the R-wave8. Data was processed using in-house Matlab software to produce pixel-wise maps of helix angle (HA), absolute sheetlet angle based on the second eigenvector (E2A), transverse angle (TA), mean diffusivity (MD), fractional anisotropy (FA). A linear regression of HA with transmural depth was used to compare HA between sequences. HA maps were also visually scored 0-4 based on <50%, 50-75%, 75-95% and >95% respectively of the myocardium demonstrating the expected transmural variation. The standard deviation of TA and the R2 of the linear regression of transmural HA variation were used as additional data quality measures based on the assumptions of a linear transmural HA distribution and an approximately constant TA.Results
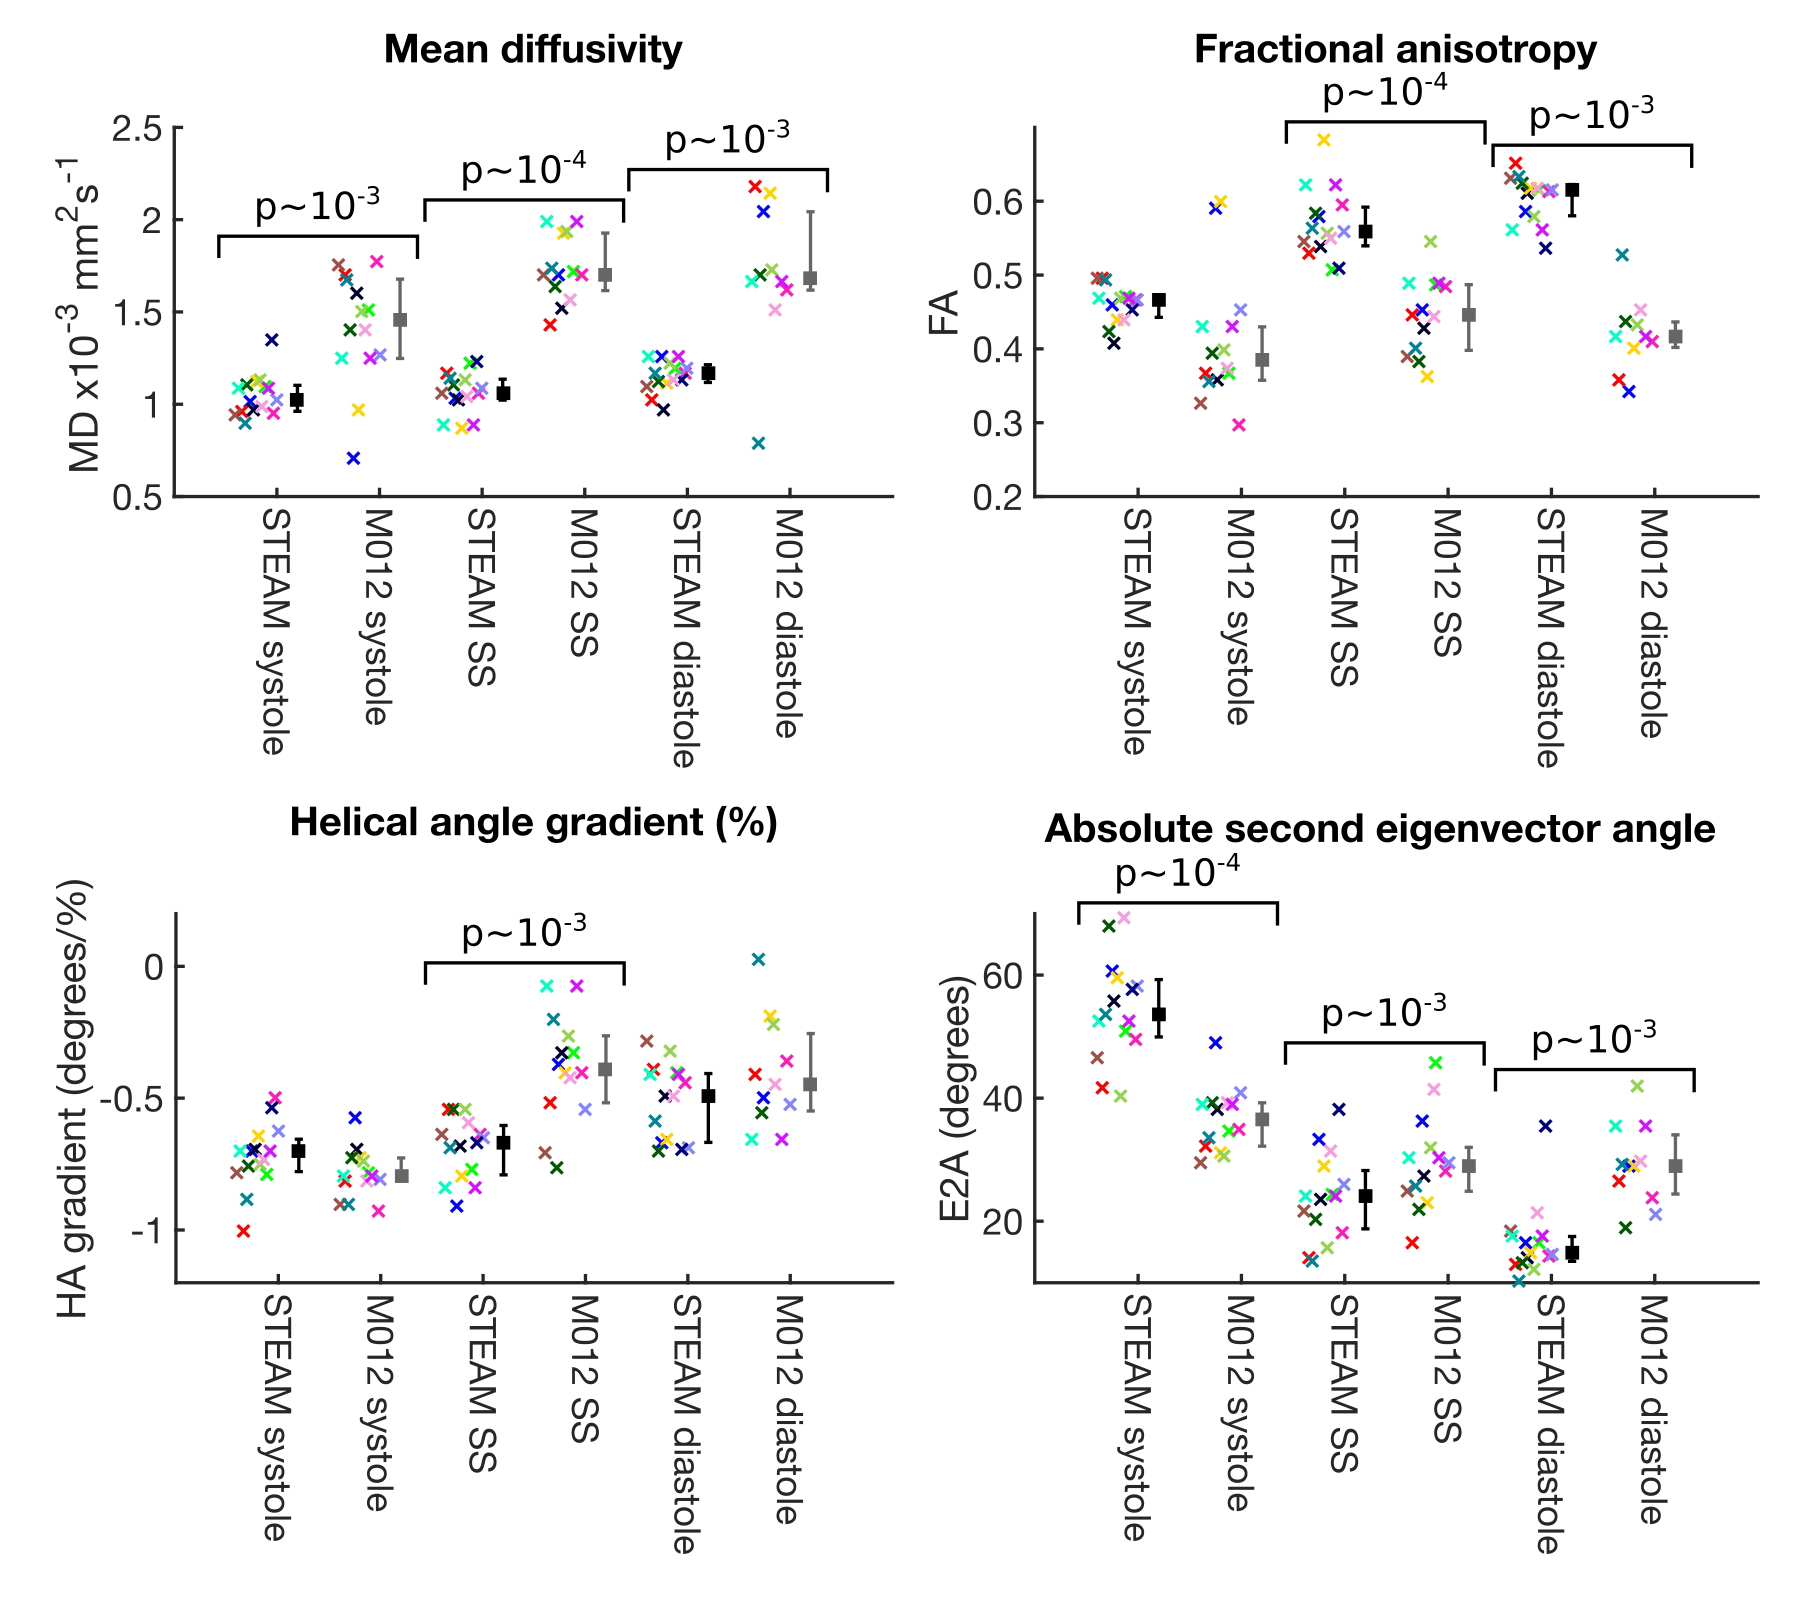
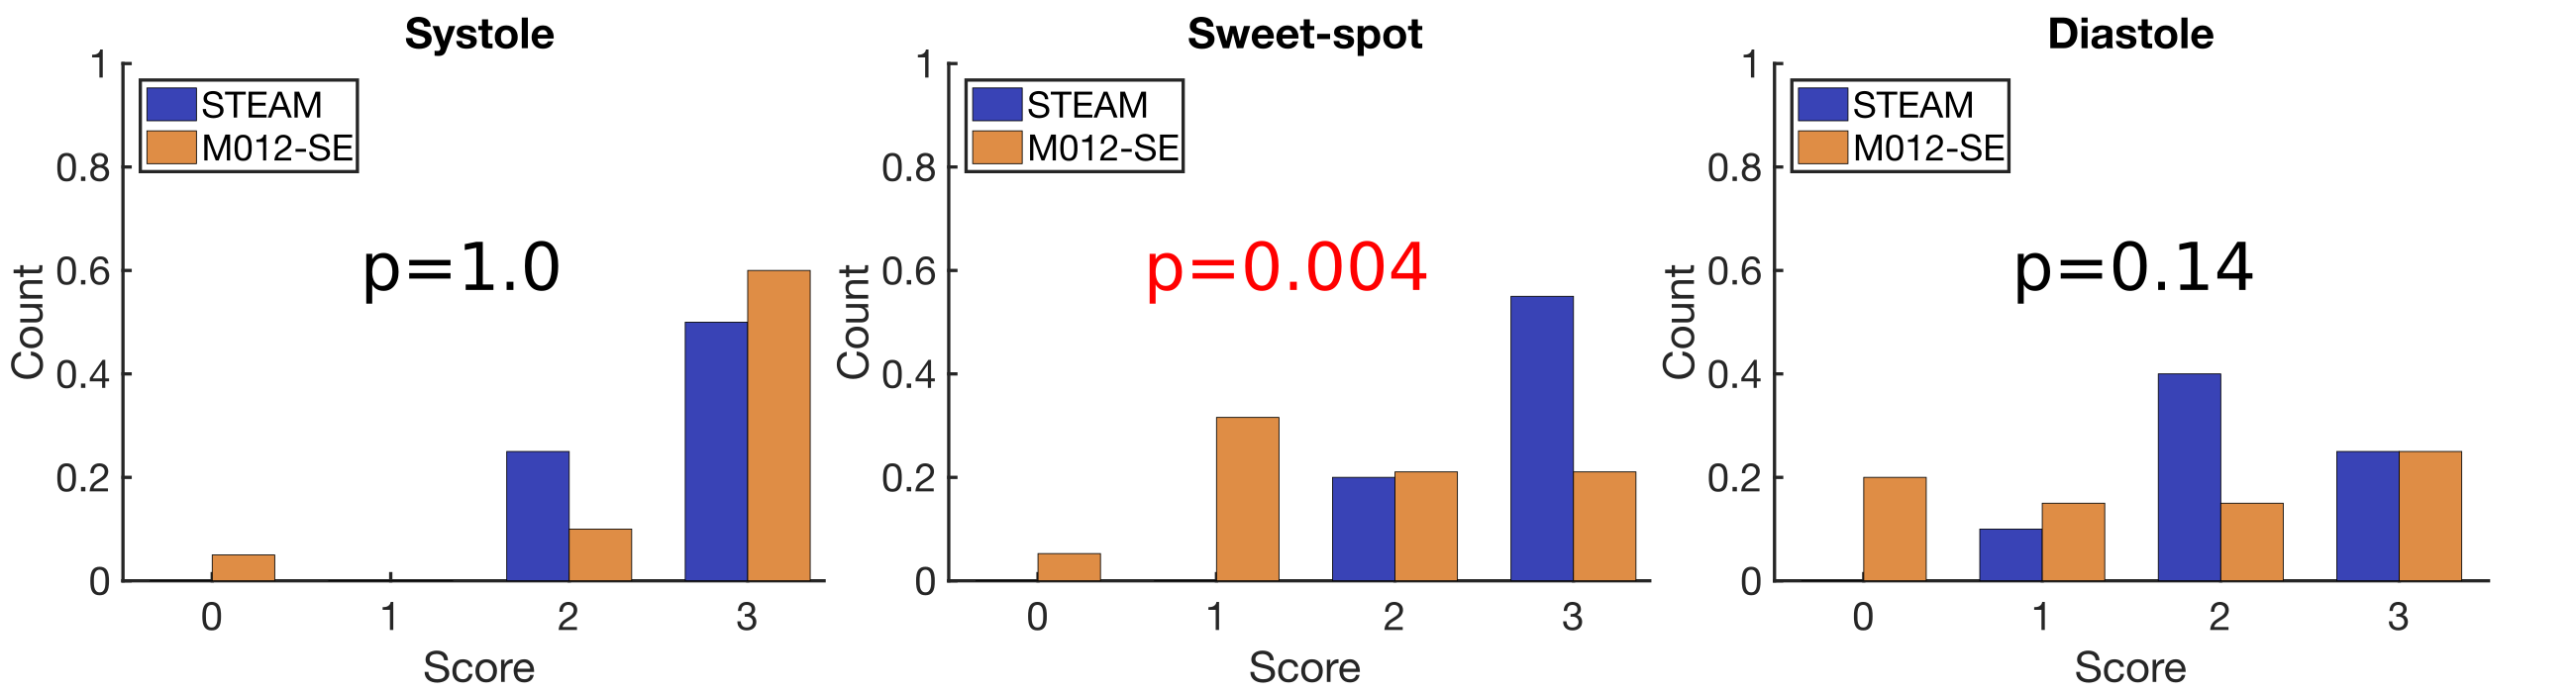
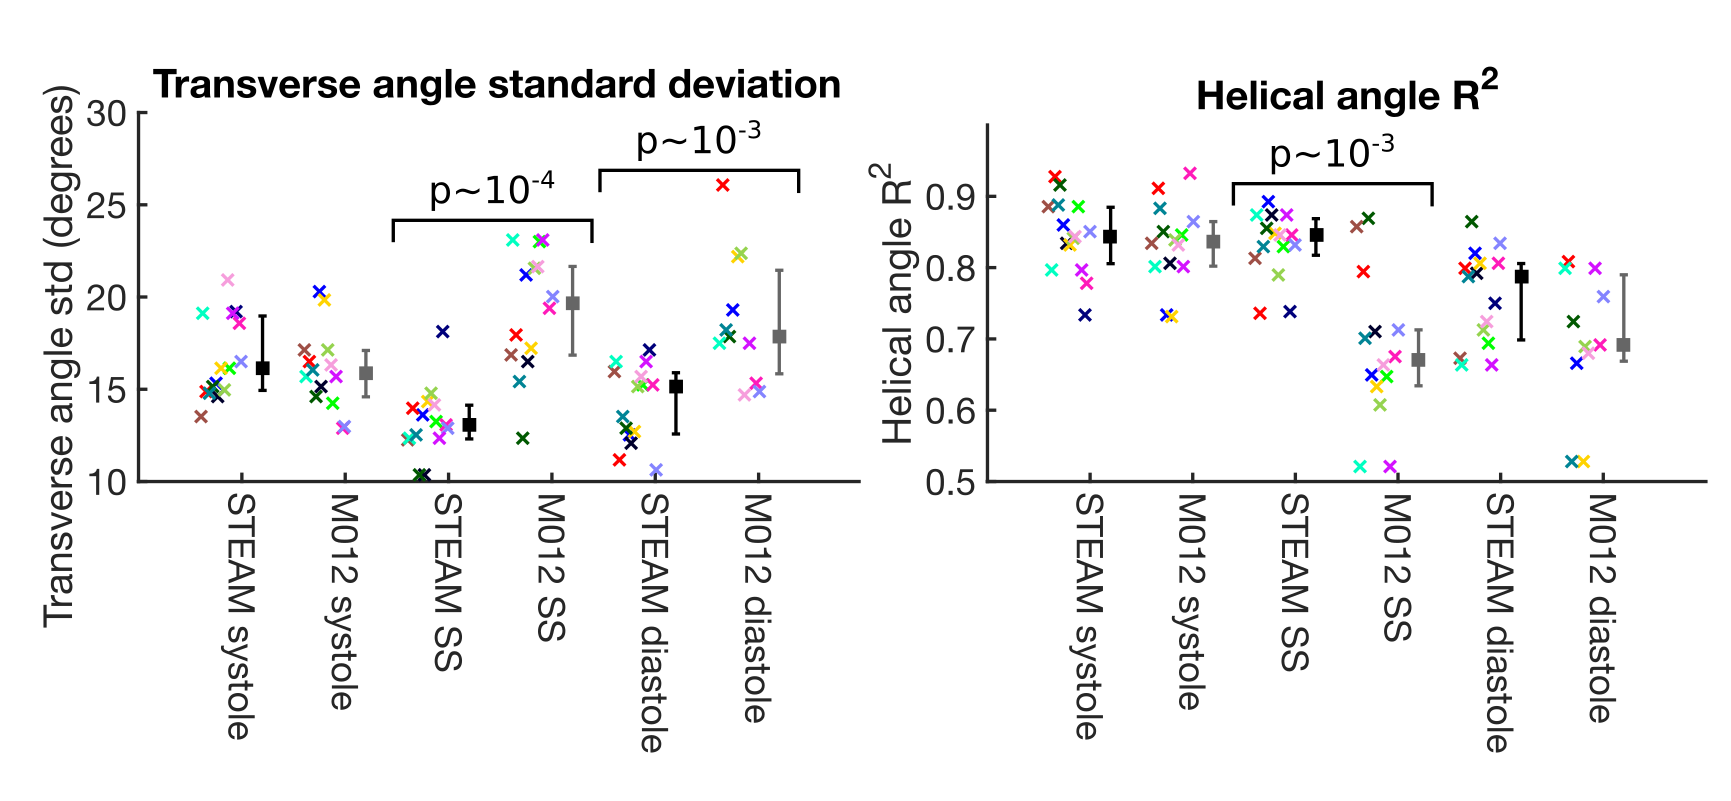
The measured SNR ratio (M012-SE/STEAM, mean signal/temporal standard deviation) of 1.87 in the agar phantom was similar to the theoretical value of 1.97. cDTI data was of sufficient quality for analysis in all STEAM acquisitions, but 1 systolic, 1 sweet-spot and 4 diastolic M012-SE acquisitions scored 0 and were excluded from further analysis. Figure 2 shows example parameter maps and figure 3 compares average left ventricular values. MD is lower (p<0.01) in all phases and FA is higher at the sweet-spot and in diastole using STEAM (p<0.01). There was a reduction in E2A mobility (systole-diastole) using M012-SE; E2A was higher in systole and lower in diastole using STEAM (p<0.01 at all phases). Transmural HA gradient was significantly different at the sweet-spot (p<0.01). Figure 4 shows the HA map visual scores, which were significantly lower for M012-SE at the sweet-spot (median STEAM score 3 vs. M012-SE score 2, p=0.004). HA map visual score was found to positively correlate with RR-interval for M012-SE in diastole (Spearman Rho=0.64, p=0.009). Figure 5 shows a higher TA standard deviation at the sweet-spot and in diastole and a reduced R2 of the linear regression of HA with transmural depth at the sweet-spot (p<0.01) using M012-SE, which is suggestive of poorer quality data5.Discussion
The previously described5 systolic differences in MD and FA between STEAM and M012-SE primarily due to differences in diffusion time (~1000ms for STEAM vs. ~30ms for M012-SE) are maintained at 3T in systole, diastasis and the sweet-spot, when imaging parameters are matched between sequences. Data were of comparable quality between the sequences in systole, but data quality measures were better using STEAM at the sweet-spot despite the higher SNR available using M012-SE. M012-SE was unsuccessful in 27% of diastolic acquisitions, due to either missed ECG triggers as a result of the longer diffusion encoding or an insufficient duration of stasis, which could not accommodate the longer diffusion gradients required by M012-SE.Conclusion
There are systematic differences between cDTI parameters obtained using STEAM and M012-SE. Although both sequences can be used to provide cDTI data at peak systole, further work is required to improve the reliability of M012-SE in diastole. Patient studies are required to assess whether the differences between the sequences can provide complementary microstructural information.Acknowledgements
Not applicable.References
1.
Reese MRM
1995.DOI:10.1002/mrm.1910340603.
2.
Nielles-Vallespin
MRM 2012. DOI:10.1002/mrm.24488?
3.
Ferreira JCMR 2014. DOI:10.1186/s12968-014-0087-8
4.
Stoeck MRM
2015. DOI:10.1002/mrm.25784
5.
Von
Deuster MRM 2015. DOI:10.1002/mrm.25998
6.
Scott ISMRM
2016. P3115.
7.
Tseng MRM
1999. DOI: 10.1002/(SICI)1522-2594(199908)42:2<393::AID-MRM22>3.0.CO;2-F
8.
Scott SCMR/ISMRM Workshop on
Quantitative CMR 2016. W17.
Figures