2741
Simple quantification using the myocardium-to-lumen signal ratio in diffuse myocardial fibrosis of non-ischemic cardiomyopathies: Correlation with T1 mapping derived ECV1Department of Radiology, National Cerebral and Cardiovascular Center, Suita, Osaka, Japan, 2Division of Cardiology, National Cerebral and Cardiovascular Center, Suita, Osaka, Japan
Synopsis
Myocardial T1 mapping has recently been applied to the quantification of extracellular volume fraction (ECV) and has shown potential for the detection of myocardial fibrosis. However, for the measurement of ECV, additional scans of pre- and post-contrast T1 mapping are necessary, and the post-processing procedure is time consuming. In this study, the myocardium-to-lumen signal ratio (M/L) in conventional late gadolinium enhancement images with fixed inversion time showed acceptable levels of correlation with ECV obtained by the T1 mapping in non-ischemic cardiomyopathy, suggesting that M/L has the potential to allow for simple quantification of the fibrotic change in non-ischemic cardiomyopathies.
Introduction
Late gadolinium enhancement (LGE) is a widely-used method for evaluating the myocardial fibrosis in various cardiomyopathies. LGE relies on the difference in signal intensity between fibrotic and unaffected myocardium as a “nulled” reference, which limits its usefulness in the diagnosis of diffuse interstitial fibrosis. Recently, myocardial T1 mapping has been applied to the quantification of extracellular volume fraction (ECV) and has shown potential for providing a better characterization of myocardial tissue composition. 1 However, for measurement of ECV, additional scans of pre- and post-contrast T1 mapping are necessary, and the post-processing procedure is time consuming.Purpose
In this study, we evaluated the utility of simple quantification using the myocardium-to-lumen signal ratio for assessment of myocardial fibrosis in patients with non-ischemic cardiomyopathy and compared it with ECVs obtained via T1 mapping.Methods
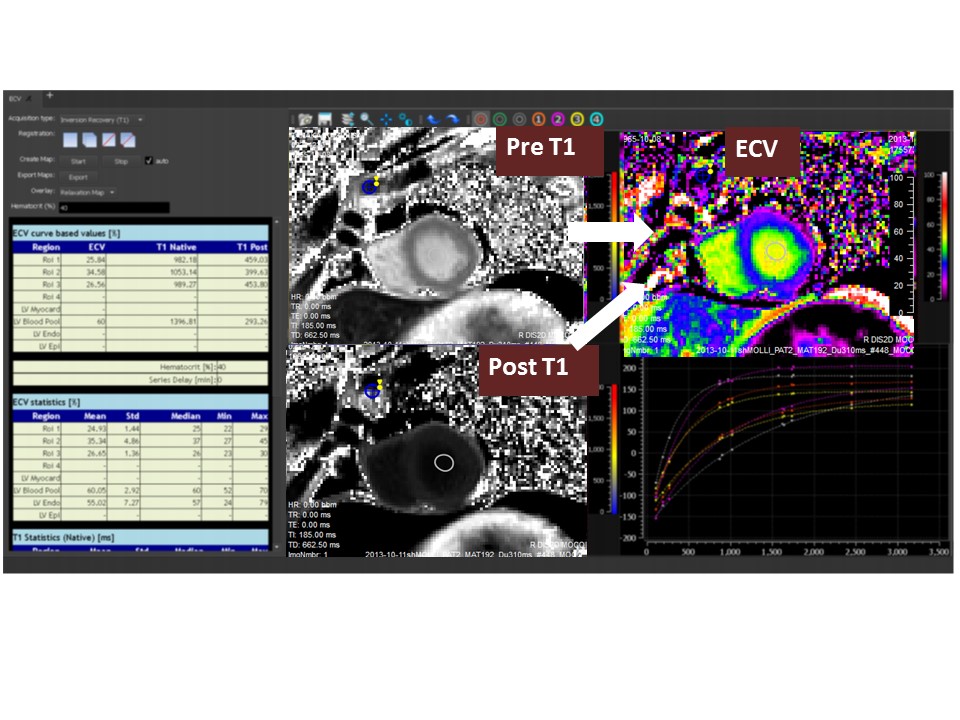
Twenty-two patients with non-ischemic cardiomyopathies (DCM and HCM) and eight patients with normal myocardium underwent gadolinium-enhanced cardiac MRI via a 3T clinical machine (MAGNETOM Verio, Siemens AG Healthcare Sector, Erlangen, Germany). LGE was performed with IR True-FISP (fixed inversion time = 350 msec) at 2, 5, 10, and 20 minutes post-gadolinium administration. We measured the mean signal intensity ratio of the myocardium to lumen close to each myocardium (M/L) into 8 segments (basal and mid-ventricular, Figure 1) using 20-minute delayed images as an index for contrast enhancement. 2 In patients with non-ischemic cardiomyopathies, the presence or absence of LGE was decided visually via 20-minute delayed images. T1 mapping using Fast-MOLLI was performed on a short-axial slice at the same level both pre-contrast as well as 21 minutes post-contrast. Fast-MOLLI was implemented as a two-inversion recovery (IR) sequence with the first of three and the second of five consecutive image acquisitions, decreasing the acquisition time by approximately one-third as compared to the original-MOLLI method. 3 The T1 map was reconstructed using eight source images with different inversion times. The ECV was quantified according to the following formula: ECV=λ x (1 – hematocrit), where λ=⊿R1myocardium /⊿R1bloodpool (⊿R1: the change of R1(=1/T1) between pre- and post-contrast). The pre- and post-contrast T1 map was used for automatic reconstruction of the ECV map with dedicated software (MapMaker prototype®, Medis, Leiden, Netherlands) (Figure 2). The ECV map was also divided into eight segments. Segment-based ECV values were measured, and the mean of the eight segmental values was calculated.Results
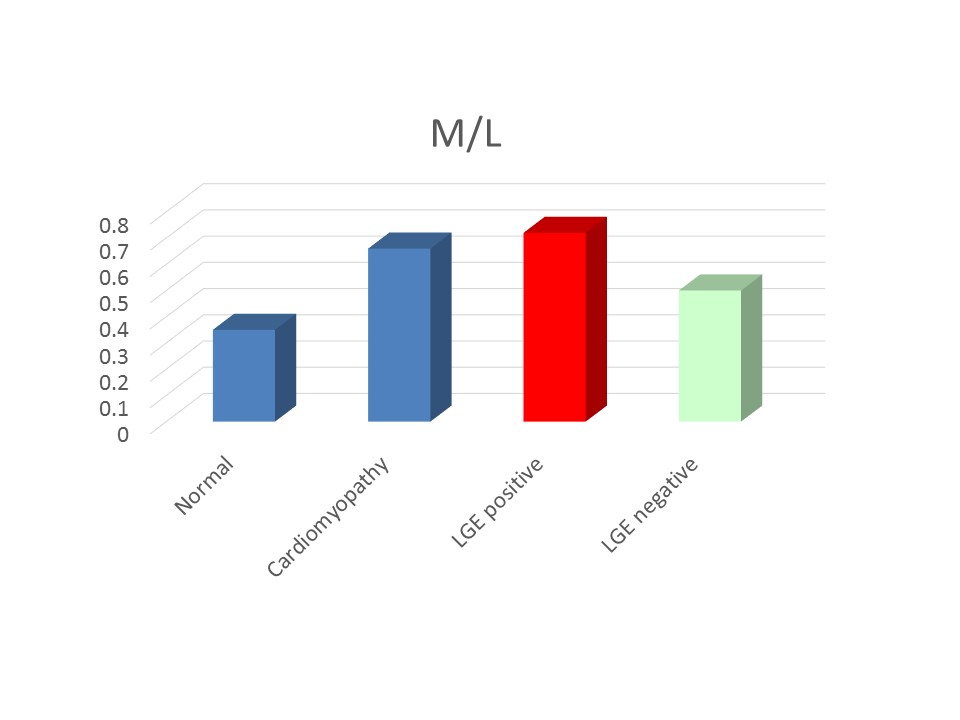
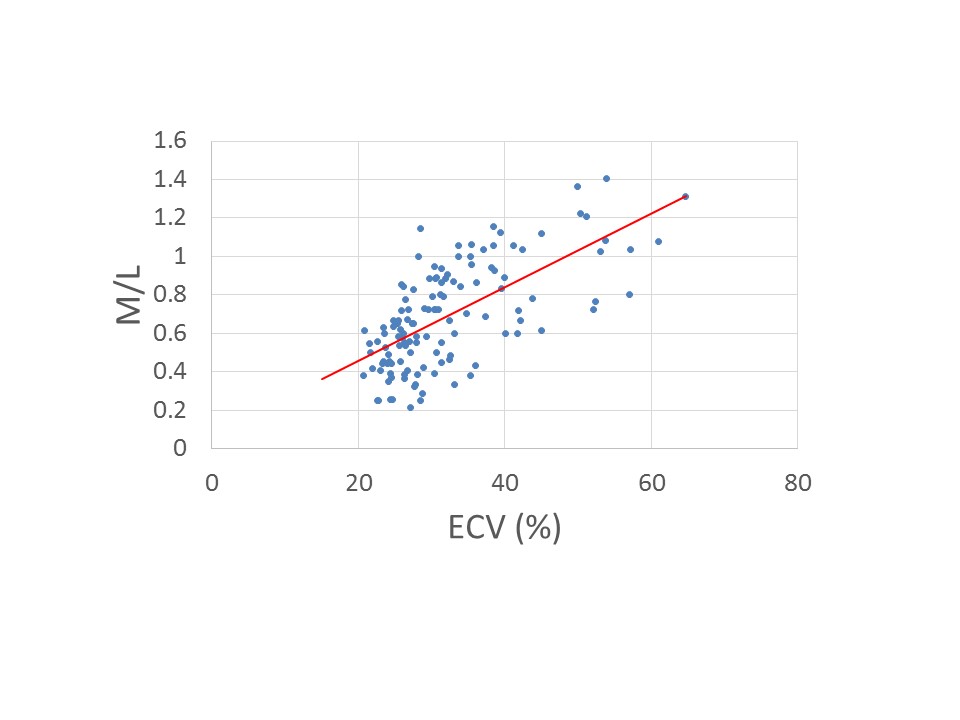
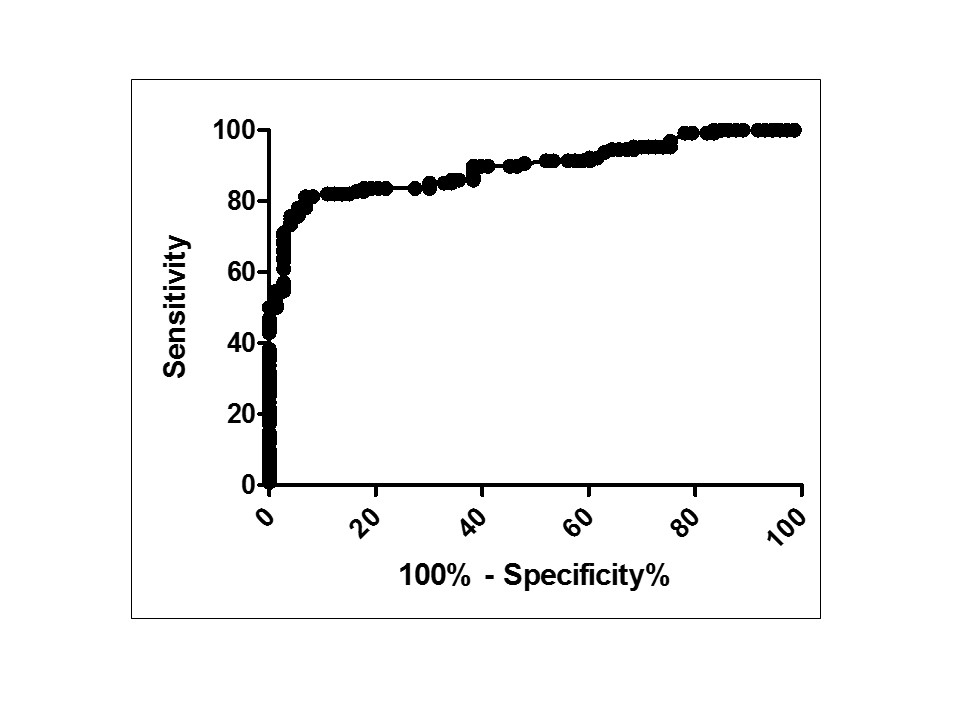
Figure 3 shows the mean M/L of the normal myocardium, all patients with non-ischemic cardiomyopathies, and LGE-positive and LGE-negative patients. LGE-negative patients showed higher M/Ls than what were seen in a normal myocardium (p<0.01). The M/L was significantly correlated with the ECV obtained by the T1 map (r = 0.66, p<0.0001, Figure 4). The cut-off value for M/L to differentiate between a normal myocardium and non-ischemic cardiomyopathies was 0.42 (specificity 84%, sensitivity 82%, area under the curve 0.89, Figure 5).Discussion
The results of this study demonstrated that the M/L shows acceptable levels of correlation with the T1 mapping-derived ECV, which is proportional to tissue concentration of gadolinium and effective for quantifying tissue enhancement. Our study revealed a strong linear relationship between the T1-map-based ECV and histological fibrosis by endomyocardial biopsy, which is an important finding because it indicates that ECV is suitable for stratifying patients based on their myocardial fibrosis volume fraction. 4 From these findings, M/L allows the detection of fibrotic change in non-ischemic cardiomyopathies via conventional LGE images with fixed inversion times. Furthermore, myocardium that appeared to be unenhanced in the LGE images showed a higher M/L than normal myocardium, suggesting that M/L could detect diffuse fibrotic changes that are difficult to assess visually with only conventional LGE. Future work will focus on putting this simple quantification using M/L into practical use such as for differentiation from other myocardial diseases, monitoring of therapeutic effects, and for prognostic information.Conclusion
Our results suggested that the myocardium-to-lumen signal ratio has the potential to allow for simple quantification of fibrotic changes in non-ischemic cardiomyopathies without additional scans and post-processing.Acknowledgements
No acknowledgement found.References
1. Ugander M et al. Extracellular volume imaging by magnetic resonance imaging provides insights into overt and sub-clinical myocardial pathology. Eur Heart J. 2012;33(10):1268-78.
2. Kono AK et al. Dynamic late gadolinium enhancement simply quantified using myocardium to lumen signal ratio: Normal range of ratio and diffuse abnormal enhancement of cardiac amyloidosis. J Magn Reson Imaging. 2011 Jul;34(1):50-5.
3. Morita Y et al. Validation of a Faster Modified Look-Locker Inversion-recovery (MOLLI) method for myocardial T1 mapping on 3T MRI. ISMRM 20th Scientific Meeting and Exhibition 2012.
4. Morita Y et al. Myocardial extracellular volume fraction (ECV) quantified by T1 mapping can detect diffuse myocardial fibrosis in dilated cardiomyopathy (DCM): Comparison with histological collagen volume fraction by endomyocardial biopsy (EMB). ISMRM 24th Scientific Meeting and Exhibition 2016.
Figures
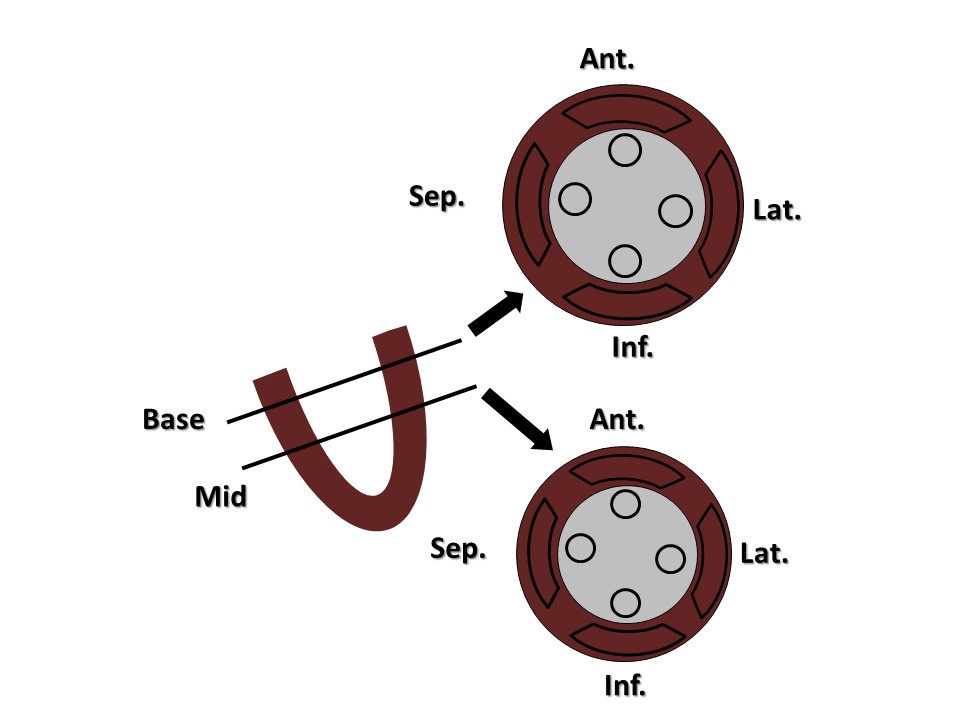
Figure 1. LGE analysis using M/L (mean signal intensity ratio of myocardium to lumen).
The LGE was divided into eight segments: four segments each (anterior, septal, inferior, and lateral wall) at both the basal and mid-ventricular levels. We set fan-shaped ROIs, covering the subendocardium to the subepicardium, in each segment and circular ROIs on the blood pool in the left ventricular lumen close to the myocardium of each segment.