2740
Assessment of myocardial inflammation in cardiac sarcoidosis using early gadolinium enhancement1Department of Radiology, National Cerebral and Cardiovascular Center, Suita, Osaka, Japan, 2Division of Cardiology, National Cerebral and Cardiovascular Center, Suita, Osaka, Japan
Synopsis
In patients with cardiac sarcoidosis, assessment of the activity of myocardial inflammation is as crucial as the choice of therapeutic strategy and monitoring of therapeutic effects. It is known that early gadolinium enhancement (at 2–5 minutes after gadolinium administration) can visualize myocardial inflammation and/or edema such as in acute myocarditis and acute myocardial infarction. In this study, images of gadolinium enhancement at 2 minutes delay were significantly associated with findings regarding active inflammation, suggesting that early gadolinium enhancement has the potential to act as a marker of inflammation activity in cardiac sarcoidosis.
Introduction
In patients with cardiac sarcoidosis, assessment of the activity of myocardial inflammation is as crucial as the choice of therapeutic strategy and monitoring of therapeutic effects. Late gadolinium enhancement (LGE; at 10–20 minutes after gadolinium administration) is able to detect irreversible injury, such as fibrosis/scar, in various myocardial disease, including cardiac sarcoidosis.1 On the other hand, it is known that early gadolinium enhancement (at 2–5 minutes after gadolinium administration) can visualize myocardial inflammation and/or edema, including acute myocarditis2 and acute myocardial infarction.3Purpose
Herein, we evaluated the utility of early gadolinium enhancement for assessment of myocardial inflammation in cardiac sarcoidosis.Methods
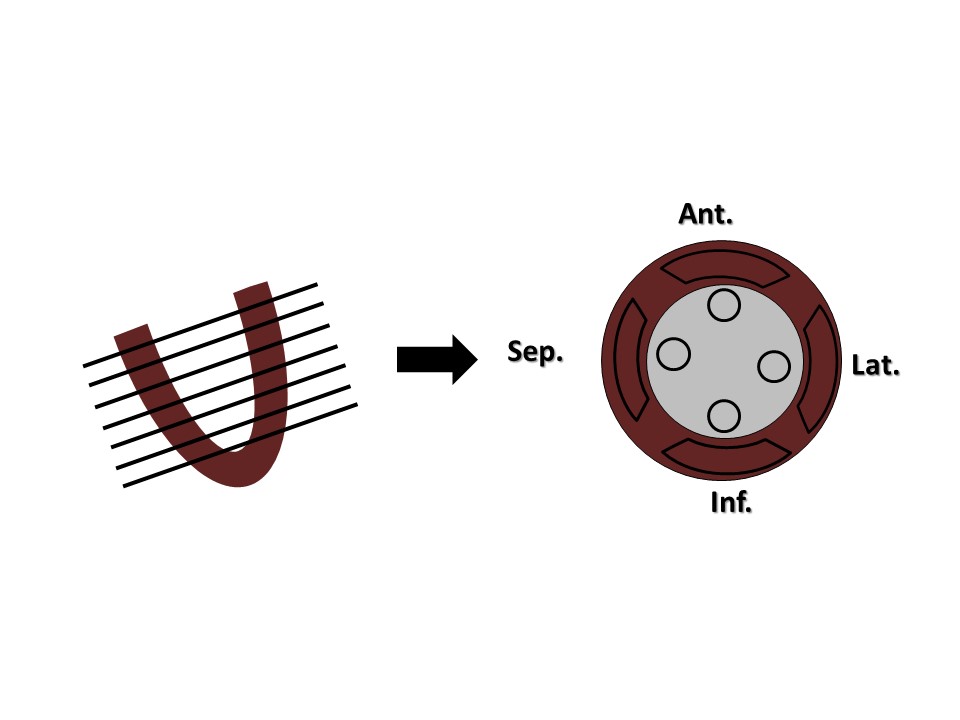
Twenty-six patients with cardiac sarcoidosis underwent gadolinium-enhanced cardiac magnetic resonance imaging (MRI) on a 1.5-T clinical scanner (MAGNETOM Sonata, Siemens Healthcare, Germany). LGE was performed with inversion recovery True-FISP (fixed inversion time, 300 msec) at 2, 5, 10, and 20 minutes after gadolinium administration. LGE imaging was divided into 28 segments (four segments in seven short axial sections; Figure 1). The mean signal intensity ratio of the myocardium to lumen close to each myocardium (M/L) was measured in 2- and 10-minute delayed images as an index of contrast enhancement.4 18F-FDG PET was also performed in all patients within 7 days of MRI and the positive or negative of FDG uptake in each segment was determined visually by two experienced observers.Results
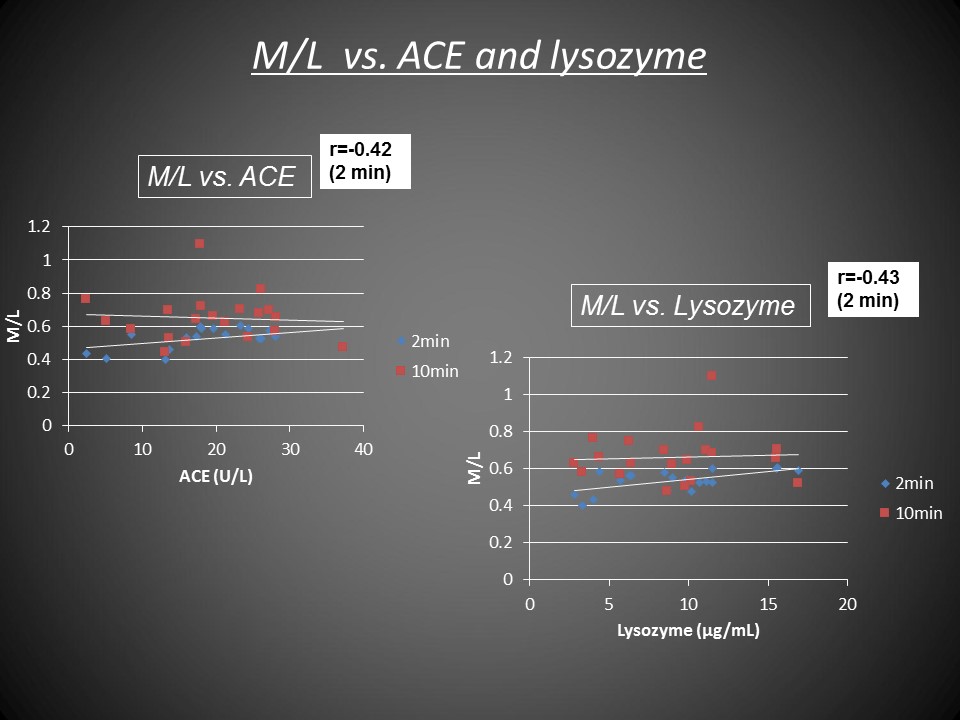
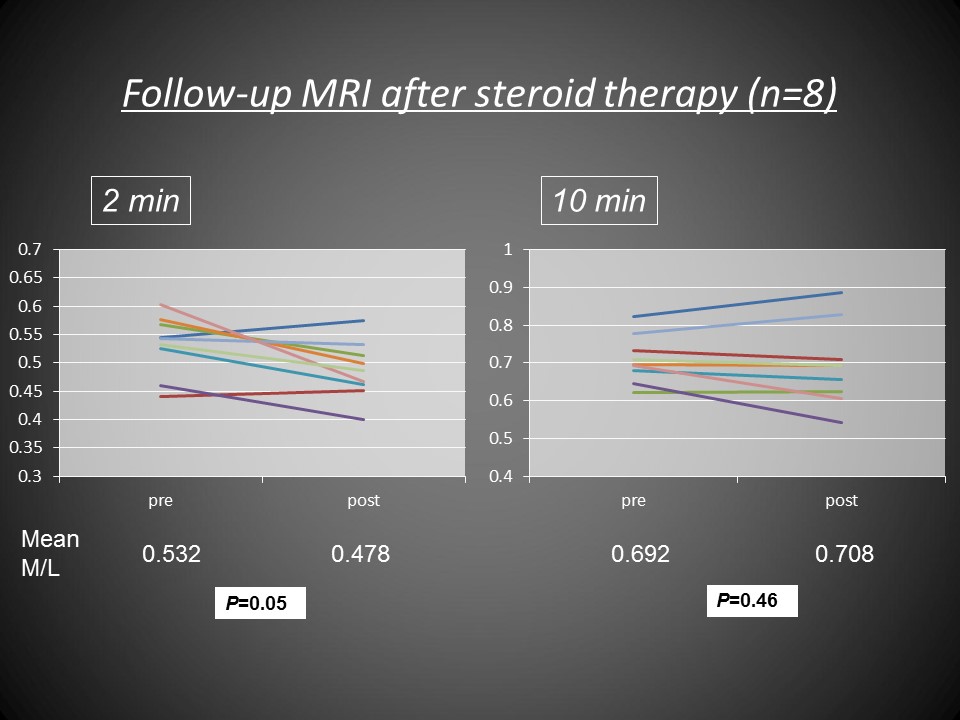
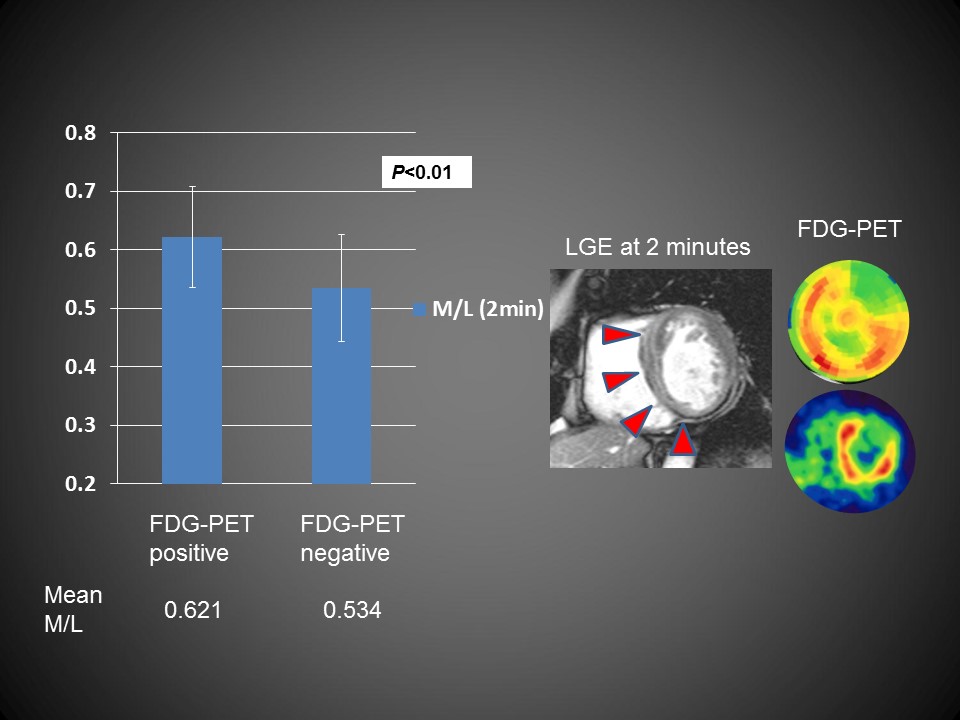
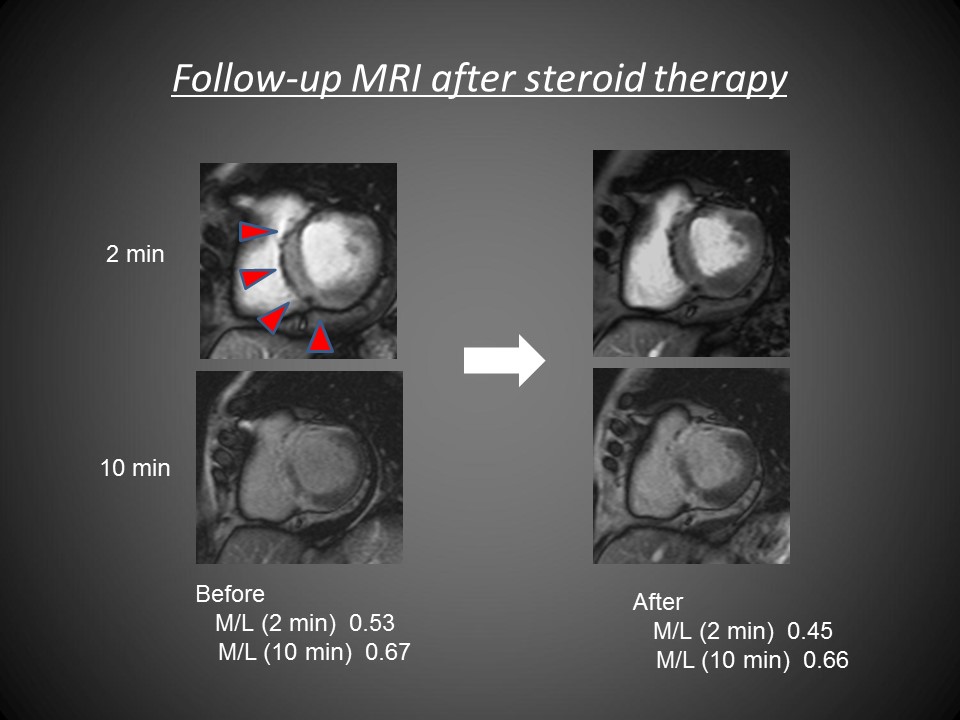
Mean M/L in the 2- and 10-minute delayed images were 0.54±0.05 and 0.65±0.012, respectively. Mean M/L at 2 minutes showed a modest correlation with serum markers associated with activity of inflammation (ACE: r=0.42, lysozyme: r=0.43; Figure 2). Mean M/L at 2 minutes significantly decreased after steroid therapy, while M/L at 10 minutes remained unchanged (Figure 3). The positive segments of FDG uptake showed higher M/L at 2 minutes than the negative segments, and 24 patients (92%) had full or partial concordance in visual assessment between early gadolinium enhancement and 18F-FDG PET (Figure 4).Discussion
In this study, early gadolinium enhancement was significantly associated with FDG uptake and serum markers for activity of inflammation. It is widely known that a high T2 signal abnormality indicates myocardial edema due to active inflammatory cell injury. However, spin-echoT2-weighted imaging is sometimes degraded by motion artifact and arrhythmia, while early gadolinium enhancement is considered to be less sensitive to motion artifact and arrhythmia due to T1-shortening by gadolinium. In the inflamed area, blood volume increases due to hyperemia and the extracellular space enlarges due to tissue edema. Because gadolinium-based contrast agents distribute quickly within the interstitial space during the early vascular phase, contrast-enhanced T1-weighted imaging during this time can be used to detect myocardial inflammation.2Conclusion
M/L in 2-minute delayed images were significantly associated with findings regarding active inflammation, suggesting that early gadolinium enhancement has potential as a marker of inflammation activity in cardiac sarcoidosis.Acknowledgements
No acknowledgement found.References
1. Patel MR, Cawley PJ, Heitner JF, et al. Detection of myocardial damage in patients with sarcoidosis. Circulation. 2009;120(20):1969–1977.
2. Friedrich MG, Sechtem U, Schulz-Menger J, et al. Cardiovascular Magnetic Resonance in Myocarditis: A JACC White Paper. J Am Coll Cardiol. 2009;53(17):1475–1487.
3. Morita Y, Yamada N, Noguchi T, et al. Late gadolinium enhancement can visualize the periinfarct zone in acute myocardial infarction. Joint Annual Meeting ISMRM-ESMRMB 2010. Proc Intl Soc Mag Reson Med. 2010;18:1286.
4. Kono AK, Yamada N, Higashi M, et al. Dynamic late gadolinium enhancement simply quantified using myocardium to lumen signal ratio: normal range of ratio and diffuse abnormal enhancement of cardiac amyloidosis. J Magn Reson Imaging. 2011;34(1):50–55.
Figures