2739
Non-contrast T1 mapping can detect myocardial fibrosis in hypertrophic cardiomyopathy without gadolinium. Is native T1 a superior alternative to late gadolinium enhancement?1Department of Radiology, National Cerebral and Cardiovascular Center, Suita, Osaka, Japan, 2Division of Cardiology, National Cerebral and Cardiovascular Center, Suita, Osaka, Japan
Synopsis
Native T1 mapping is a novel cardiac magnetic resonance technique for myocardial tissue characterization without contrast administration. Native T1-mapping in hypertrophic cardiomyopathy was correlated with T1 map-based extracellular volume fraction, and native T1 of apparently late gadolinium enhancement (LGE)-negative segments were significantly longer than normal myocardium. Therefore, native T1 mapping has the potential to quantify the volume of interstitial space without gadolinium, which would be useful particularly in patients who are limited in use of gadolinium. Furthermore, native T1 would be a useful biomarker for the detection of diffuse myocardial damage difficult to evaluate using conventional LGE alone.
Introduction
Late gadolinium enhancement (LGE) is a widely used method to visualize myocardial fibrosis in various cardiomyopathies. Recently, myocardial T1 mapping has allowed direct myocardial signal quantification in non- and post-contrast conditions and has shown potential for better characterization of myocardial tissue composition. Furthermore, myocardial T1 mapping has been applied to quantify the extracellular volume fraction (ECV) using non- and post-contrast T1 in myocardium and blood.1 Both LGE and ECV require gadolinium contrast; however, in clinical use, patients with renal insufficiency, an allergic reaction to contrast agents, asthma, or other such issues are at higher risk of complications during gadolinium administration.Purpose
Herein, we evaluated the utility of non-contrast T1 mapping (native T1 mapping) using a faster Modified Look-Locker Inversion-recovery (Fast-MOLLI) method for assessment of myocardial fibrosis in patients with hypertrophic cardiomyopathy (HCM) in comparison with LGE and ECV.Methods
Twenty-two patients with HCM underwent gadolinium-enhanced cardiac magnetic resonance imaging using a 3-T clinical scanner (MAGNETOM Verio, Siemens AG Healthcare Sector, Erlangen, Germany). Fast-MOLLI was performed in short-axial slices at the basal and mid-ventricular level with pre- and post-contrast over 21 minutes. Fast-MOLLI was implemented as a two inversion recovery (IR) sequence with the first of three and the second of five consecutive image acquisitions, decreasing the acquisition time by about one-third compared with the original MOLLI method.2 The T1 map was reconstructed using eight source images with different inversion times. SSFP (True-FISP) sequence was used for readout (single-slice, single-shot, TE/TR=1.1/2.5 msec, flip angle 35°, FOV 320x223 mm, matrix 192x256, and slice thickness 8 mm). The T1 map was divided into six segments in each slice, and fan-shaped regions of interest (ROIs) were set in each segment (Figure 1). Then, a segment-based T1 was measured for each ROI. The ECV was quantified according to the following formula: ECV=λ x (1 – hematocrit), where λ=⊿R1myocardium/⊿R1bloodpool (⊿R1: the change of R1 (=1/T1) between pre- and post-contrast). The pre- and post-contrast T1 map was used for automatic reconstruction of the ECV map with a dedicated software (MapMaker prototype®, Medis, Netherlands) (Figure 2). The ECV map was also divided into six segments in each slice. Segment-based ECV values were measured. LGE was also performed with IR True-FISP (fixed inversion time=350 msec) 10 minutes after gadolinium administration. The presence or absence of LGE was decided visually for each segment.Results
The mean native T1 and ECV of myocardium in HCM were 1292±74 msec and 34.3%, respectively. Figure 3 shows the mean native T1 and ECV of LGE-positive and -negative myocardium in HCM, compared with normal myocardium (native T1: 1146±43 msec, ECV: 26.0%).3 Native T1 of apparently LGE-negative segments, as well as of LGE-positive segments, was significantly longer and ECV was significantly higher than the respective values for normal myocardium. Native T1 was significantly correlated with ECV obtained by T1 mapping (r=0.65, p<0.0001) (Figure 4). The cut-off value for native T1 to differentiate between LGE-positive and -negative segments was 1289 msec (specificity 78%, sensitivity 81%, area under the curve 0.88).Discussion
The present results demonstrate that native T1 in HCM is well correlated with T1 map-based ECV in proportion to tissue concentration of gadolinium and is effective for the quantification of tissue enhancement. Our previous study revealed a strong linear relationship between the T1 map-based ECV and histological fibrosis by endomyocardial biopsy; this is an important finding, as it implies that ECV is appropriate for patient stratification based on their myocardial fibrosis volume fraction.3 From these findings, native T1 mapping could detect the fibrotic change in HCM without the administration of contrast media. Furthermore, the apparently unenhanced myocardium in LGE images showed a longer native T1 than normal myocardium, suggesting that native T1 could detect a diffuse fibrotic change difficult to evaluate by LGE alone. A recent study showed that non-contrast T1 values correlated significantly with phosphocreatine-to-ATP ratio in magnetic resonance spectroscopy, indicating that native T1 mapping could be affected by additional changes such as the cardiomyocyte energetic state.4 Future work will focus on the clinical performance of non-contrast T1 mapping such as differentiation between myocardial diseases, monitoring of the therapeutic effect, and provision of prognostic information.Conclusion
Native myocardial T1 mapping using Fast-MOLLI has the potential to quantify the volume of interstitial space without the need for gadolinium, which would be useful particularly in patients with a high risk of adverse reactions to gadolinium. Furthermore, native T1 would be a useful and practical biomarker for the detection of diffuse interstitial fibrosis, which is difficult to evaluate using conventional LGE images alone.Acknowledgements
No acknowledgement found.References
1. Ugander M, Oki AJ, Hsu LY, et al. Extracellular volume imaging by magnetic resonance imaging provides insights into overt and sub-clinical myocardial pathology. Eur Heart J. 2012;33(10):1268–1278.
2. Morita Y, Yamada N, Noguchi T, et al. Validation of a Faster Modified Look-Locker Inversion-recovery (MOLLI) method for myocardial T1 mapping on 3T MRI. ISMRM 20th scientific meeting and exhibition 2012, 5–11 May, 2012, Melbourne, Australia.
3. Morita Y, Yamada N, Tateishi E, et al. Myocardial extracellular volume fraction (ECV) quantified by T1 mapping can detect diffuse myocardial fibrosis in dilated cardiomyopathy (DCM): Comparison with histological collagen volume fraction by endomyocardial biopsy (EMB). ISMRM 24th scientific meeting and exhibition 2016, 7–13 May, 2016, Singapore.
4. Dass S, Suttie JJ, Piechnik SK, et al. Myocardial tissue characterization using magnetic resonance noncontrast t1 mapping in hypertrophic and dilated cardiomyopathy. Circ Cardiovasc Imaging. 2012;5(6):726–733.
Figures
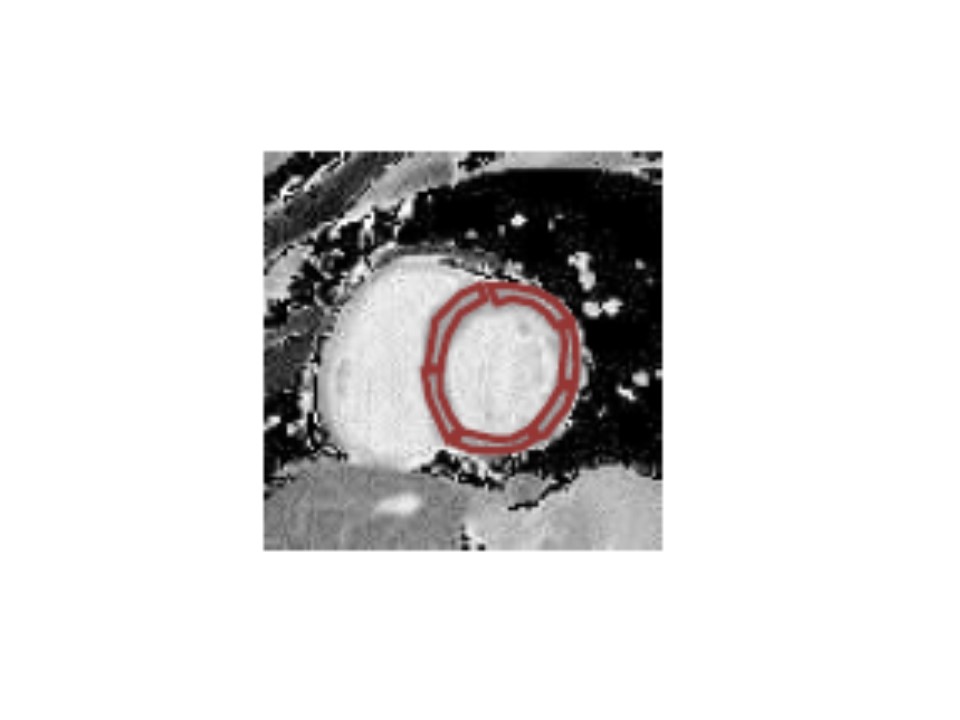
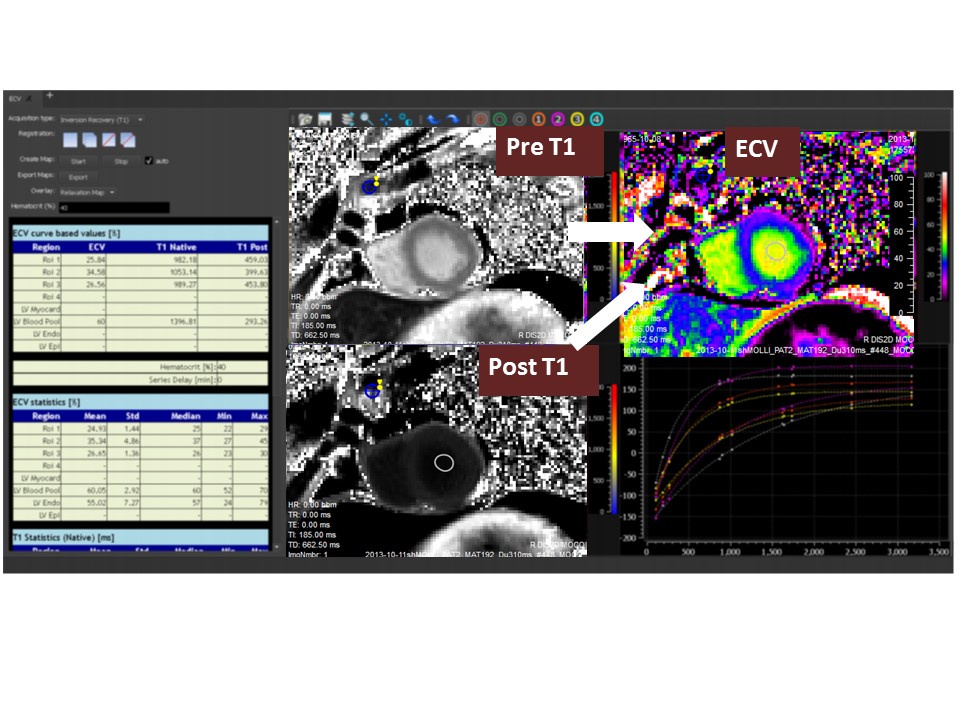
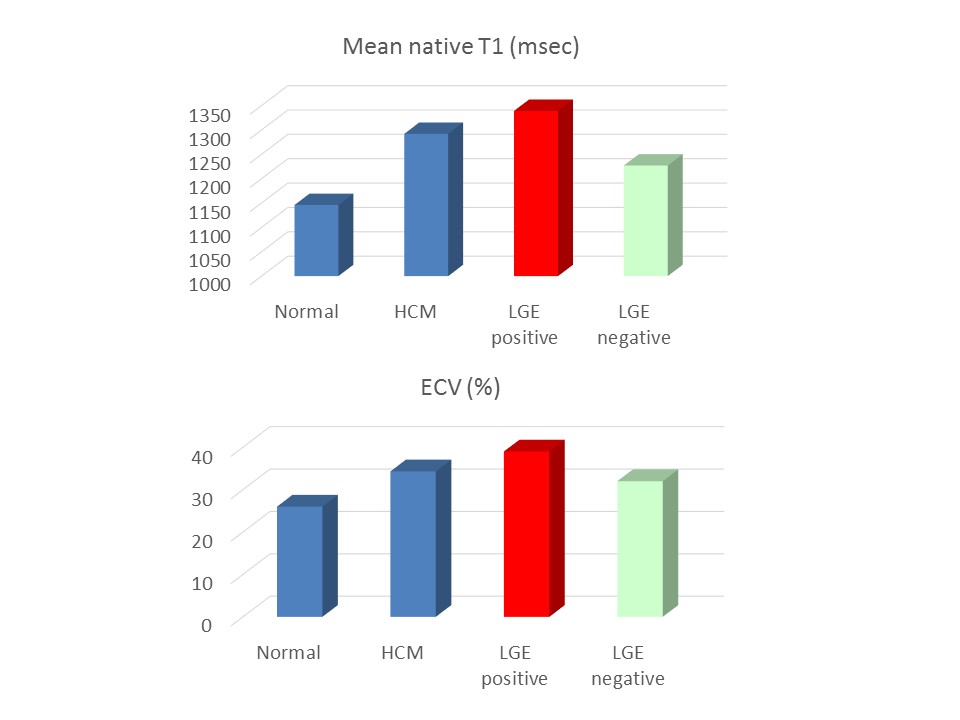
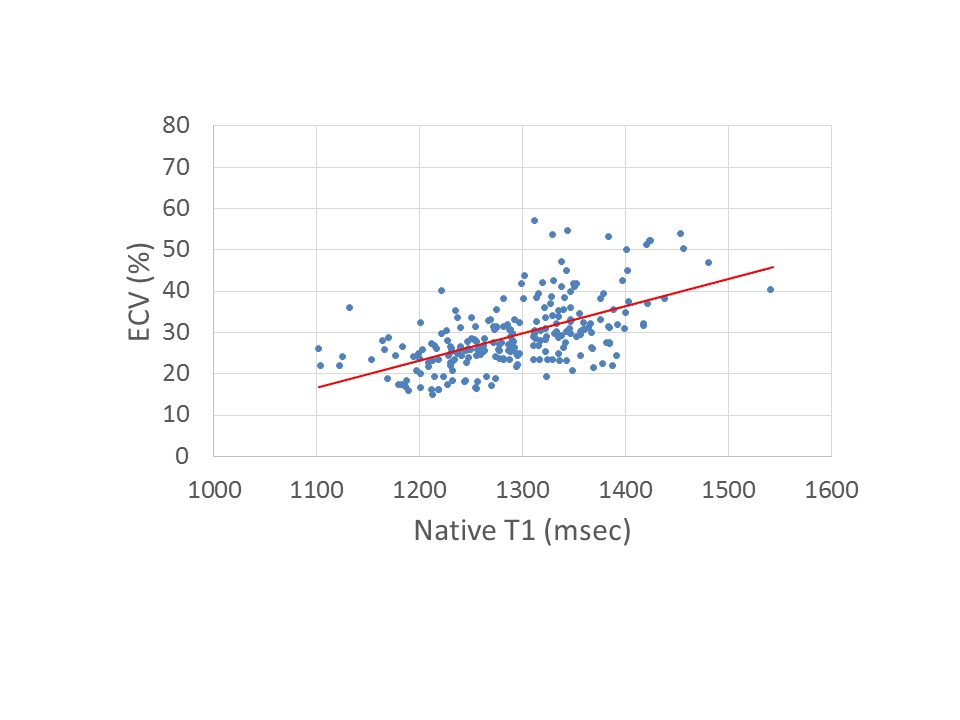
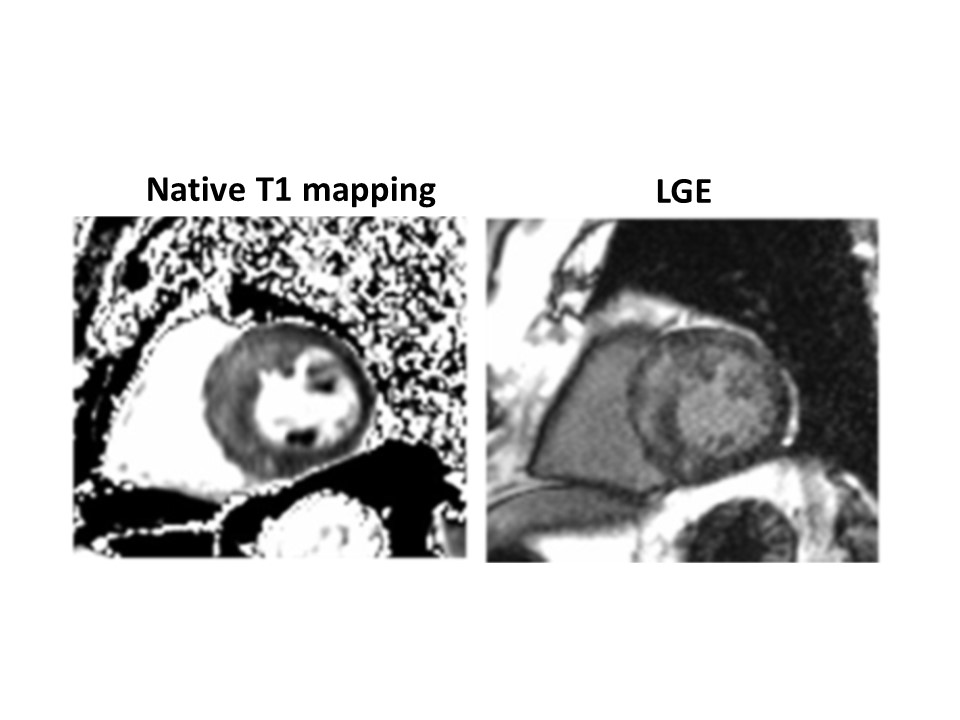
Figure 5. Representative case of hypertrophic cardiomyopathy.
The septal wall with asymmetric hypertrophy shows high T1 on native T1 mapping, suggesting myocardial fibrosis. “Hyperintensity area” on native T1 mapping is visually similar to hyper-enhancement on the late gadolinium enhancement image.