2735
T1 Errors from Off-Resonance Effects for MOLLI at 3T: Experience in a Clinical Study1Biomedical Engineering, University of Alberta, Edmonton, AB, Canada, 2Medicine, University of Alberta, Edmonton, AB, Canada, 3Medicine, University of Calgary, Calgary, AB, Canada
Synopsis
The widely used MOLLI (MOdified Look-Locker Inversion recovery) T1 mapping approach underestimates T1 values as a function of several factors, including off-resonance frequency. Native T1 and matched off-resonance frequency (Δω) maps were acquired in 24 subjects as part of a study of patients with kidney disease (3T field strength). Δω within individuals had an average range 133±43Hz, and Δω was significantly correlated with underestimation of native T1, in good agreement with Bloch equation simulations. ~50% of slices had relatively large (75-150 Hz) off-resonance frequencies, for which T1 errors ranged from -25ms to -150ms.
Purpose
Measure the distribution of myocardial off-resonance frequencies and the associated distribution of errors in T1 with the MOLLI T1-mapping method at 3T.Methods
Background: The widely used MOLLI (MOdified Look-Locker Inversion recovery) T1 mapping approach1 underestimates T1 values as a function of several factors, including off-resonance frequency2. These effects are more important at higher field strengths, where magnetic susceptibility effects on B0 homogeneity are enhanced, with larger ranges of off-resonance frequencies in the heart (Noeske et. al. reported a range of ±130Hz at 3T)3.
Approach: Off-resonance frequency (Δω) maps and spatially matched native T1 maps (MOLLI) were acquired to determine the range of myocardial off-resonance frequencies at 3T in a clinical study and to determine if there is a significant associated systematic underestimation of native myocardial T1.
Study Population: Δω and MOLLI T1 mapping were included in a CMR study of patients with kidney disease undergoing routine hemodialysis (N = 24).
MRI Acquisition: Native (non-contrast) MOLLI T1 and off-resonance imaging was performed on mid-ventricular and basal short axis slices (3T PRISMA; Siemens Healthcare; Erlangen, Germany). Pulse sequence parameters for MOLLI acquisitions (TE=0.9ms, TR=2.5ms, 35°flip, 224x104 matrix, 360 mm FOV, 8mm slice, 5(3)3 acquisition scheme). For imaging of Δω, a gated and segmented multi-echo gradient-echo sequence used matched spatial resolution, slice location and cardiac phase (TE=[2.08;2.25;6.82] ms, TR=8.80ms, 9 views/segment, 30°flip, 224x104 matrix, 360 mm FOV, 8mm slice). Identical center frequency and shim settings were maintained for the T1 and Δω imaging acquisitions.
Analysis: T1 and Δω pixel maps were reconstructed for all slices in
all subjects. Δω in each pixel was calculated from the slope of
phase versus TE from multi-echo images. Endocardial
and epicardial tracings were used to define a thin mid-ventricular region for
T1 and Δω analysis in both short axis slices, with
segmentation into 18 circumferential regions. Tracings were copied from T1 maps
to GRE magnitude images and manually shifted to account for breath-hold
position differences, before being applied to the Δω pixel map. Mean T1 and Δω
values were calculated for each segment. The range of myocardial off-resonance
frequencies (Δω(max) - Δω(min)) and the global offset frequency for all
segments, Δω(ave), were measured in each subject. In individual
slices with any Δω values >75 Hz, the native T1 and Δω values in each of 18 circumferential segments
were included in an evaluation of Δω versus T1.
Specifically, the mean T1 value in each slice from segments with
-50Hz< Δω<50Hz (i.e. segments with small off-resonance
effects) was subtracted from all segmental values to yield ΔT1 values in each segment. This correction enabled a comparison of the
potential offset in T1 resulting from Δω, and to allow all subject data to be grouped,
independent of globally increased or decreased T1 values.
Results
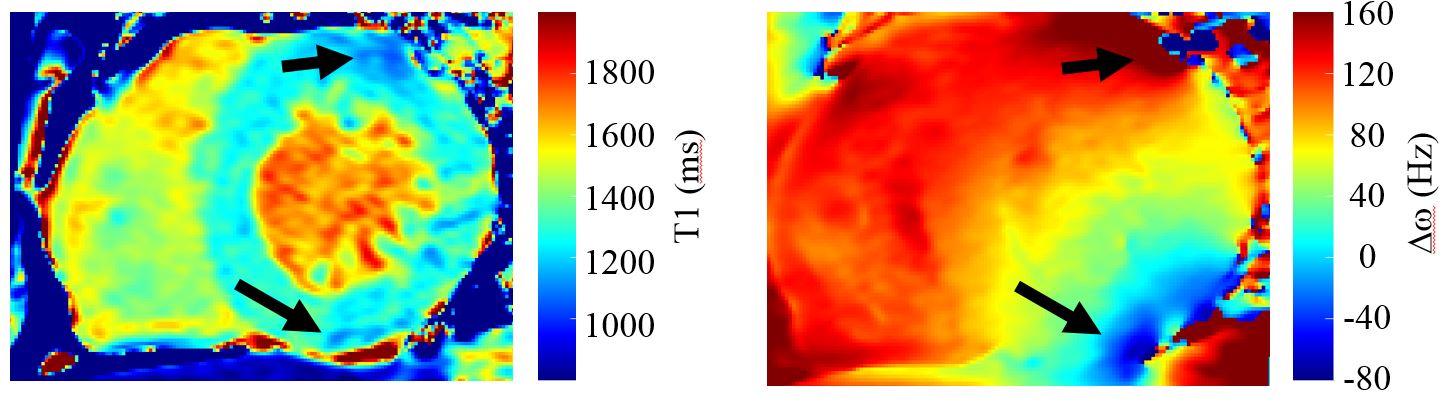
Fig. 1 shows representative T1 and Δω maps from a study subject.
From all subjects, the average range of Δω values was 133±43Hz, with a maximum range of 216Hz and a
minimum of 44Hz, in individuals. The average whole-slice off-resonance
frequency was 12±43Hz, with a range from -100Hz to +96
Hz (i.e. the offset of the center frequency from the average frequency in the
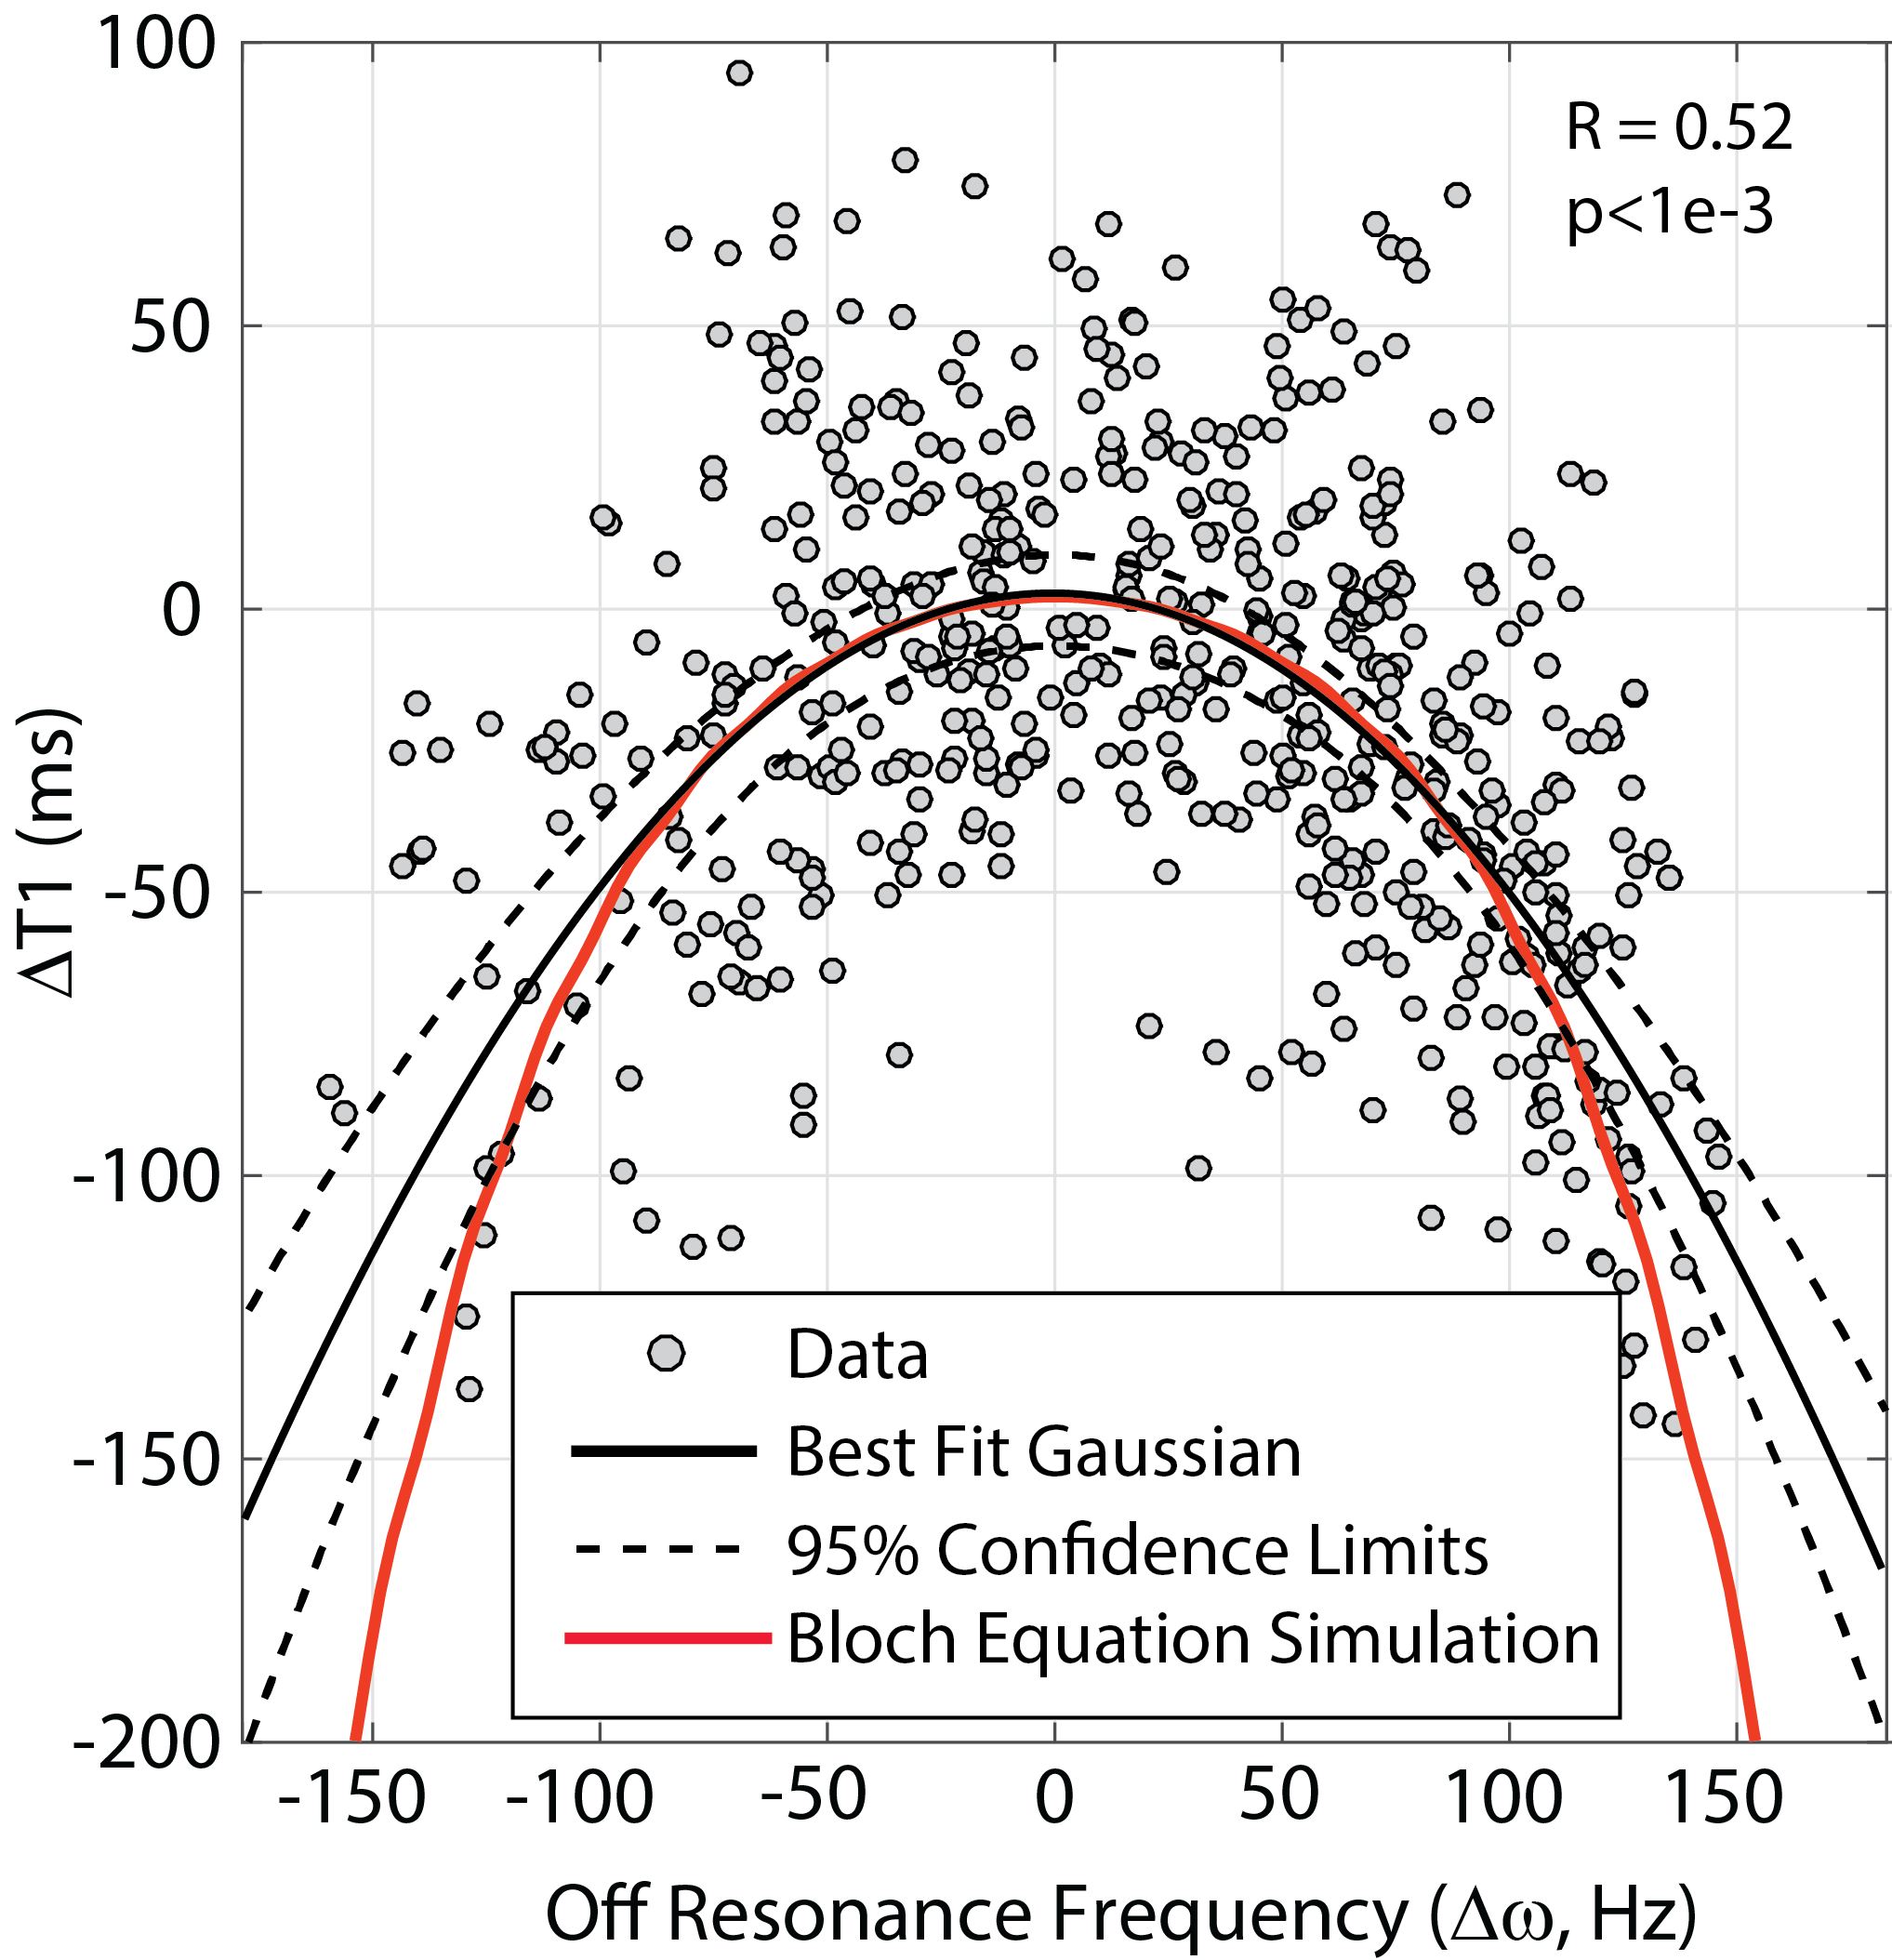
slice). 52% of short axis slices contained segments with Δω>75 Hz and Fig. 2 shows a scatter plot of ΔT1 versus Δω for all segments in these slices. The black curve shows a best-fit Gaussian
with 95% confidence interval for the fit, while the red curve shows the
predicted off-resonance dependence of T1 for MOLLI from Bloch equation
simulations, for an assumed native T1 of 1500ms at 3T4.
Discussion
Cardiac MR studies are increasingly performed at 3T, which has the disadvantage (as compared to 1.5T) of larger ranges of myocardial off-resonance frequencies (Δω). The off-resonance dependence of MOLLI T1 values is known2; the current study illustrated the range of myocardial Δω values in a small clinical study, with an average range of 133Hz within a given heart and a range of ±100Hz for the global offset of the (whole heart) average frequency over the 24 subjects. A significant association between Δω and reduced T1 values was shown, in good agreement with Bloch equation simulations. While inferior and anterolateral segments were more often affected regionally for Δω offsets (as exemplified in Fig. 1), when combined with global errors in off-resonance, any segment can be affected, with the result being a potential underestimation of T1.Conclusion
Underestimation of MOLLI native T1 values as a consequence of myocardial off-resonance frequencies, from a combination of local B0 inhomogeneity and global shift in off-resonance frequency, are not uncommon at 3T.Acknowledgements
We acknowledge the tireless efforts of Sue Szigety.References
1. Messroghli DR, Radjenovic A, Kozerke S, Higgins DM, Sivananthan MU and Ridgway JP. Modified Look-Locker inversion recovery (MOLLI) for high-resolution T1 mapping of the heart. Magn Reson Med. 2004;52:141-6.
2. Kellman P, Herzka DA, Arai AE and Hansen MS. Influence of Off-resonance in myocardial T1-mapping using SSFP based MOLLI method. J Cardiovasc Magn Reson. 2013;15:63.
3. Noeske R, Seifert F, Rhein KH and Rinneberg H. Human cardiac imaging at 3 T using phased array coils. Magn Reson Med. 2000;44:978-82.
4. Teixeira T, Hafyane T, Stikov N, Akdeniz C, Greiser A and Friedrich MG. Comparison of different cardiovascular magnetic resonance sequences for native myocardial T1 mapping at 3T. J Cardiovasc Magn Reson. 2016;18:65.
Figures