2733
Off-resonance correction in myocardial T1-mapping using Bloch simulations of the MOLLI sequence1Fondazione Toscana "G. Monasterio", Massa, Italy, 2Fondazione Toscana "G. Monasterio", Pisa, Italy, 3CNR Institute of Clinical Physiology, Pisa
Synopsis
Myocardial T1 mapping using MOLLI is influenced by off-resonance effects that lead to underestimation of T1. In this study a method for the correction of the off-resonance influence on T1 mapping, based on the Bloch simulations of the MOLLI sequence, is proposed. In vivo results on a healthy population (N=67) showed that the regional variation of T1 is highly correlated with the distribution of the off-resonance. The proposed method effectively reduced the artifactual T1 underestimation due to off-resonance, especially in myocardial segments that exhibited elevated B0 inhomogeneities.
Introduction
Myocardial T1 mapping using MOLLI has been shown to be affected by regional differences in segmental T1 values1. In particular, B0-inhomogeneities lead to underestimation of T1 due to the transient approach to steady state during the SSFP readout of the MOLLI2. In this study we propose a method for the correction of the off-resonance influence on T1 mapping using Bloch simulations of the MOLLI sequence.Materials and Methods
Pulse sequence: A MOLLI sequence was implemented on the basis of the original 3-3-5 scheme3. Variable resting periods were adopted to reduce the influence of the heart rate. Imaging parameters were set as follows: FOV 350x290 mm2, in-plane resolution 1.9x1.9 mm2, slice thickness 8 mm, TE/TR 1.2/2.4 ms, flip angle 30°, SENSE factor 2, partial Fourier 0.75. T1 maps were reconstructed offline through pixelwise fitting using a three-parameter-monoexponential model. A multi-fitting approach to magnitude data was adopted to restore correct signal polarity of the images with shortest inversion times. B0-inhomogeneity maps were acquired using a dual-echo gradient-echo sequence with TE1/TE2/TR 2.3/4.6/7.0ms, flip angle 30°.
Off-resonance correction: Bloch simulations were performed to estimate T1 correction factors as the function of the off-resonance. Spin evolution in the MOLLI sequence was simulated using the framework described in 4, taking into account precession and relaxation during b-SSFP readouts. Perfect inversion was assumed. T1 estimation was computed for each spin with T1 ranging from 500 ms to 2500 ms and off-resonance ranging from -200 Hz to +200 Hz. Fig.1a shows the influence of off-resonance on T1 estimation in the simulated MOLLI sequence. T1 underestimation for representative values of T1 and off-resonance are shown in Fig.1b. Simulation results were used to compute T1 correction factors given by the difference ∆T1 between on-resonance and off-resonance T1 estimates .
In vivo experiments: All imaging was performed on a 3T Philips Ingenia MRI system using a 32-channel cardiac coil array. In-vivo data were obtained from 67 healthy subjects with normal findings on routine CMR (M=46, F=21, age=42.5±17.8, heart rate=67.3±9.2), T1 and B0 maps were acquired in a single equatorial short-axis slices in separate breath-holds. Six-segment analysis was performed by manually drawing epicardial and endocardial contours. Non-rigid registration between T1 map and B0 maps was performed using ANTs software5. Image reconstruction and data processing were implemented using Python 2.7.6.
Results
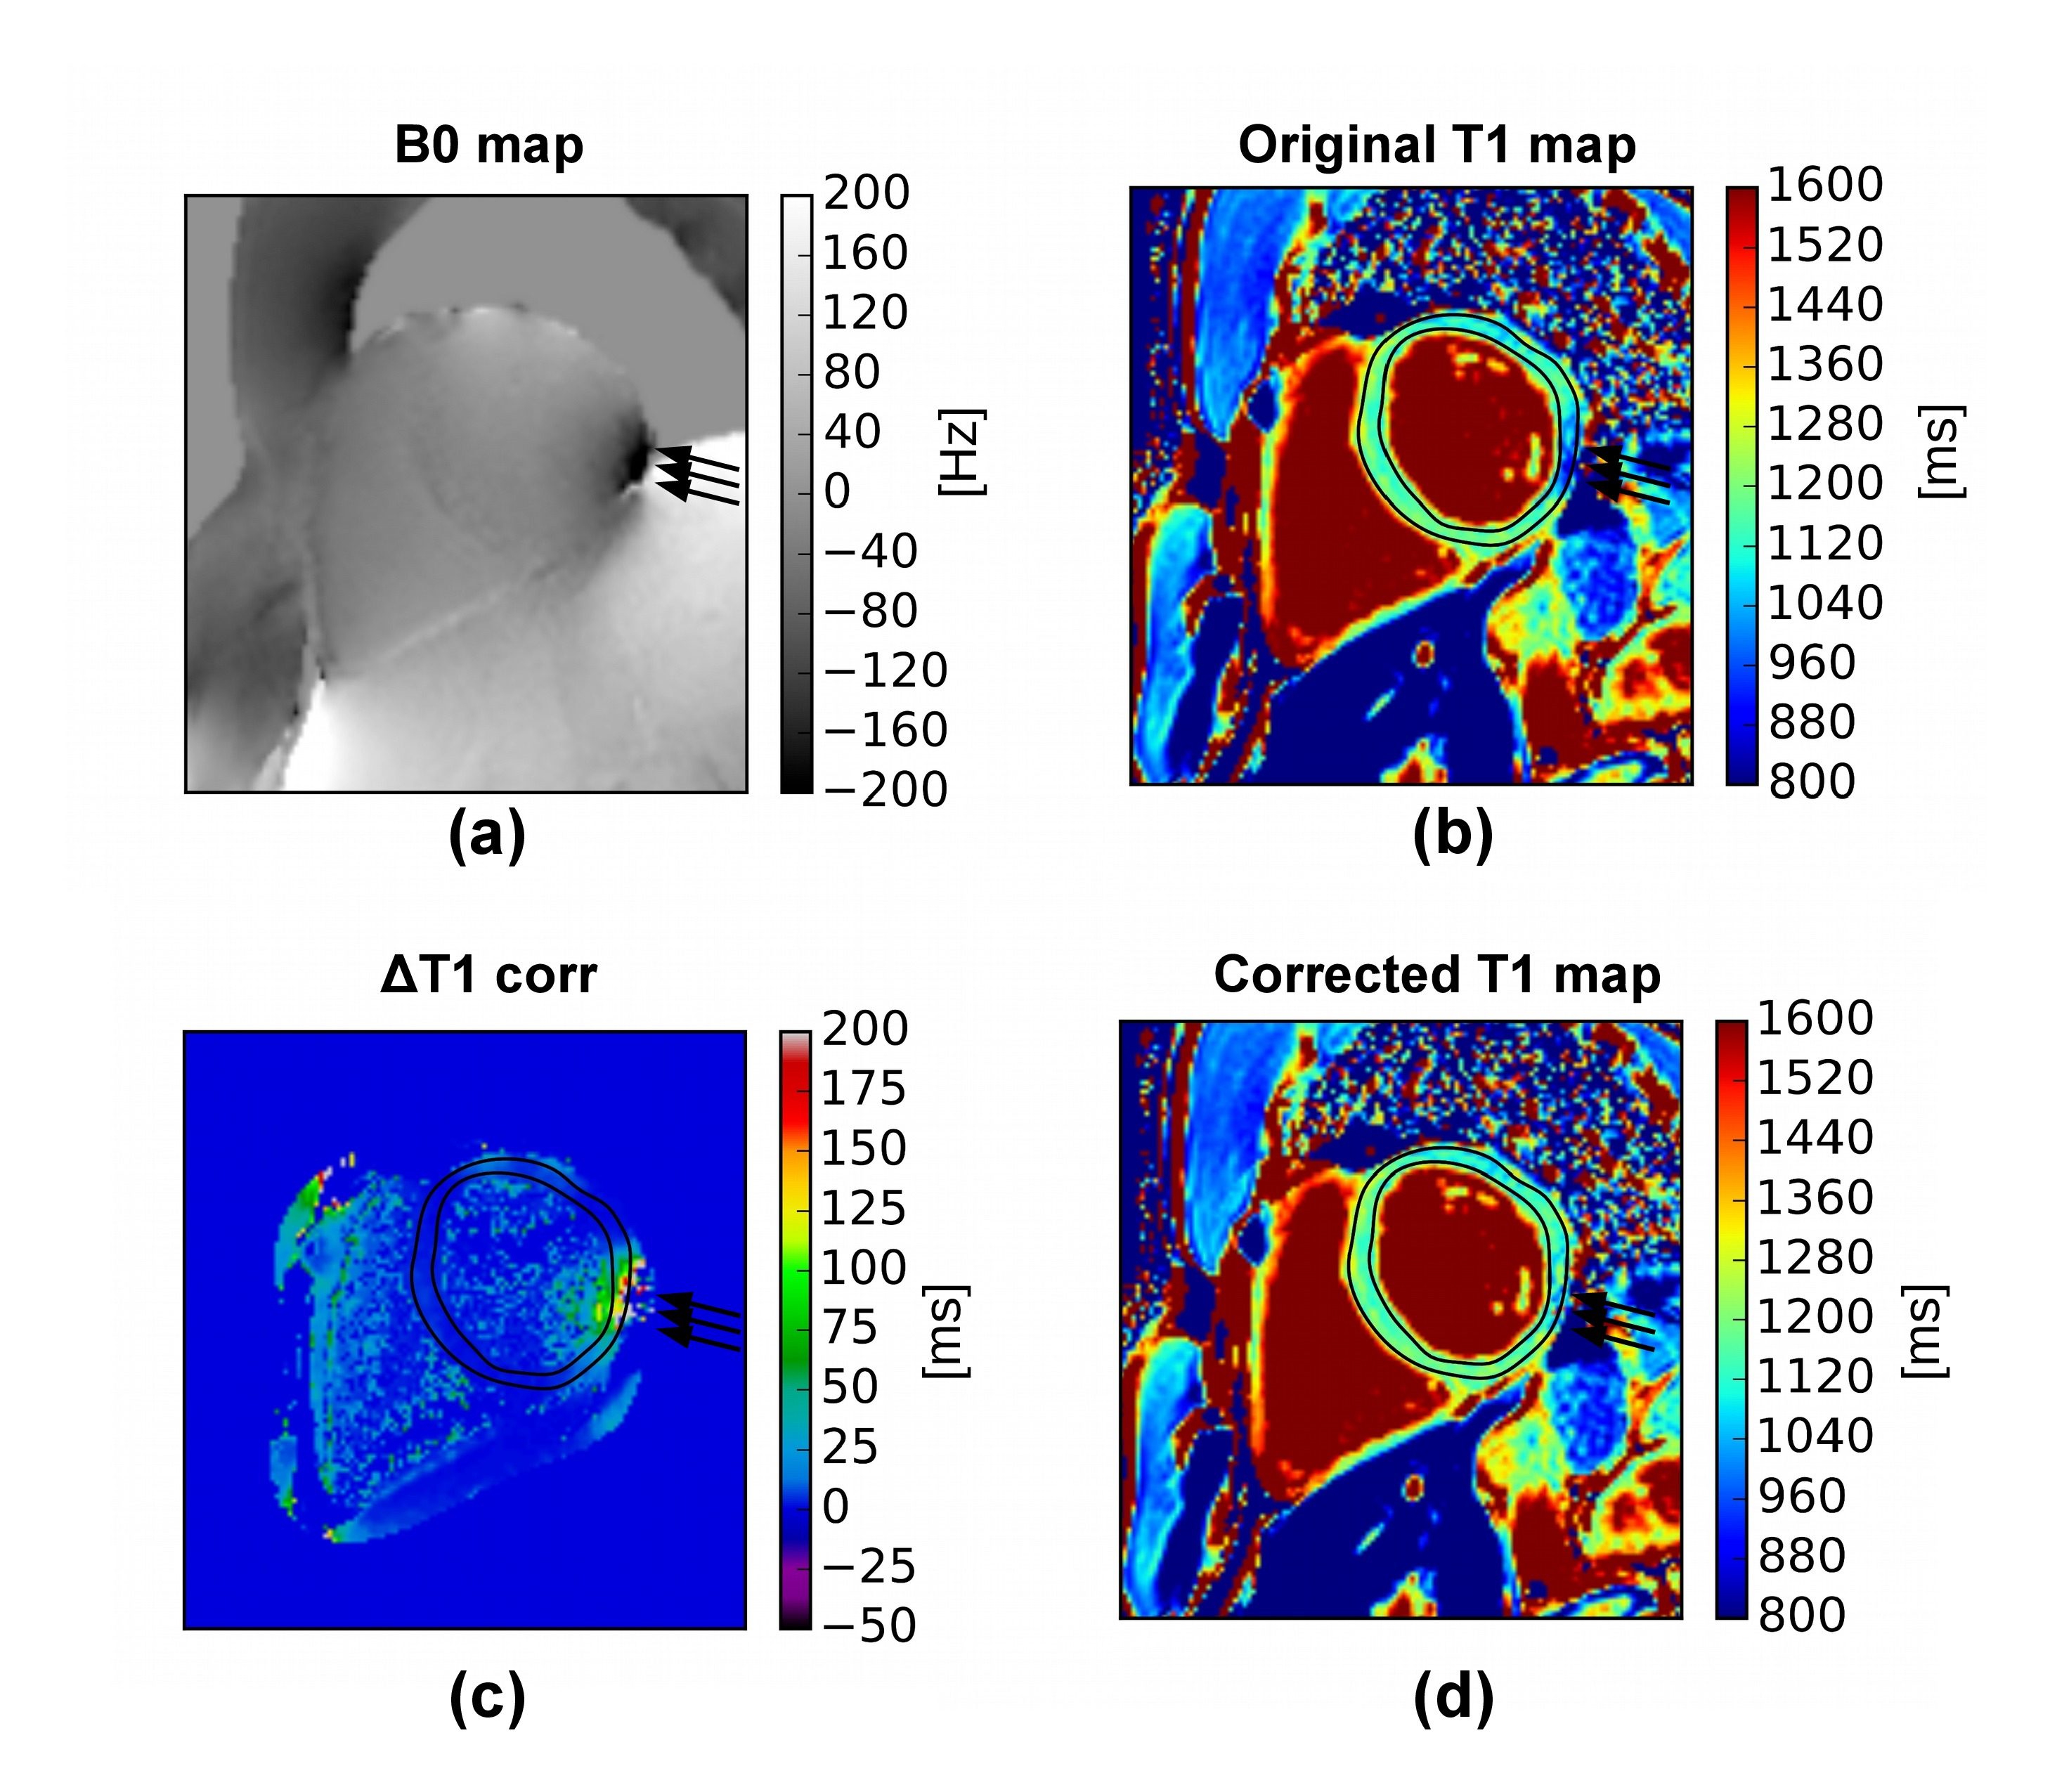
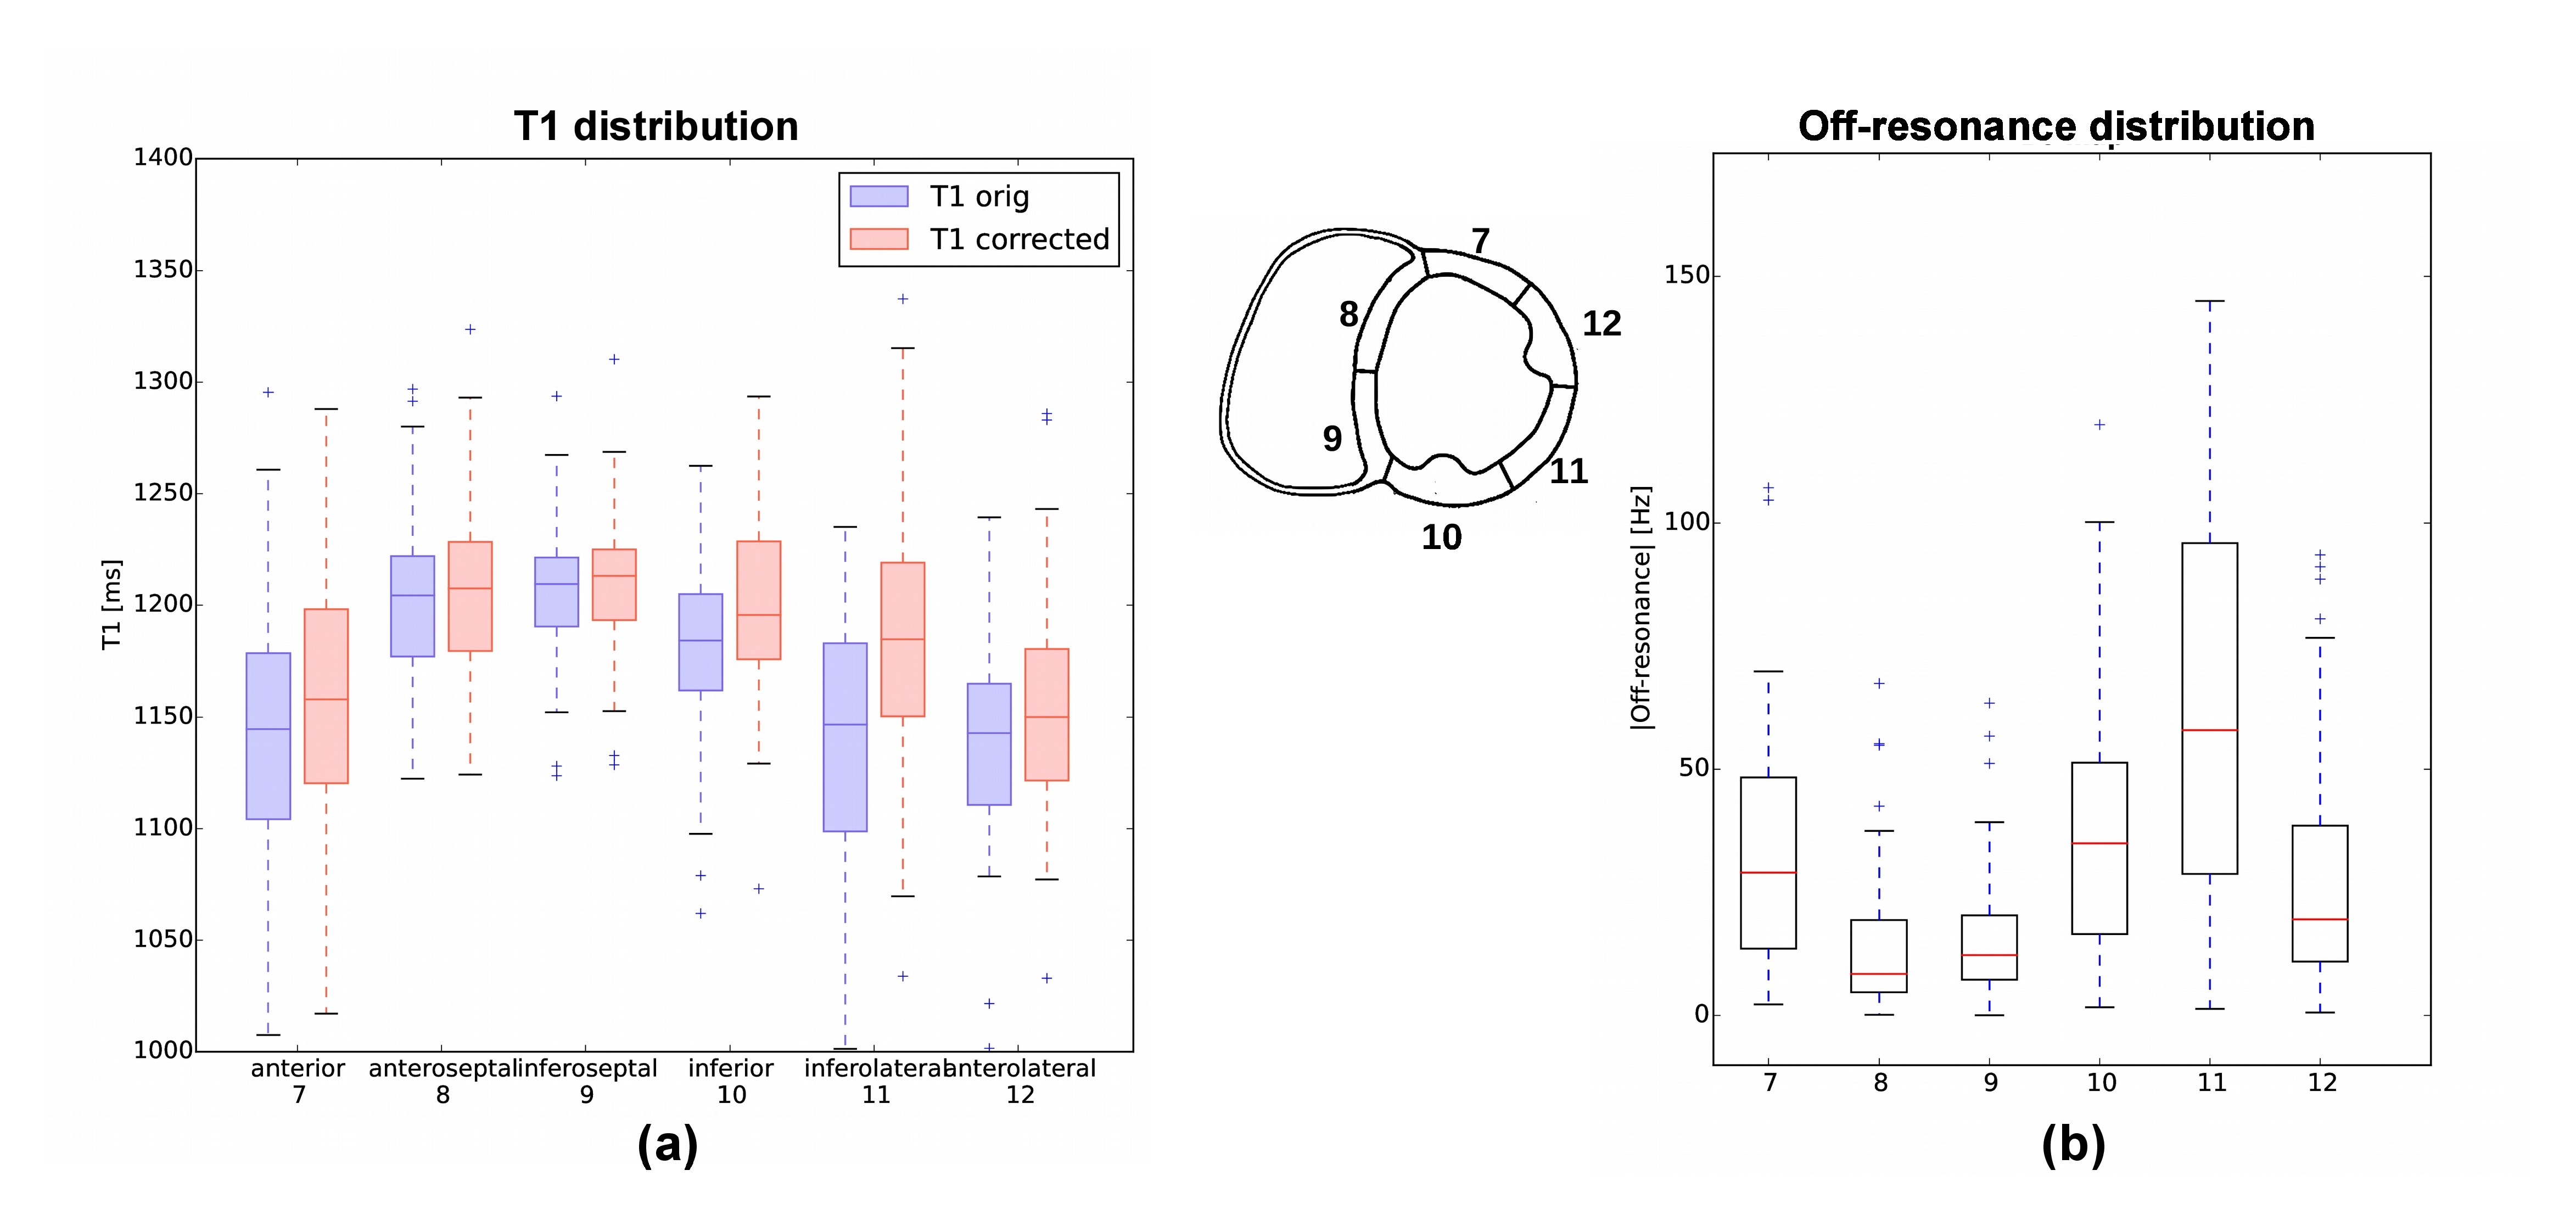
Fig.2 shows an example of the application of the proposed correction method. Measured B0 and T1 values are used in the Bloch simulations to obtain off-resonance corrected T1 maps. The reduction of the T1 underestimation in the inferolateral wall is noticeable. Fig.3a shows the T1 distribution across segments before and after off-resonance correction in the studied population. Global myocardial T1 was significantly increased after off-resonance correction (original vs corrected 1168.6±30.2 ms vs 1184.8±31.0 ms, p-val < 0.005). Regional variation of T1 highly correlated with the distribution of the off-resonance across segments as shown in Fig. 3b. The proposed correction effectively reduced the artifactual T1 underestimation due to off-resonance, especially in the inferolateral segment (original vs corrected 1137.3±59.8 ms vs 1187.9±57.9 ms, p-val < 0.001) where B0 inhomogeneities were found to be particularly elevated (61.8±40.3 Hz).Conclusion
A
novel method for the correction of the off-resonance effects in
myocardial T1 mapping obtained with the MOLLI sequence. In vivo
results on a healthy population showed a significant reduction of the
regional variation of T1 across myocardium. This might increase the
diagnostic accuracy of myocardial T1 mapping at high field
strengths where B0-field inhomogeneity is a common issue.
Acknowledgements
No acknowledgement found.References
1. Dabir D, Child N, Kalra A, et al. Reference values for healthy human myocardium using a T1 mapping methodology: results from the International T1 Multicenter cardiovascular magnetic resonance study. Journal of Cardiovascular Magnetic Resonance 2014;16:69.
2. Kellman P, Herzka DA, Arai A et al. Influence of Off-resonance in myocardial T1-mapping using SSFP based MOLLI method. Journal of Cardiovascular Magnetic Resonance 2013;15:63.
3. Messroghli DR, Radjenovic A, Kozerke S et al. Modified Look-Locker inversion recovery (MOLLI) for high-resolution T1 mapping of the heart. Magnetic Resonance in Medicine 2004;52(1):141-146.
4. Hargreaves BA, Vasanawala SS, Pauly JM et al. Characterization and reduction of the transient response in steady-state MR imaging. Magnetic Resonance in Medicine 2001;46(1):149-158.
5. Avants BB, Tustison NJ, Song G et al. A Reproducible Evaluation of ANTs Similarity Metric Performance in Brain Image Registration. NeuroImage 2011;54(3):2033-204.
Figures