2726
Simultaneous T1 and T2 mapping of the myocardium in normal volunteers using Cardiac MR Fingerprinting1Radiology, University Hospitals Cleveland Medical Center / CWRU, Cleveland, OH, United States, 2Biomedical Engineering, Case Western Reserve University, 3Case Western Reserve University, 4Case Western Reserve University School of Medicine, 5Radiology, Case Western Reserve University, 6Radiology, University Hospitals Cleveland Medical Center, Cleveland, OH, United States, 7Epidemiology and Biostatistics, Case Western Reserve University School of Medicine, 8Radiology and Biomedical Engineering, University Hospitals Cleveland Medical Center / CWRU, Cleveland, OH, United States, 9Biomedical Engineering, University Hospitals Cleveland Medical Center / CWRU, Cleveland, OH, United States
Synopsis
This study reports normative cardiac T1 and T2 values generated in a single cardiac MRF scan in a cohort of normal volunteers. These values were compared against MOLLI (for T1) and bSSFP (for T2). Our results show that cardiac relaxometry values obtained with MRF at 1.5 T are comparable to values previously reported in the literature and those obtained using MOLLI and bSSFP.
Introduction
Traditional cardiac relaxometry techniques rely on acquisition of multiple data points to sample an exponential recovery or decay curve1. MR Fingerprinting (MRF) uses a pulse sequence which is sensitive to both T1 and T2 in conjunction with a unique pattern matching approach to create T1 and T2 maps in a single acquisition2, reducing the scan time and number of breath holds in addition to providing aligned maps.Purpose:
We assessed the T1 and T2 relaxation times of normal myocardium using MRF (for T1 and T2), Modified Look-Locker Inversion recovery (MOLLI for T1) and balanced Steady-State Free Precession (bSSFP for T2) in an attempt to establish normative reference values and determine reproducibility for each of the methods.Methods:
Myocardial T1 and T2 maps were acquired in three short axis (SA) slices in 15 healthy volunteers (M:F- 8:7; average heart rate 71 bpm) at 1.5 T (Siemens Aera). Biometric parameters such as gender, height, weight, heart rate and BMI were recorded. An MRF sequence was employed similar to that described by Hamilton et al2 with ECG triggering in diastole and a breathhold duration of 15 heartbeats (192x192 matrix, 300mm2, 1.6x1.6x8.0mm3 spatial resolution, TR 5.1ms, FA 4-25deg). Data were acquired with a variable density spiral having 48 projections that rotates by approximately the golden angle between successive TRs. A total of 750 undersampled (R=48) MRF images were acquired with 50 images collected in each heartbeat (255ms scan window). For comparison, T1 maps were acquired using MOLLI 3,4 with a 5(3)3 acquisition pattern, and T2 maps were collected using a T2 prepared bSSFP sequence with T2 preparation times of 0, 25, and 55ms. The spatial resolution of the traditional mapping sequences was matched to the MRF scan. The mid-slice was acquired at the beginning as well as the end of the scan to test the same-day repeatability of the acquisitions.
Raw data for MRF were processed in MATLAB and regions of interest (ROI) were drawn across 16 standardized myocardial AHA segments on MRF, MOLLI and bSSFP maps. Segment 17 was not evaluated because acceptable image quality could not be obtained using MRF or traditional sequences. Deming regression analysis was used to compare proportional and systematic errors between two measurement methods. The same day repeatability of the acquisition methods was tested using intra-class coefficient (ICC).
Results:
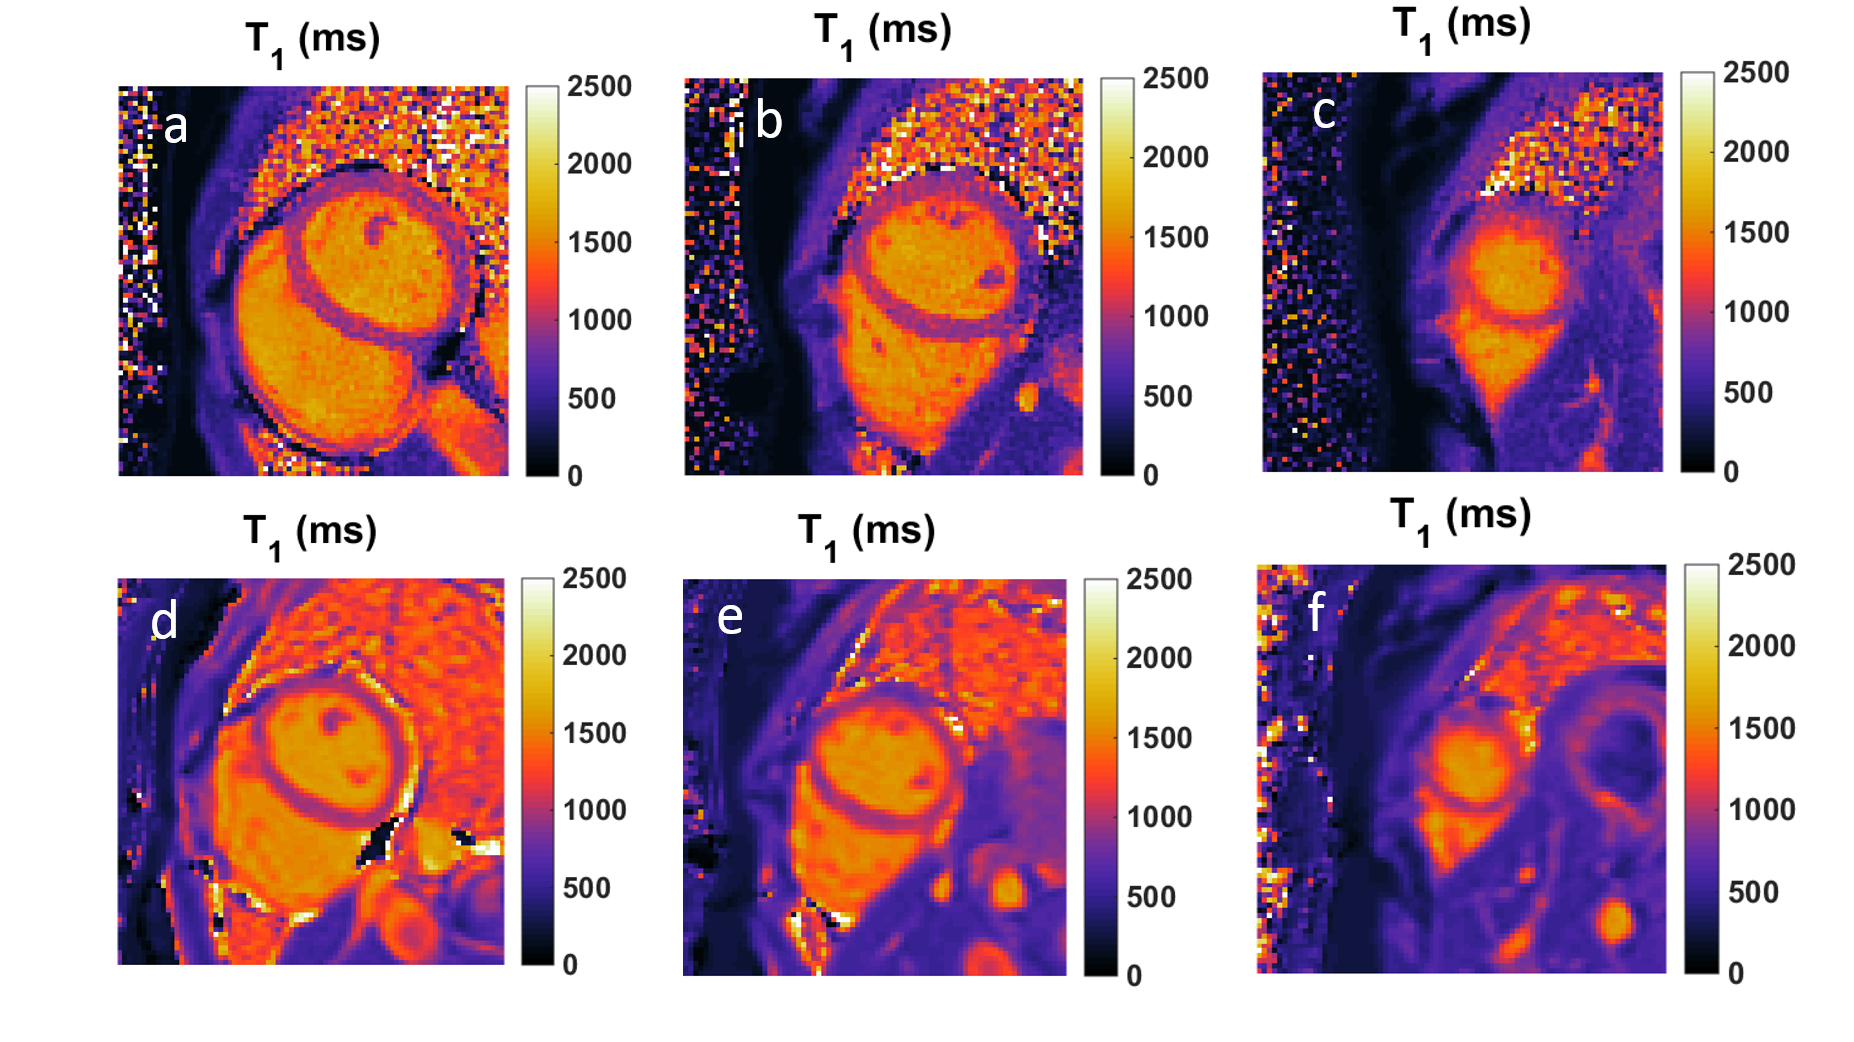
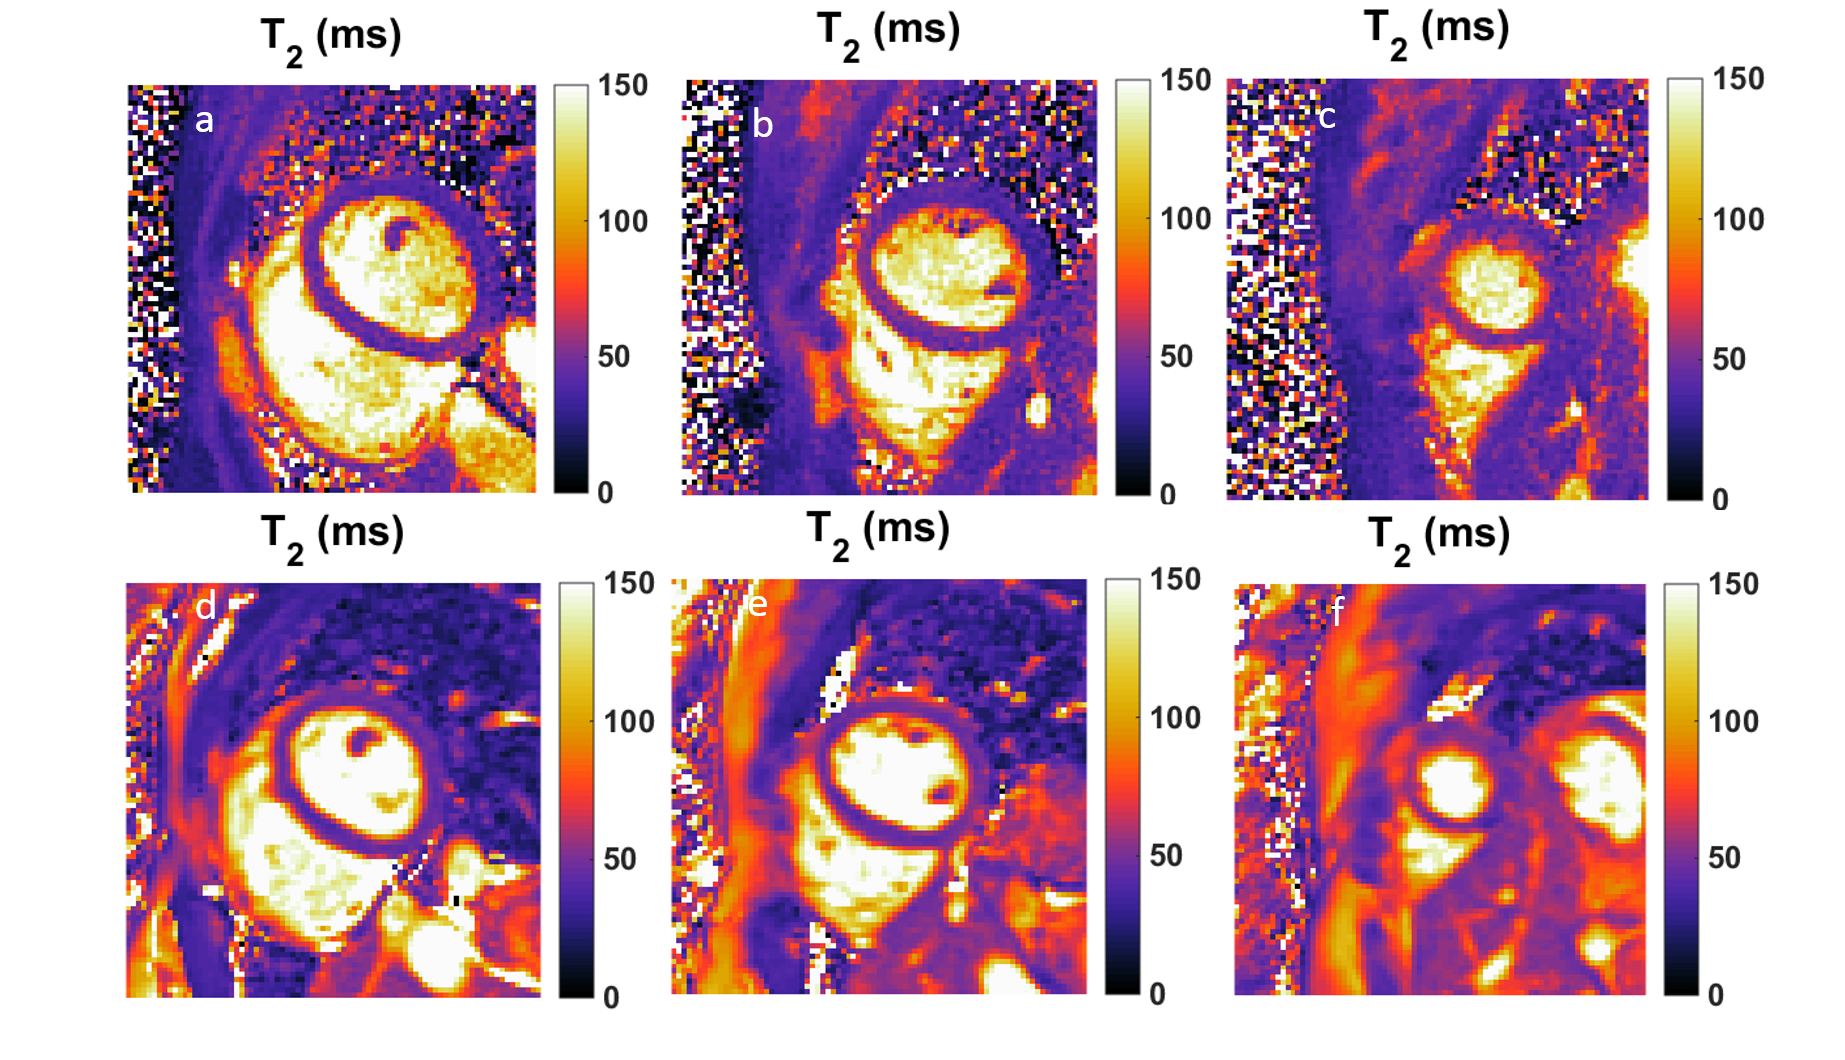
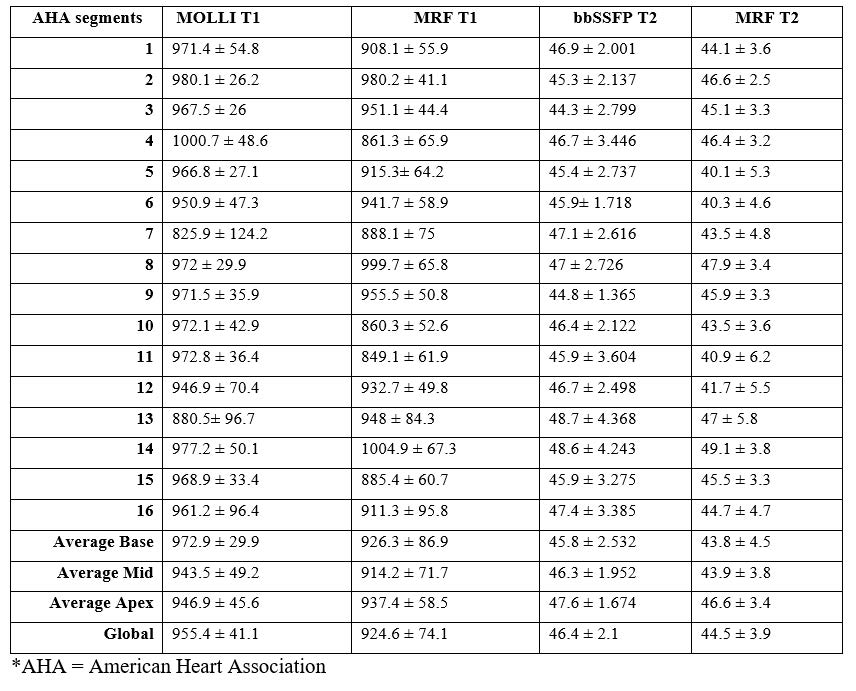
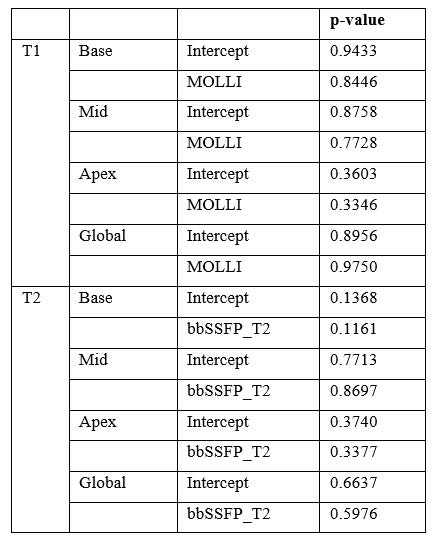
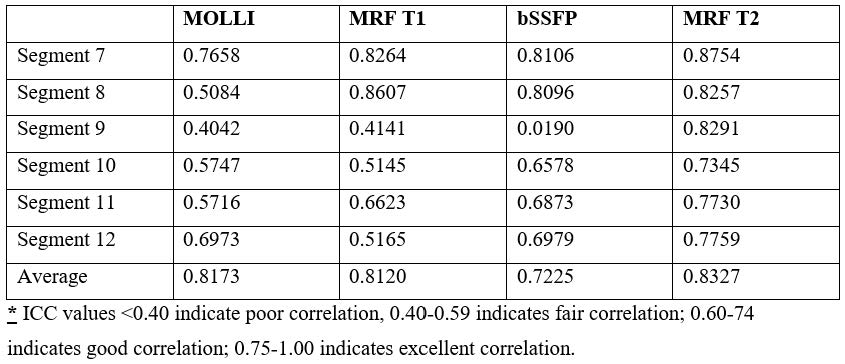
Acceptable image quality was obtained for all volunteers with MRF and traditional sequences (Figure 1,2). The average T1 and T2 relaxation times for normal myocardium at segment, slice and global levels obtained with MRF, MOLLI and bSSFP based mapping are depicted in Table 1. Deming regression analysis revealed no proportional and no systematic errors in the acquisition methods (Table 2). The ICC values for same-day repeatability revealed fair to excellent agreement between repeated T1 values with MRF and MOLLI for all segments. Good to excellent agreement was obtained for T2 values with MRF and bSSFP except for segment 9 which yielded poor ICC values for bSSFP (Table 3).Discussion and conclusion:
This is the first study to report normative values for T1 and T2 relaxation times of myocardium in a cohort of normal volunteers using MR Fingerprinting at 1.5T. The overall T1 and T2 values obtained using MRF are in agreement with the values obtained using traditional sequences and previously reported in the literature5-7. MRF was robust for the duration of the scan for both T1 and T2 measurements as revealed by favorable ICC values for repeated mid-slice measurements. However, the ICC values for repeatability of T2 measurement for segment 9 were poor for bSSFP. This could be possibly related to the partial volume artifacts. Further evaluation with a larger dataset is needed to interrogate this finding.
There are several advantages of an MRF acquisition over traditional cardiac mapping sequences. It is highly independent of heart rate because time lapse at the end of one acquisition window and first RF excitation pulse in the next heartbeat is incorporated in the Bloch simulation at the scanner. This has potential applications for evaluation of patients with arrhythmias where traditional mapping sequences are known to be unreliable. Furthermore, pattern matching approach used in MRF makes it inherently resistant to detrimental effects of aliasing and motion not present in the dictionary, which is especially desirable when scanning patients whose ability to lie still in the scanner is compromised. Further validation of MRF and traditional techniques is needed with larger age and gender matched cohorts to evaluate repeatability, and to provide normative values that serve as standards of reference for evaluation of diseased states.
Acknowledgements
Siemens Medical Solutions and NIH/NHLBI grants 2R01HL094557, 1R01DK098503, and 1R01EB016728.
References
1. Kellman, et al. Journal of Cardiovascular Magnetic Resonance 2014;16:2
2. Hamilton, et al. Magnetic Resonance in Medicine. 2016 Apr 1. doi: 10.1002/mrm.26216.
3. Messroghli DR, et al. Magn Reson Med 2004; 52:141–146.
4. Piechnik SK, et al. J Cardiovasc Magn Reson 2010;12:69
5. Piechnik, et al. Journal of Cardiovascular Magnetic Resonance 2013, 15:13
6. von Knobelsdorff-Brenkenhoff, et al. Journal of Cardiovascular Magnetic Resonance 2013, 15:53
7. Baeßler, et al. Journal of Cardiovascular Magnetic Resonance (2015) 17:67
8. Moon JC, et al. J Cardiovasc Magn Reson. 2013;15(1):92
Figures