2725
Left Ventricle Remodeling in Bicuspid Aortic Valve Evaluated by ECG, Echocardiography, and Cardiovascular Magnetic Resonance1Department of Radiology, Northwestern University, Chicago, IL, United States, 2Department of Radiology, Yale New Haven Health Bridgeport Hospital, Bridgeport, CT, United States, 3Department of Radiology and Biomedical Engineering, Northwestern University, Chicago, IL, United States
Synopsis
The relationship between ECG characteristics, left ventricular (LV) diastolic function by echocardiography and Gadolinium extracellular volume fraction (ECV) in bicuspid aortic valve (BAV) are unknown. We aimed to test the hypothesis that BAV has an association with LV hypertrophy, myocardial fibrosis, and diastolic dysfunction. Cardiac magnetic resonance, ECG, and echocardiography were performed in 80 patients with BAV and 34 patients with trileaflet aortic valve (TAV). ECV was significantly higher in BAV than TAV. ECV, Sokolow-Lyon voltage, Cornell product, and e’ demonstrated significant relationships with LV end-diastolic volume index. ECV can be a useful predictor of LV remodeling in BAV.
Purpose:
Bicuspid aortic valve (BAV) often develops aortic valve stenosis (AS) and/or regurgitation (AR), which can cause increased left ventricular (LV) loading and thus subsequent LV remodeling 1. It is known that the Sokolow-Lyon voltage and Cornell product by ECG can predict LV hypertrophy 2. It is also well understood that E/e’ and e’ by echocardiography can estimate LV diastolic function in trileaflet aortic valve (TAV) patients 3. Further, cardiac magnetic resonance (CMR) can reliably quantify global cardiac function and T1 mapping can be employed to derive gadolinium extracellular volume fraction (ECV) as a measure of myocardial fibrosis 4. The aim of this study was to assess the impact of BAV on metrics of LV remodeling, hypertrophy, and dysfunction quantified by ECG characteristics, LV diastolic function by echocardiography, as well as LV volumetric parameters and ECV by CMR. Findings were compared to patients with TAV. We also investigated the correlations between LV volumetric parameters, ECG/echo parameters and CMR based ECV in both BAV and TAV cohorts.
Methods:
With institutional IRB approval, a total of 114 patients referred to CMR for evaluation of aortic dimensions and valvular function were divided into BAV (n=80, male 55, 50±15 years) and TAV (n=34, male 26, 53±15 years) groups. All patients underwent cine CMR and T1 mapping using 1.5 or 3T scanners (Avanto or Skyra, Siemens, Germany). As summarized in Fig. 1, Modified Look-Locker inversion recovery (MOLLI) was performed for T1 mapping in basal, mid-ventricular and apical short axis orientation. Global ECV was calculated with patient specific hematocrit, native T1 values and post-contrast T1 values in an AHA 16-segment model using a clinical workstation (Circle 5.3, Canada). Moderate or severe AS was defined when the systolic peak velocity by 2D phase contrast MRI (2D-PCMRI) exceeded 3.0 m/s. Moderate or severe AR was defined when regurgitation fraction by 2D-PCMRI exceeded 30% or was qualitatively defined using the cine images when 2D-PCMRI underestimated the regurgitation flow. LV end-diastolic volume index (LVEDVI), end-systolic volume index (LVESVI), LV ejection fraction (LVEF) and LV mass index (LVMI) were measured from short axis cine CMR. ECG and echocardiography were performed within 1 year of CMR. ECG parameters were calculated using the following equations: Sokolow-Lyon voltage = SV1 + RV5, Cornell product = QRS duration × (RaVL + SV3). In echocardiography, E velocity of LV inflow measured in pulse wave doppler image on mitral valve and e’ velocity of mitral annulus displacement measured in tissue doppler image on LV basal septum were evaluated (Fig. 2).Results:
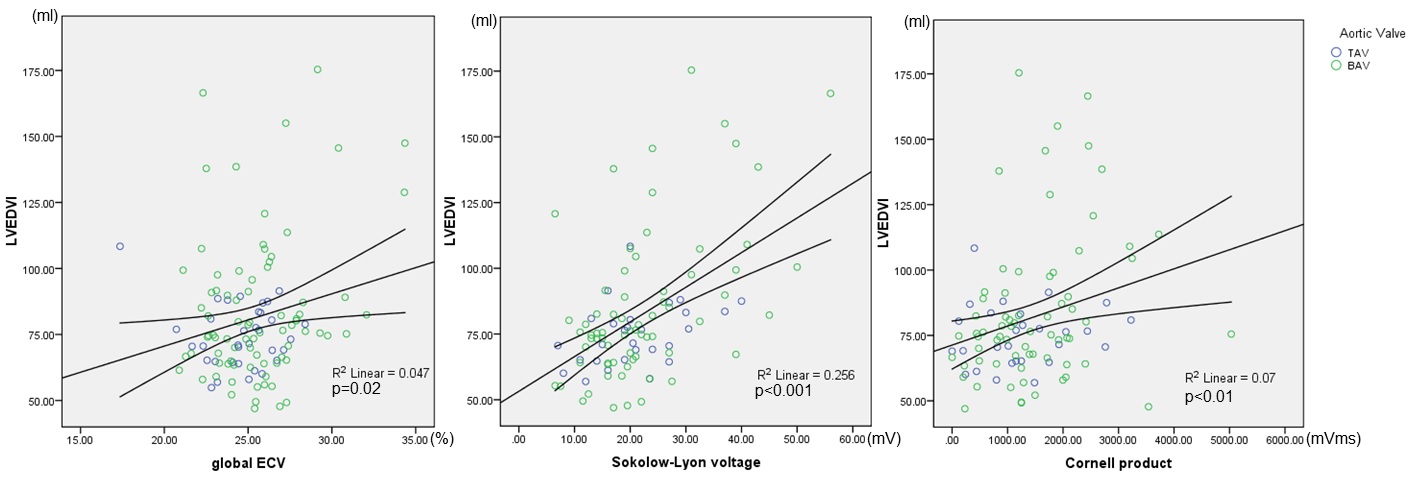
Patients with BAV are comprised of 16 patients (20%) with moderate or severe AS, 16 patients (20%) with moderate or severe AR (AS and AR overlap=3), and 51 patients (64%) with no or mild AS/AR. In contrast, no TAV patient had moderate or severe AS or AR. There were no differences in LVEDVI, LVESVI, LVEF, and LVMI between BAV and TAV. ECV demonstrated significant elevation in patients with BAV compared to those in TAV (25.6 ± 2.8% vs. 24.6 ± 2.2%, p=0.04). Sokolow-Lyon voltage and Cornell product by ECG and E/e’ and e’ by echocardiography showed no differences between BAV and TAV (Table 1). As summarized in Table 2 and Fig. 3, Pearson correlation coefficient analysis performed in the entire cohort with BAV and TAV demonstrated weak positive correlation in Global ECV with EDVI (R=0.22, p=0.02) and ESVI (R=0.22, p=0.02), moderate positive correlation in Sokolow-Lyon voltage with EDVI (R=0.51, p<0.001), ESVI (R=0.42, p<0.001) and LVMI (R=0.49, p<0.001). Cornell product also showed weak positive correlation with EDVI (R=0.26, p<0.01) and ESVI (R=0.28, p<0.01), and moderate positive correlation with LVMI (R=0.45, p<0.001). However E/e’ and e’ didn’t represent correlation except for weak positive correlation in e’ and EDVI (R=0.21, p<0.05).
Discussion:
In BAV, high incidence of AS and AR were observed. However BAV patients exhibited a wide range in LV volume and mass, resulting in no difference in LVEDVI, LVESVI, and LVMI compared to TAV. Even given the heterogeneous nature of the BAV cohort, ECV was significantly elevated compared to the TAV cohort. Correlation analysis revealed association of the Sokolow-Lyon voltage and Cornell product with LV dilatation and LVH in the cohort of BAV patients. Diastolic dysfunction parameters, which may be affected by many confounders, revealed no obvious association with volumetric parameters.
Conclusion:
Generally, the presence of a BAV resulted in elevated myocardial fibrosis as detected by ECV and as compared to TAV. Sokolow-Lyon voltage, Cornell product, and ECV may be useful parameters to predict LV remodeling in BAV.
Acknowledgements
I have no funding for this study.
References
Masri A, Kalahasti V, Alkharabsheh S, Svensson LG, Sabik JF, Roselli EE, Hammer D, Johnston DR, Collier P, Rodriguez LL, Griffin BP, Desai MY. Characteristics and long-term outcomes of contemporary patients with bicuspid aortic valves. J Thorac Cardiovasc Surg. 2016 Jun;151(6):1650-1659.
Buchner S, Debl K, Haimerl J, Djavidani B, Poschenrieder F, Feuerbach S, Riegger GA, Luchner A. Electrocardiographic diagnosis of left ventricular hypertrophy in aortic valve disease: evaluation of ECG criteria by cardiovascular magnetic resonance. J Cardiovasc Magn Reson. 2009 Jun 1;11:18.
Nagueh SF, Smiseth OA, Appleton CP, Byrd BF 3rd, Dokainish H, Edvardsen T, Flachskampf FA, Gillebert TC, Klein AL, Lancellotti P, Marino P, Oh JK, Alexandru Popescu B, Waggoner AD. Recommendations for the Evaluation of Left Ventricular Diastolic Function by Echocardiography: An Update from the American Society of Echocardiography and the European Association of Cardiovascular Imaging. Eur Heart J Cardiovasc Imaging. 2016 Jul 15. Epub ahead of print
Vassiliou VS, Heng EL, Gatehouse PD, Donovan J, Raphael CE, Giri S, Babu-Narayan SV, Gatzoulis MA, Pennell DJ, Prasad SK, Firmin DN. Magnetic resonance imaging phantoms for quality-control of myocardial T1 and ECV mapping: specific formulation, long-term stability and variation with heart rate and temperature. J Cardiovasc Magn Reson. 2016 Sep 22;18(1):62.
Figures
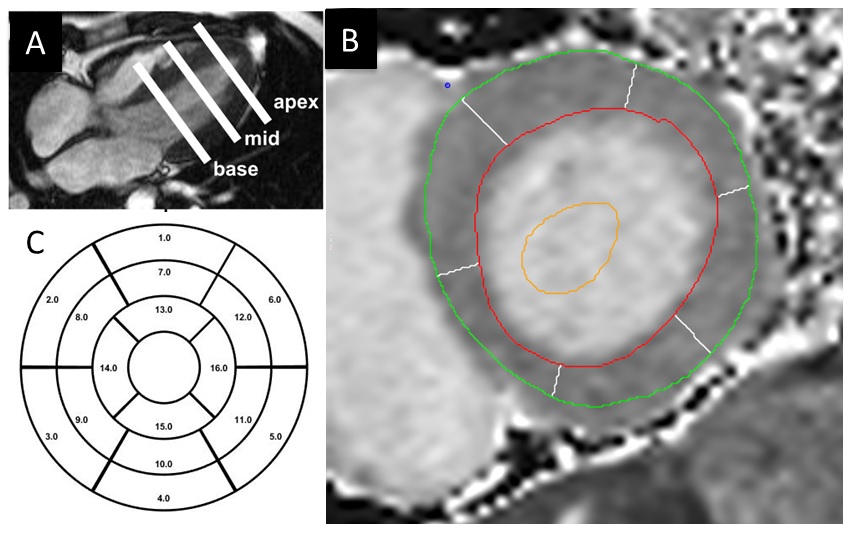
Fig. 1 T1 mapping for ECV calculation. MOLLI was performed in basal, mid, and apical LV (A). LV epi- and end-myocardium contours were manually traced (B). Using 16-segment model, regional and global T1 and ECV was calculated.

Fig. 2 (A) ECG parameters of Sokolow-Lyon voltage and Cornell Product. (B) E velocity of LV inflow at mitral valve and (B) e’ velocity of basal septum by tissue doppler image, both in early diastolic phase.

Table 1 Demographic, MRI, ECG and echocardiographic characteristics in the patients with BAV and TAV. AS: aortic valve stenosis, AR: aortic valve regurgitation, LVEDVI: left ventricular end-diastolic volume index, LVESVI: left ventricular end-systolic volume index, LVEF: left ventricular ejection fraction, LVMI: left ventricular mass index, ECV: gadolinium extracellular volume fraction.
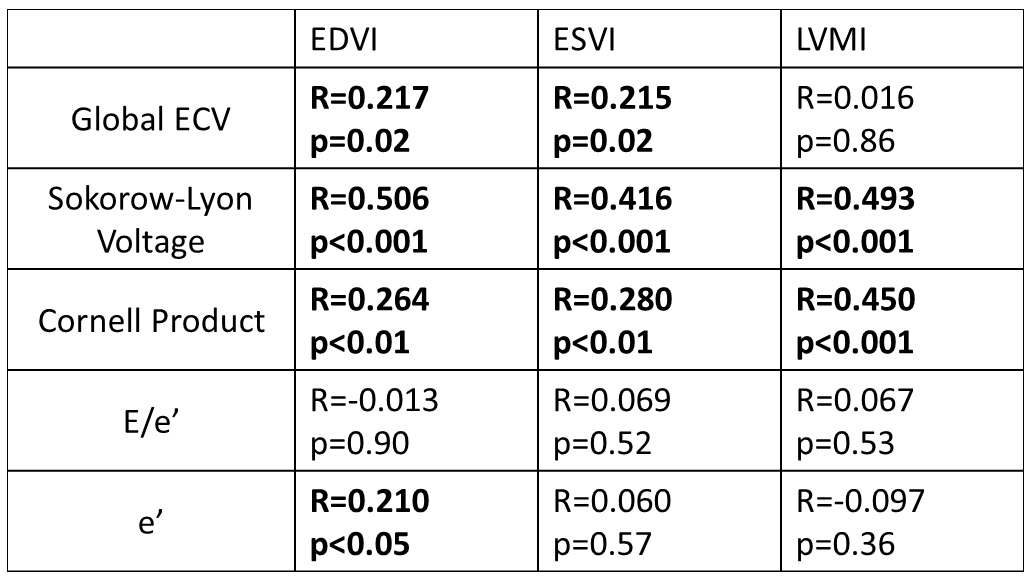
Table 2 Pearson correlation coefficient analysis in ECV, ECG and echo parameters with EDVI, ESVI and LVMI. , LVEDVI: left ventricular end-diastolic volume index, LVESVI: left ventricular end-systolic volume index, LVMI: left ventricular mass index. Significant relationships are indicated by bold type.