2723
Non-ECG, Free-breathing Joint T1-T2 Mapping in the Myocardium with CMR Multitasking1Biomedical Imaging Research Institute, Cedars-Sinai Medical Center, Los Angeles, CA, United States, 2Cedars-Sinai Heart Institute, Cedars-Sinai Medical Center, Los Angeles, CA, United States, 3Department of Bioengineering, University of California, Los Angeles, Los Angeles, CA, United States
Synopsis
Myocardial tissue characterization via quantitative T1 and T2 mapping is typically accomplished using ECG-triggering and breath-holding. Here we describe a novel method for non-ECG, free-breathing joint T1-T2 mapping using the cardiovascular low-rank tensor imaging framework for CMR multitasking. This method achieves joint T1-T2 mapping in the myocardium at multiple cardiac and respiratory phases within 1.5 min for one slice. Measurements were within the range reported in the literature, and were repeatable to 3.9% for T1 and 6.1% for T2.
Purpose
Myocardial tissue characterization via quantitative T1 and T2 mapping is a promising approach for diagnosis and monitoring of fibrosis, ischemia, and edema1. Typically, T1 and T2 maps are acquired using ECG-triggering and breath-holding to freeze cardiac and respiratory motion. Unfortunately, these techniques are heart-rate sensitive, are often uncomfortable or difficult for patients, and can result in motion artifacts from incorrect triggering or failed breath holds. Furthermore, because T1 and T2 maps are collected in separate scans during different breath holds, mis-registration is a common occurrence. Here we describe a novel method for non-ECG, free-breathing joint T1-T2 mapping using the cardiovascular low-rank tensor (LRT) imaging framework2 for CMR multitasking (simultaneous imaging of multiple dynamics such as cardiac/respiratory motion, T1 recovery, and T2 decay).Methods
The proposed method jointly imaged T1 and T2 relaxations by applying hybrid T2prep/IR magnetization preparation pulses of various durations and then sampling the subsequent T1 recovery curves. Each T2prep/IR pulse was constructed by modifying a conventional T2prep pulse to end with a 90° tip-down pulse instead of a 90° tip-up, achieving the combined effect of T2 preparation followed by 180° inversion. Immediately following each prep pulse, a small-angle FLASH sequence was used to continuously measure the T1 recovery process all the way until the next prep pulse. This pulse sequence is illustrated in Fig. 1.
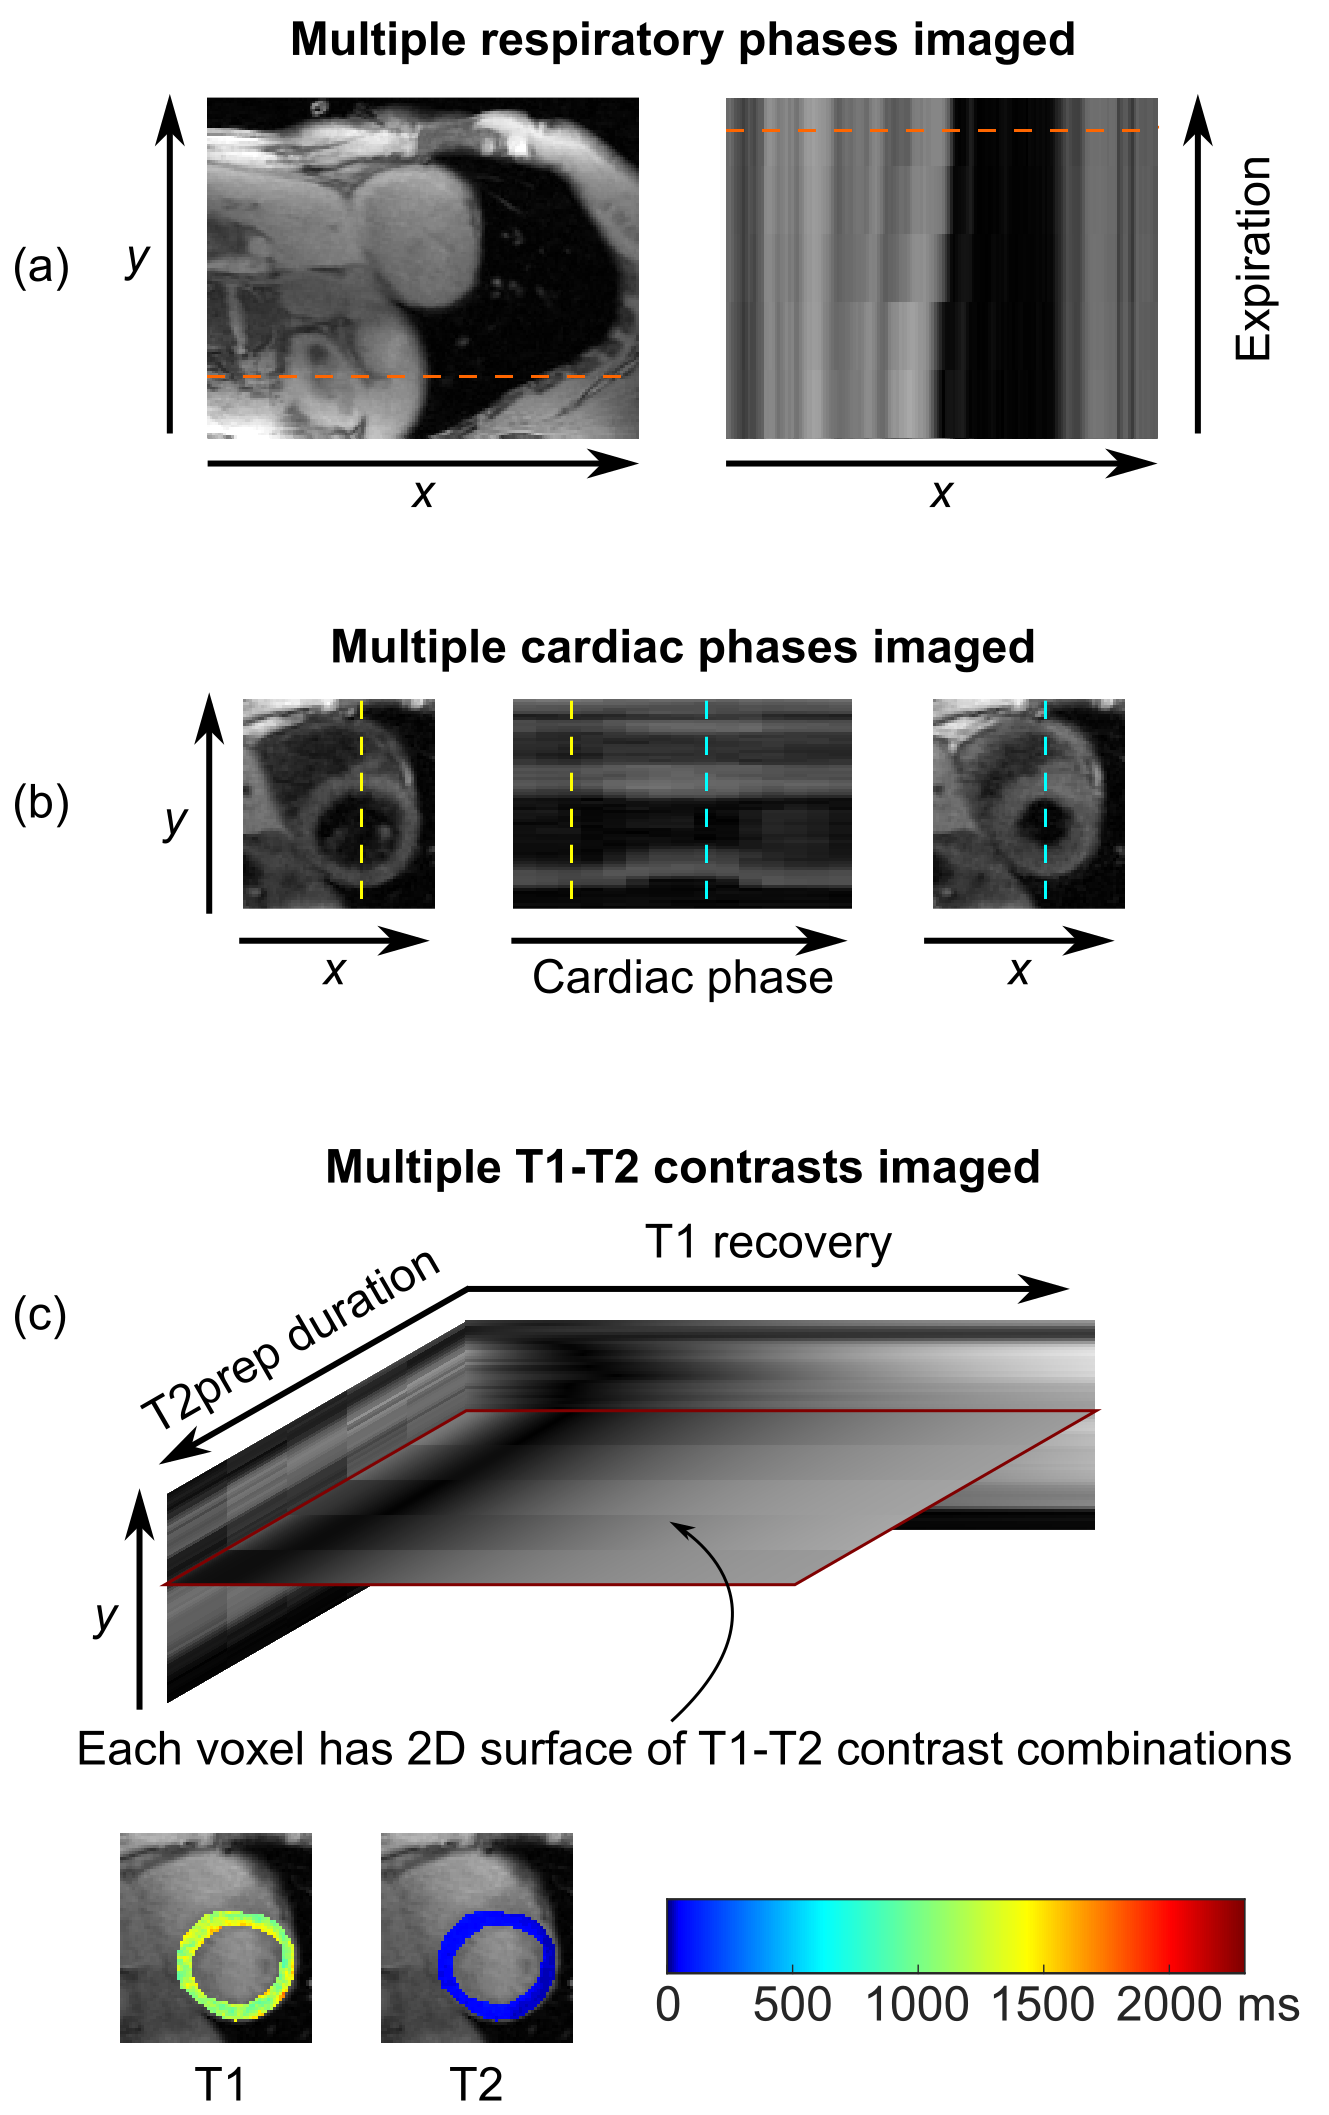
In order to simultaneously image cardiac motion, respiratory motion, and tissue relaxation, data were acquired and reconstructed using CMR multitasking2. Continuous-acquisition radial FLASH readouts were sampled with a golden-angle ordering scheme modified to collect LRT subspace training data. Real-time low-rank matrix images3 were first reconstructed to allow image-based cardiac and respiratory phase identification. The original data were then binned into a 5-way tensor with dimensions indexing k-space location, cardiac phase, respiratory phase, inversion time, and T2prep duration. LRT image reconstruction was performed to obtain images for every cardiac phase, respiratory phase, and T1-T2 weighting combination. Finally, T1 and T2 were jointly fit from the full set of T1-T2 contrasts for any given cardiac/respiratory phase combination.
To assess T1-T2 accuracy and repeatability, n=10 healthy volunteers were recruited for imaging on a 3 T Siemens Verio machine. Three scans each were collected of: diastolic T1 maps from ECG-triggered, breath-held SSFP MOLLI 5(3)34; diastolic T2 maps from ECG-triggered, breath-held T2prep-SSFP mapping5; and cardiac- and respiratory-resolved T1-T2 maps from the proposed non-ECG, free-breathing method. A single mid-ventricular short-axis slice with 1.7 mm in-plane spatial resolution and 8 mm slice thickness was imaged using each method. For the proposed method, T2prep/IR durations were cycled through 12, 20, 30, 40, and 50 ms; each prep pulse was followed by 5° FLASH readouts every 3.6 ms for 2.45 s. This process was repeated for a total imaging time of 85 s. Reconstruction was performed with 15 cardiac bins, five respiratory bins, five T2prep durations, and 344 inversion times (3.6, 10.7, 17.8, ..., 2446 ms).
Results
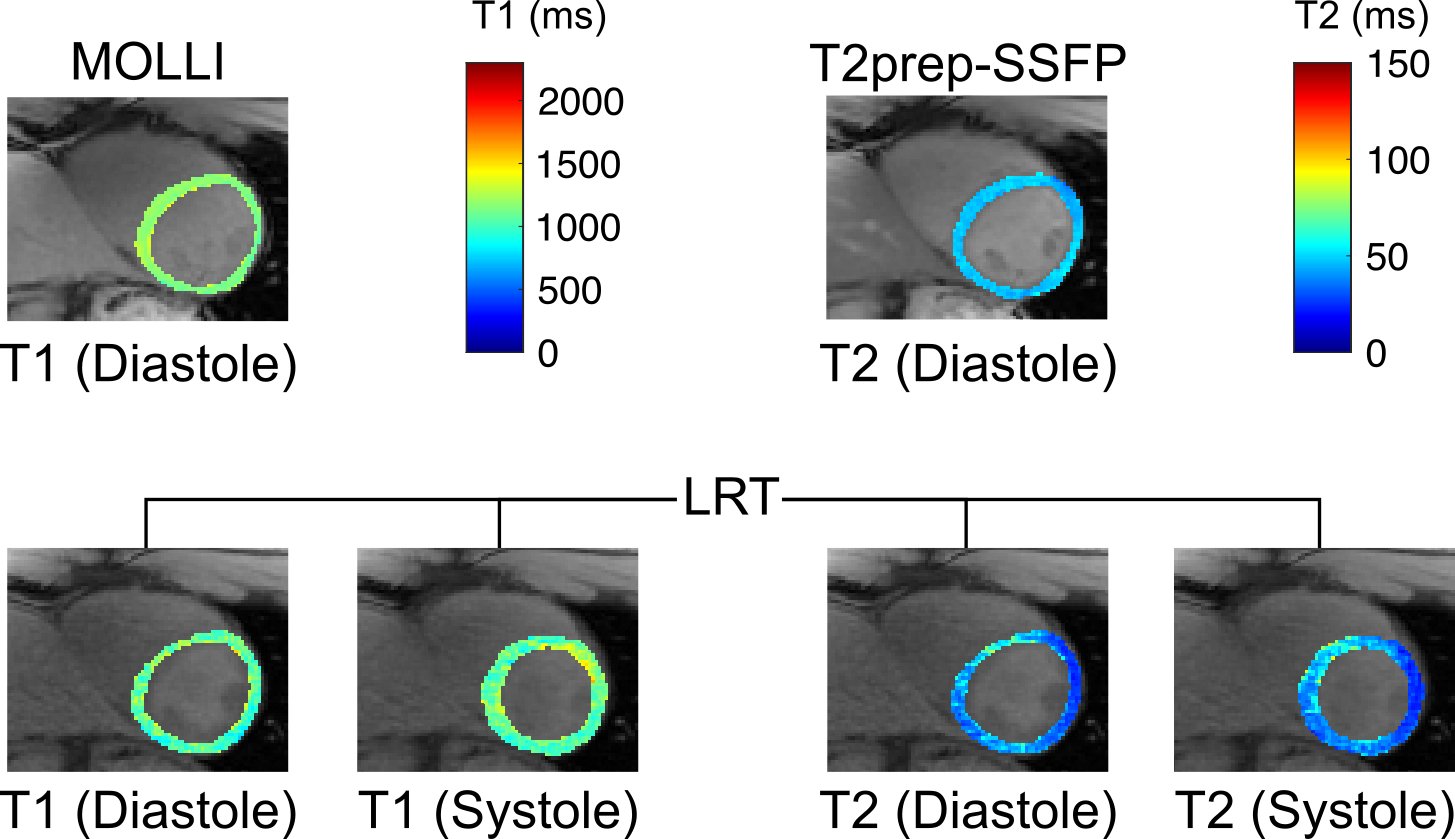
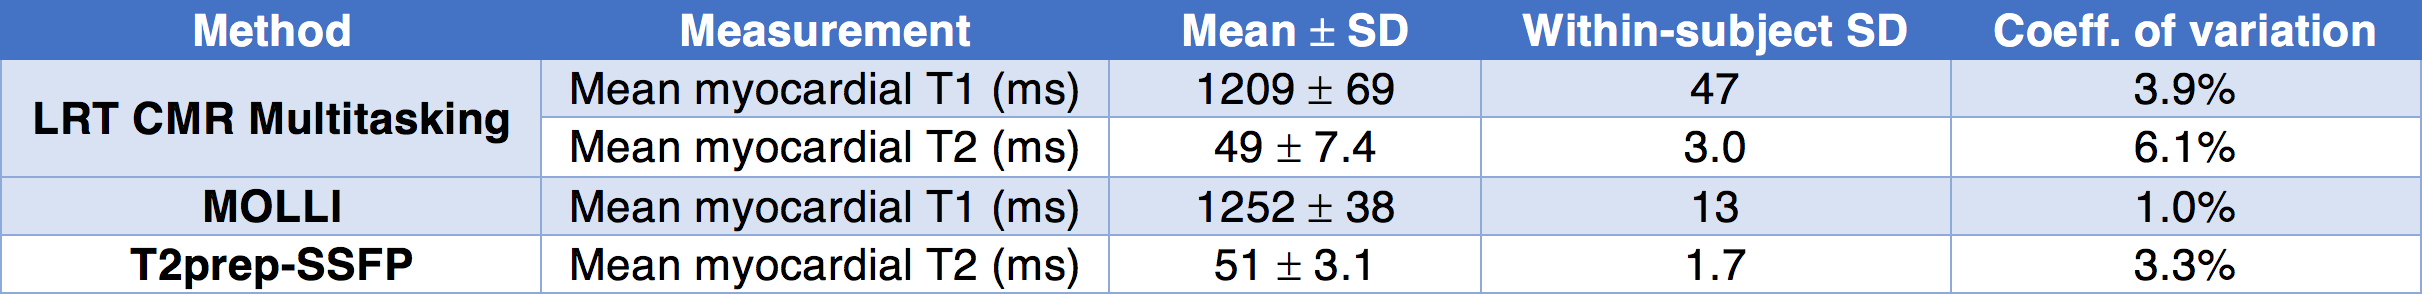
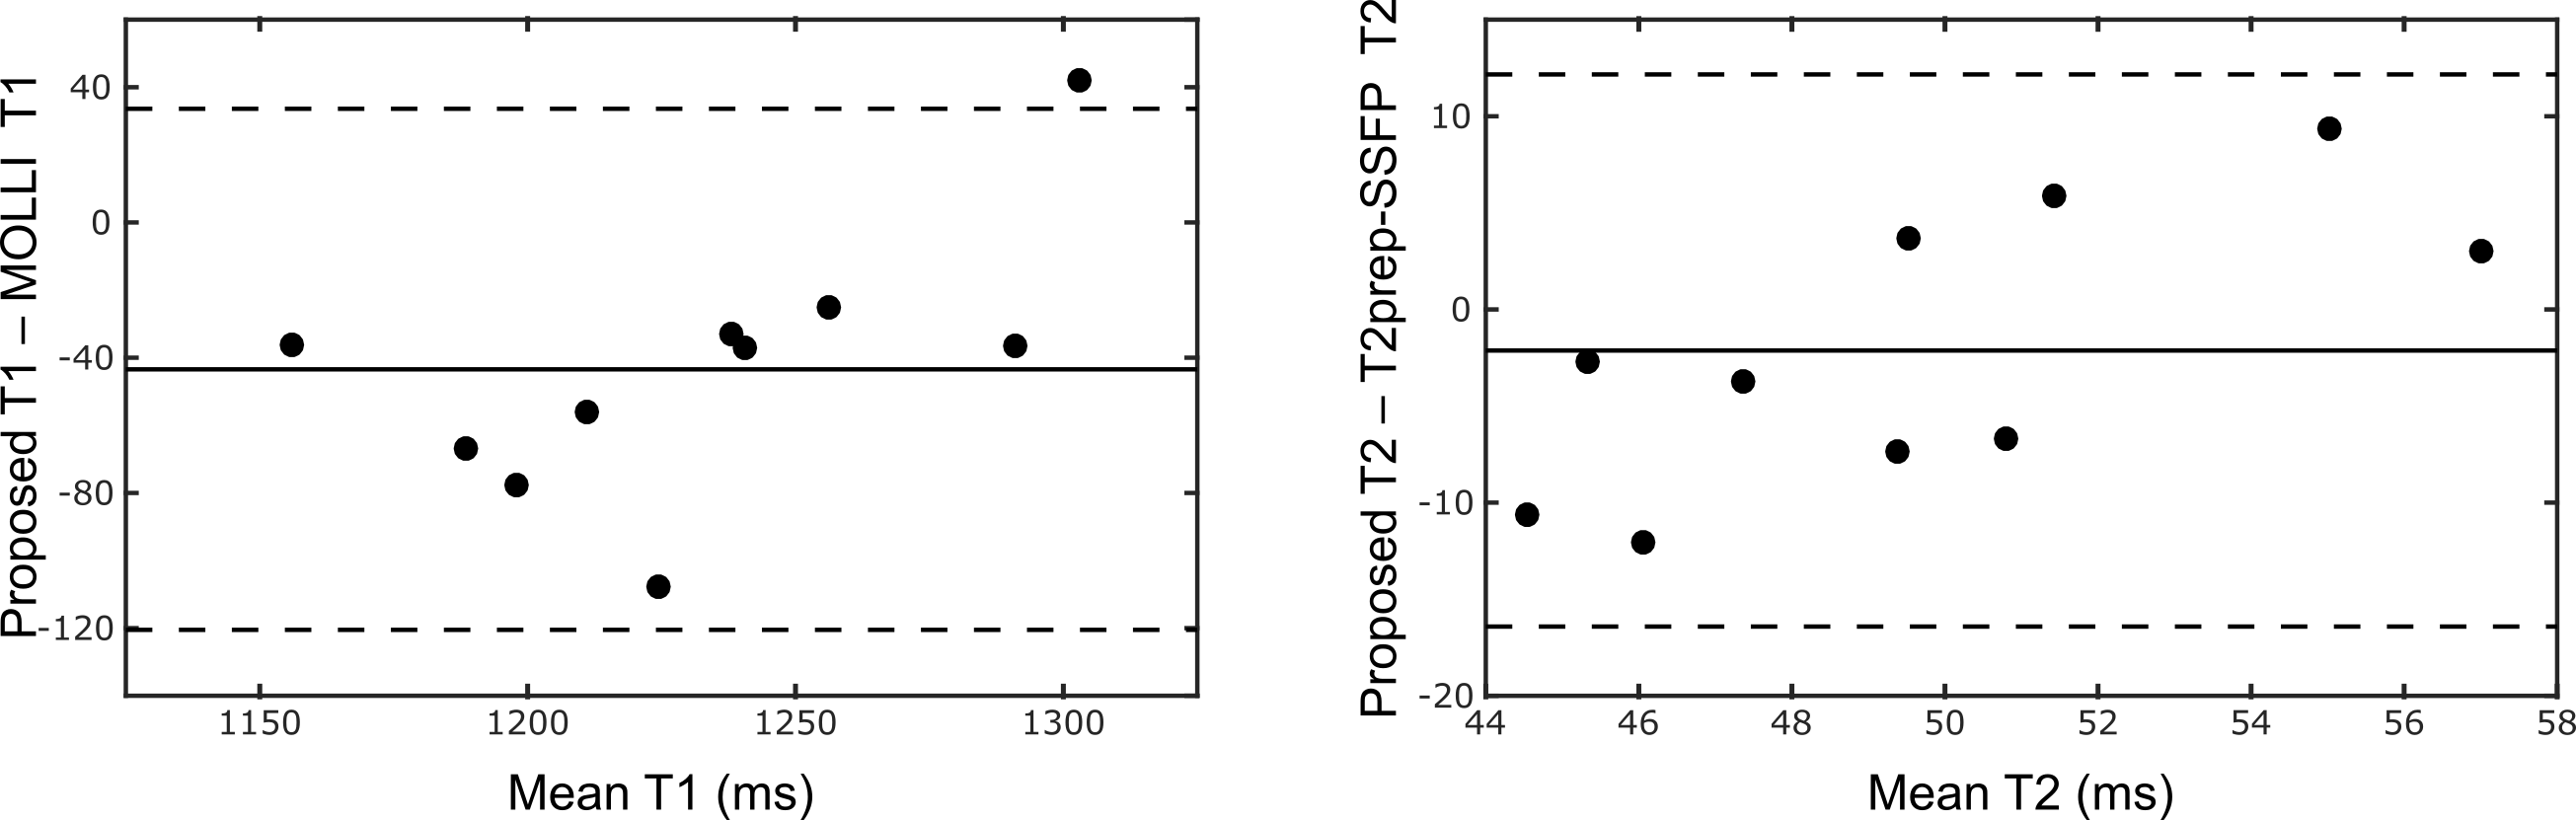
Fig. 2 demonstrates the capabilities of the proposed method for myocardial joint T1-T2 mapping, depicting multitasking of respiration, cardiac motion, T2prep duration, and T1 recovery. Fig. 3 shows diastolic and systolic T1-T2 maps from CMR multitasking, a diastolic T1 map from MOLLI, and a T2 map from T2prep-SSFP. Fig. 4 summarizes statistical findings from the three methods, and Fig. 5 depicts Bland-Altman plots for comparing methods. The proposed method showed a slight negative bias (ΔT1=–43 ms, p=0.007) in diastolic T1 as compared to MOLLI, as well as reduced precision (coefficient of variation: 3.9% vs. 1.0%). Potential sources of this bias are preparation scheme differences (T2prep/IR vs. IR) and sequence differences (FLASH vs. SSFP). The proposed method yielded similar T2 measurements to T2prep-SSFP (ΔT2=–2 ms, p=0.38), also with somewhat reduced precision (coefficient of variation: 6.1% vs. 3.3%). T1 and T2 measurements for all methods yielded values within the range previously reported in the literature6.Conclusions
We have described a method for non-ECG, free-breathing joint T1-T2 mapping in the myocardium within 1.5 min, allowing T1 and T2 measurement at multiple cardiac and respiratory phases. Measurements were within the range reported in the literature, and were repeatable to 3.9% for T1 and 6.1% for T2. Our initial results show significant promise for non-ECG, free-breathing multiparameter mapping.Acknowledgements
This work was supported by NIH 1R01HL124649 and NIH T32HL116273.References
1. Blume U, Lockie T, Stehning C, et al. Interleaved T1 and T2 relaxation time mapping for cardiac applications. J Magn Reson Imaging. 2009 Feb;29(2):480-7.
2. Christodoulou AG, Shaw JL, Sharif B, Li D. A general low-rank tensor framework for high-dimensional cardiac imaging: application to time-resolved T1 mapping. Proc ISMRM. 2016;867.
3. Christodoulou AG, Zhang H, Zhao B, et al. High-resolution cardiovascular MRI by integrating parallel imaging with low-rank and sparse modeling. IEEE Trans Biomed Eng. 2013 Nov;60(11):3083-92.
4. Xue H, Greiser A, Zuehlsdorff S, et al. Phase-sensitive inversion recovery for myocardial T1 mapping with motion correction and parametric fitting. Magn Reson Med. 2013 May;69(5):1408-20.
5. Giri S, Chung YC, Merchant A, et al. T2 quantification for improved detection of myocardial edema. J Cardiovasc Magn Reson. 2009 Dec;11:56.
6. von Knobelsdorff-Brenkenhoff F, Prothmann M, Dieringer MA, et al. Myocardial T1 and T2 mapping at 3 T: reference values, influencing factors and implications. J Cardiovasc Magn Reson. 2013 Jun 18;15:53.
Figures