2722
Multi-parametric cardiac MRI for T1 mapping and cine imaging using iterative model-based image reconstruction1Physikalisch-Technische Bundesanstalt (PTB), Braunschweig and Berlin, Germany, 2Working Group on Cardiovascular Magnetic Resonance, Experimental and Clinical Research Center (ECRC), Berlin, Germany, 3Department of Cardiology and Nephrology, HELIOS Klinikum Berlin Buch, Berlin, Germany, 4Division of Imaging Sciences and Biomedical Engineering, King's College London, London, United Kingdom
Synopsis
In cardiac MRI, different diagnostic parameters are obtained in separate scans, leading to long examination times. In this work, we present an iterative model-based reconstruction approach for continuously acquired data, which provides native T1 maps and functional cine images within a single breath hold. The continuous acquisition allows for T1 reconstruction for different cardiac phases. Evaluation in a phantom demonstrated accurate T1 values (R²>0.99) and insensitivity to heart rates, with T1 variations of less than 5% (50 to 90 bpm). In three healthy volunteers T1 maps were assessed for diastole and systole and cine images had a consistent dark-blood contrast.
Introduction
Cardiac MRI provides a range of diagnostic information, such as heart function using cine imaging and myocardial viability using T1-mapping.1 Commonly these different diagnostic parameters are obtained in separate scans which can lead to long examination times. Especially T1-mapping techniques are very inefficient because data is only acquired in one cardiac phase (i.e. mid-diastole) and additional recovery periods are usually employed between inversion pulses where no diagnostic information is obtained.2 Previous methods which combined T1-mapping and cine imaging into one acquisition to increase diagnostic gain also required longer scan times.3,4
Here we present a novel technique which acquires data continuously over multiple cardiac cycles and provides quantitative native T1-maps and cine images in a single 16s breath-hold. An iterative model-based reconstruction scheme is used to describe the behavior of the magnetization during the continuous acquisition and ensure accurate T1-mapping.5
Methods
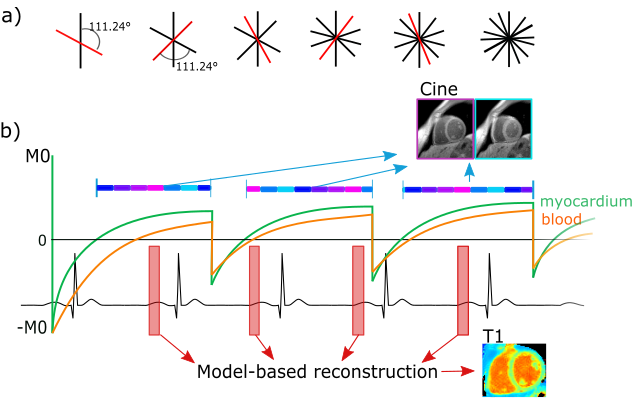
Data acquisition: Data was acquired continuously with a Golden radial sampling scheme (Fig. 1), which allows for flexible retrospective reordering of k-space data. Multiple inversion pulses were applied at constant time intervals.
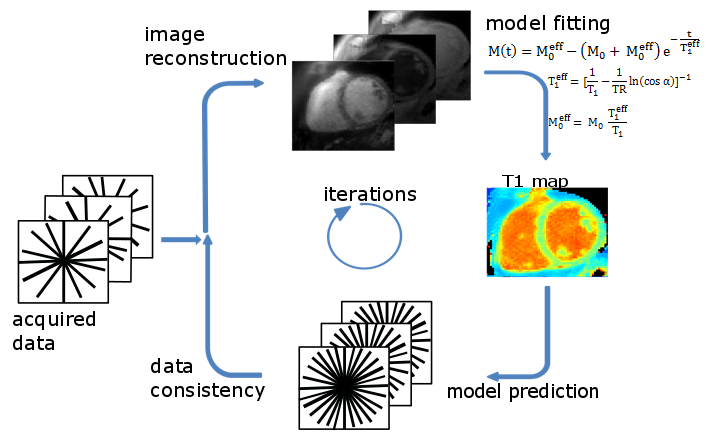
Image reconstruction: For T1 mapping, data is retrospectively gated and data of a specific cardiac phase (e.g. mid-diastole or mid-systole) is selected. T1 estimation is carried out iteratively during image reconstruction (Fig 2).5 At each iteration, images at different inversion times are reconstructed, a signal model is fitted and data consistency is ensured by comparing model predictions to acquired k-space data. The IR Look-Locker concept6 was extended for multiple inversions and used as a signal model. T1 values were calculated using pixel-wise three parameter nonlinear least-squares fitting.
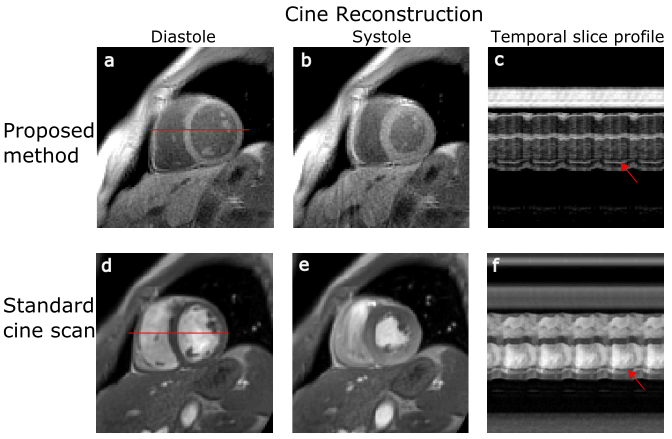
Cine images were reconstructed using the same data as for the T1-mapping. In order to ensure a high contrast between blood and myocardium, data is only used if the signal from myocardium is positive (Fig. 1). Since the T1-value of blood is higher than of myocardium, the signal of blood in the chosen window is partly negative, resulting in partial cancelation of image intensities during reconstruction and thus a darker appearance of blood in the cine images (black-blood contrast). Cine images were reconstructed with non-Cartesian iterative SENSE.7
Experiments: A commercial phantom (Eurospin, Diagnostic Sonar LTD, UK, 12 T1 values between 300 and 1750ms) and 3 healthy volunteers (2 male: 32 and 62years, 1 female: 26years) were imaged on 3T (Verio, Siemens Healthcare, Germany). 2D slices were acquired within a 16s breath-hold: flip angle: 5°, TE/TR: 2.03/4.54ms, FOV: 320x320mm², resolution: 2x2x8mm³. Inversion pulses were applied every 2.28s. For comparison purposes, a standard Cartesian cine was also acquired.
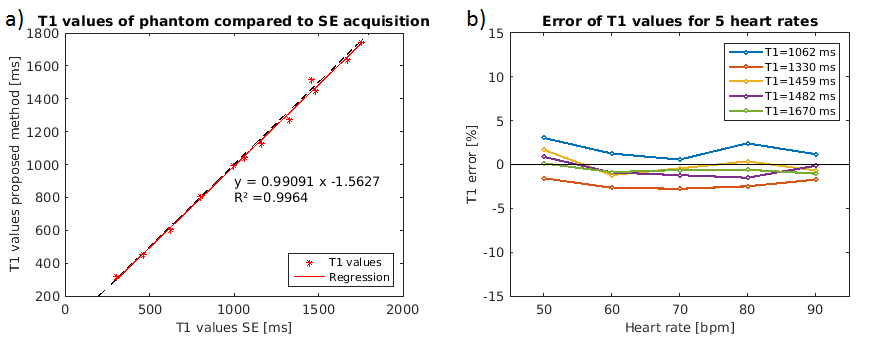
Assessment of mapping accuracy: For the phantom scan, T1-maps were reconstructed in a 140ms window during mid-diastole using simulated ECG signals with heart rates between 50 and 90bpm. T1 values obtained with the proposed approach were compared to an inversion recovery spin echo (IR-SE) sequence with seven inversion times (TI: 50-4800ms, TE/TR: 12/8000ms, scan time: 150min).
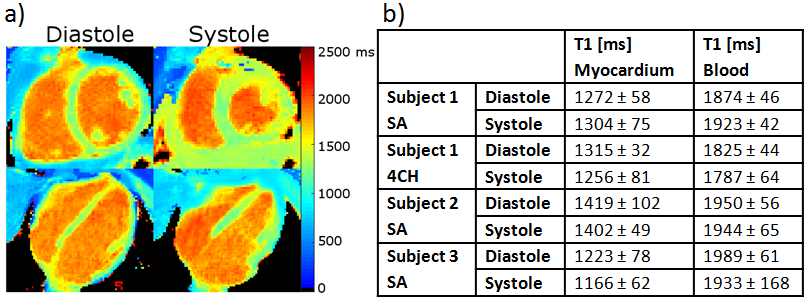
In-vivo experiments: T1-maps of three healthy volunteers were reconstructed for mid-systole and mid-diastole within a 140ms window. T1 values were assessed in the septum and blood pool of the left ventricle. Cine images with 25 cardiac phases were reconstructed.
Results & Discussion
Figure 3 compares the proposed method to the reference IR-SE sequence. T1 values estimated for both methods were in good agreement, with a coefficient of determination (R2) of >0.99. The relative difference over all T1 times between the proposed approach and IR-SE sequence was less than 5% for heart rates between 50 and 90bpm (Fig. 3b). This suggests that the proposed technique, using a constant time between inversions of 2.28s, provides accurate T1-maps independent of the heart rate. T1-maps and values for diastole and systole are shown in Figure 4 for SA and 4CH orientation. Septal T1 values for diastole and systole and are comparable to previously reported values.8 Functional cine images obtained with the proposed technique have a consistent dark-blood contrast and also depict small features such as papillary muscles as accurate as standard Cartesian cine scans (Fig. 5). The inherently acquired anatomy can be used for segmentation of the myocardium for T1-analysis. Reduction of scan time or enhancement of resolution could be received by further optimization of the inversion time or using motion compensation techniques.Conclusion
We have presented a novel approach, which provides quantitative T1-maps and functional cine images in a single breath hold strongly improving the diagnostic value of the acquisition. The continuous acquisition allows for a reconstruction of cine images and T1-maps for different cardiac phases. T1 values were comparable to published data and cine images showed consistent contrast over the cardiac cycle.Acknowledgements
No acknowledgement found.References
1. Bohl S, Schulz-Menger J. Cardiovascular magnetic resonance imaging of non-ischaemic heart disease: established and emerging applications. Heart Lung Circ. 2010;19(3):117-132.
2. Burt JR, Zimmerman SL, Kamel IR, Halushka M, Bluemke DA. Myocardial T1 mapping: techniques and potential applications. Radiographics. 2014;34(2):377-395.
3. Messroghli D., Buehrer M, Kozerke S, et al. Simultaneous T1 mapping, cine imaging, and IR-prepared imaging of the rat heart using Small Animal Look-Locker Inversion recovery (SALLI). Proc Int Soc Magn Reson Med. 2010;18:2-3.
4. Shaw, JL, Christodoulou AG, Sharif B LD. Ungated, Free-Breathing Native T1 Mapping in Multiple Cardiac Phases in Under One Minute: A Proof of Concept. ISMRM. 2016:3149.
5. Tran-Gia J, Stäb D, Wech T, Hahn D, Köstler H. Model-based Acceleration of Parameter mapping (MAP) for saturation prepared radially acquired data. Magn Reson Med. 2013;70(1992):1524-1534.
6. Deichmann R, Haase A. Quantification of T1 Values by SNAPSHOT-FLASH NMR Imaging. J Magn Reson. 1992;96:608-612.
7. Klaas P. Pruessmann,. Advances in Sensitivity Encoding With Arbitrary k-Space Trajectories. Magn Reson Med 2001;651:638-651.
8. Lee JJ, Liu S, Nacif MS, et al. Myocardial T1 and extracellular volume fraction mapping at 3 tesla. J Cardiovasc Magn Reson. 2011;13(1):75.
Figures