2720
Accurate Myocardial T1-Mapping in Arrhythmia using Saturation-Recovery during Systole at 3T1Computer Assisted Clinical Medicine, Medical Faculty Mannheim, Heidelberg University, Mannheim, Germany, 2DZHK (German Centre for Cardiovascular Research), partner site Mannheim, Mannheim, Germany, 3Department of Electrical and Computer Engineering, University of Minnesota, Minneapolis, MN, United States, 4Center for Magnetic Resonance Research, University of Minnesota, Minneapolis, MN, United States, 5Institute of Clinical Radiology and Nuclear Medicine, Medical Faculty Mannheim, Heidelberg University, Mannheim, Germany, 61st Department of Medicine Cardiology, Medical Faculty Mannheim, Heidelberg University, Mannheim, Germany
Synopsis
In arrhythmic patients, ECG mis-triggering frequently leads to T1-quantification inaccuracy.
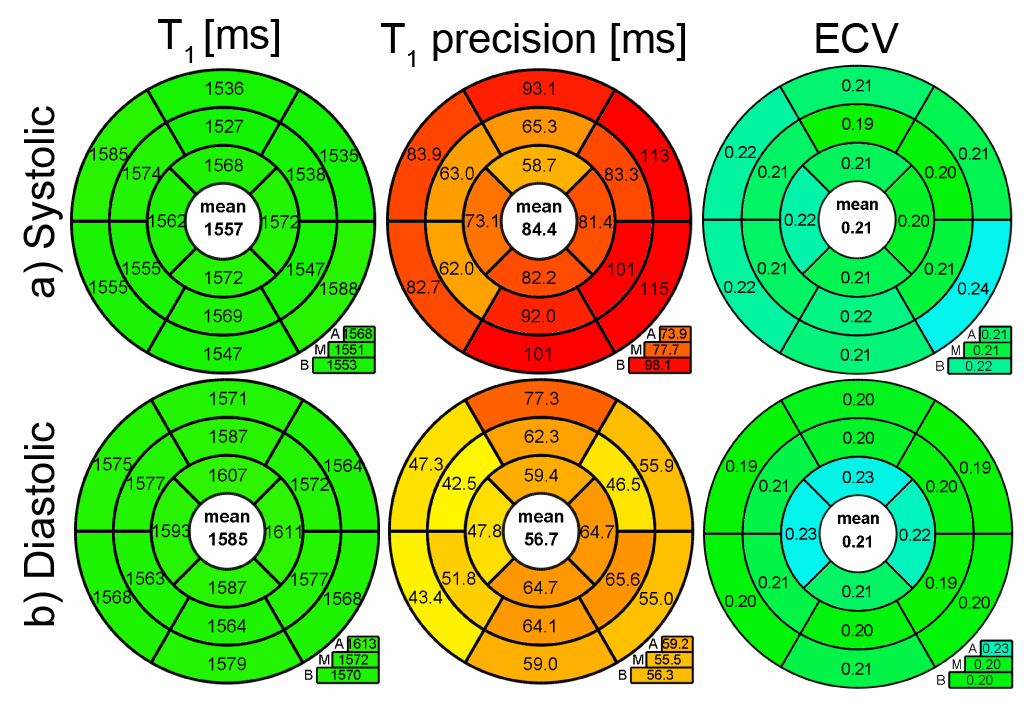
In this study, a heart-rate independent saturation-recovery T1-mapping method was adapted for systolic imaging at 3T by performing magnetization saturation right after the systolic imaging window and prior to R-wave detection. Estimated T1- and ECV- values during systole were (1557±53ms/ 0.21±0.03) compared to (1585±58ms/0.21±0.03) at diastole.
Our results show that SR T1-mapping might be an advantageous alternative to yield accurate T1- and ECV-values in patients with arrhythmia or reduced myocardial wall-thickness.
Background and Purpose
In cardiac magnetic resonance imaging, quantitative T1-maps show promising potential as biomarkers for non-invasive tissue characterization and are progressively used in diffuse pathologies, where conventional techniques are limited1. The extracellular volume (ECV) fraction offers independence of many confounding factors and correlates well with histologic fibrosis2. Reliable T1 quantification is compromised by two main factors: partial-voluming effects3, which can be reduced by acquisition during systole, and (irregular) cardiac motion. Thus, as an alternative to the commonly used inversion-recovery method, saturation-recovery T1-mapping has been introduced to provide more accurate T1-values and better resilience towards heart-rate variability at 1.5T4. In this work, we study the advantages of saturation-recovery T1-mapping during systole in ten healthy volunteers and five patients with arrhythmia at 3T.Materials and Methods
Sequence
T1-mapping was performed with an ECG-triggered SAPPHIRE5 magnetization preparation. In systolic acquisition, the limited time between the R-wave and imaging enables only insufficient signal for conventional saturation-recovery T1-mapping. Thus, systolic SAPPHIRE has been adapted by shifting the saturation pulse behind the acquisition window in the preceding heartbeat. Four images were prepared with saturation only (WET module6); five images were acquired with an additional inversion pulse (adiabatic full passage tan/tanh pulse7) with variable delay after the R-wave; one image was acquired without preparation. Readout was performed with single-shot bSSFP and the following parameters: TR/TE/α=2.4 ms/ 1.0 ms/ 45°, in-plane resolution=2.3×2.3 mm2, slice thickness=8 mm, field-of-view=300×300 mm2, bandwidth=1085 Hz/px.
Data analysis
A 3-parameter least-squares fit was performed on phase-sensitive data after phase-unwrapping. Myocardial thickness was evaluated as the area between the LV endo- and epicardial borders. T1-times and ECV-values were evaluated according to the AHA 16-segment model. Precision was defined as the intra-segment variation, measured in terms of standard deviation. T1- and ECV-values between systole and diastole were statistically compared using paired student's t-tests (significance for p<0.05).
Data acquisition
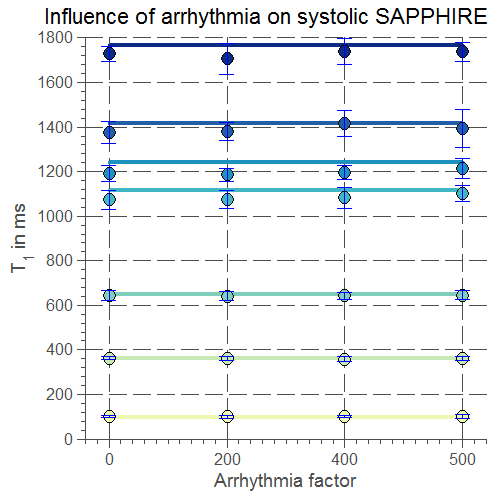
Images were acquired at a 3T MRI system (Magnetom Skyra). To study the influence of arrhythmia on T1-values in systolic imaging, phantom scans were performed with a simulated arrhythmia factor defined as the standard deviation of the Gaussian distribution with a mean RR-length of 1125 ms. To demonstrate feasibility and in-vivo accuracy, 10 healthy subjects (5 m; 25±4y), underwent T1-mapping before and 15 minutes after administration of 0.2 mmol/kg gadoterate meglumine (Dotarem; Guerbet, France). A hematocrit blood test was performed for ECV estimation. To show benefits in the presence of R-R variability, 5 patients (4 m; 51±21y) suffering from arrhythmia underwent native T1-mapping.
Results
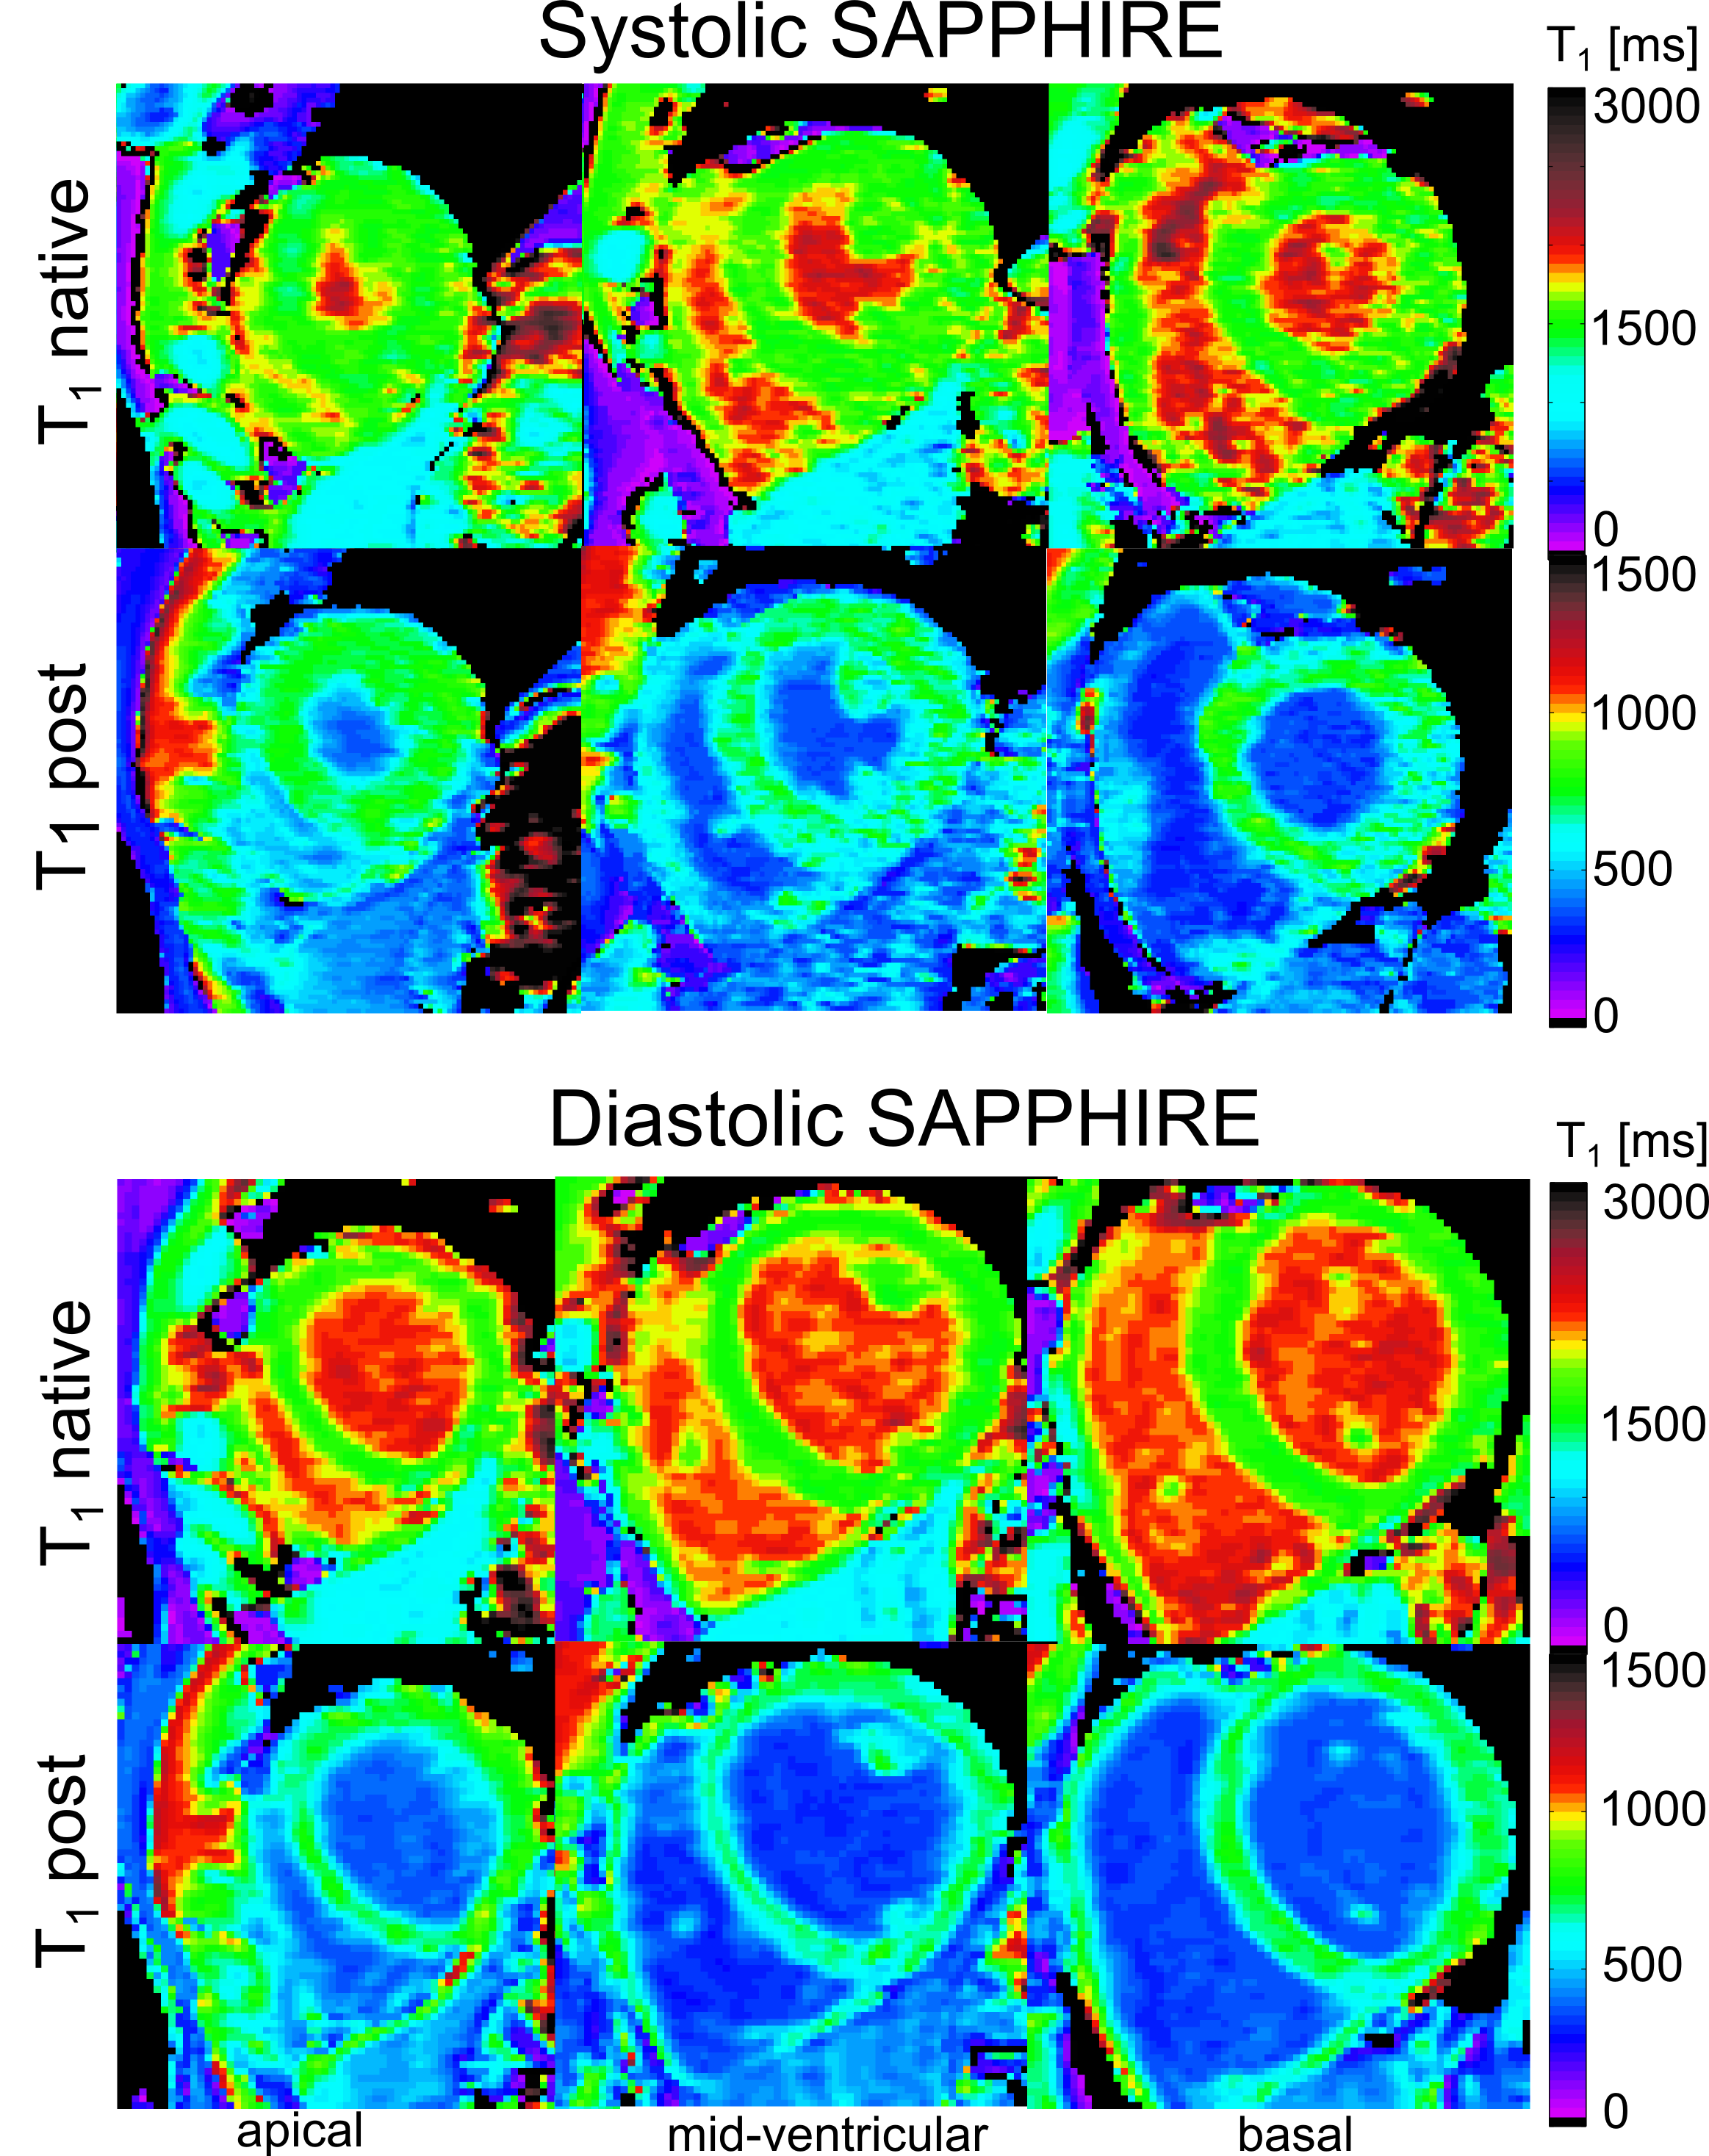
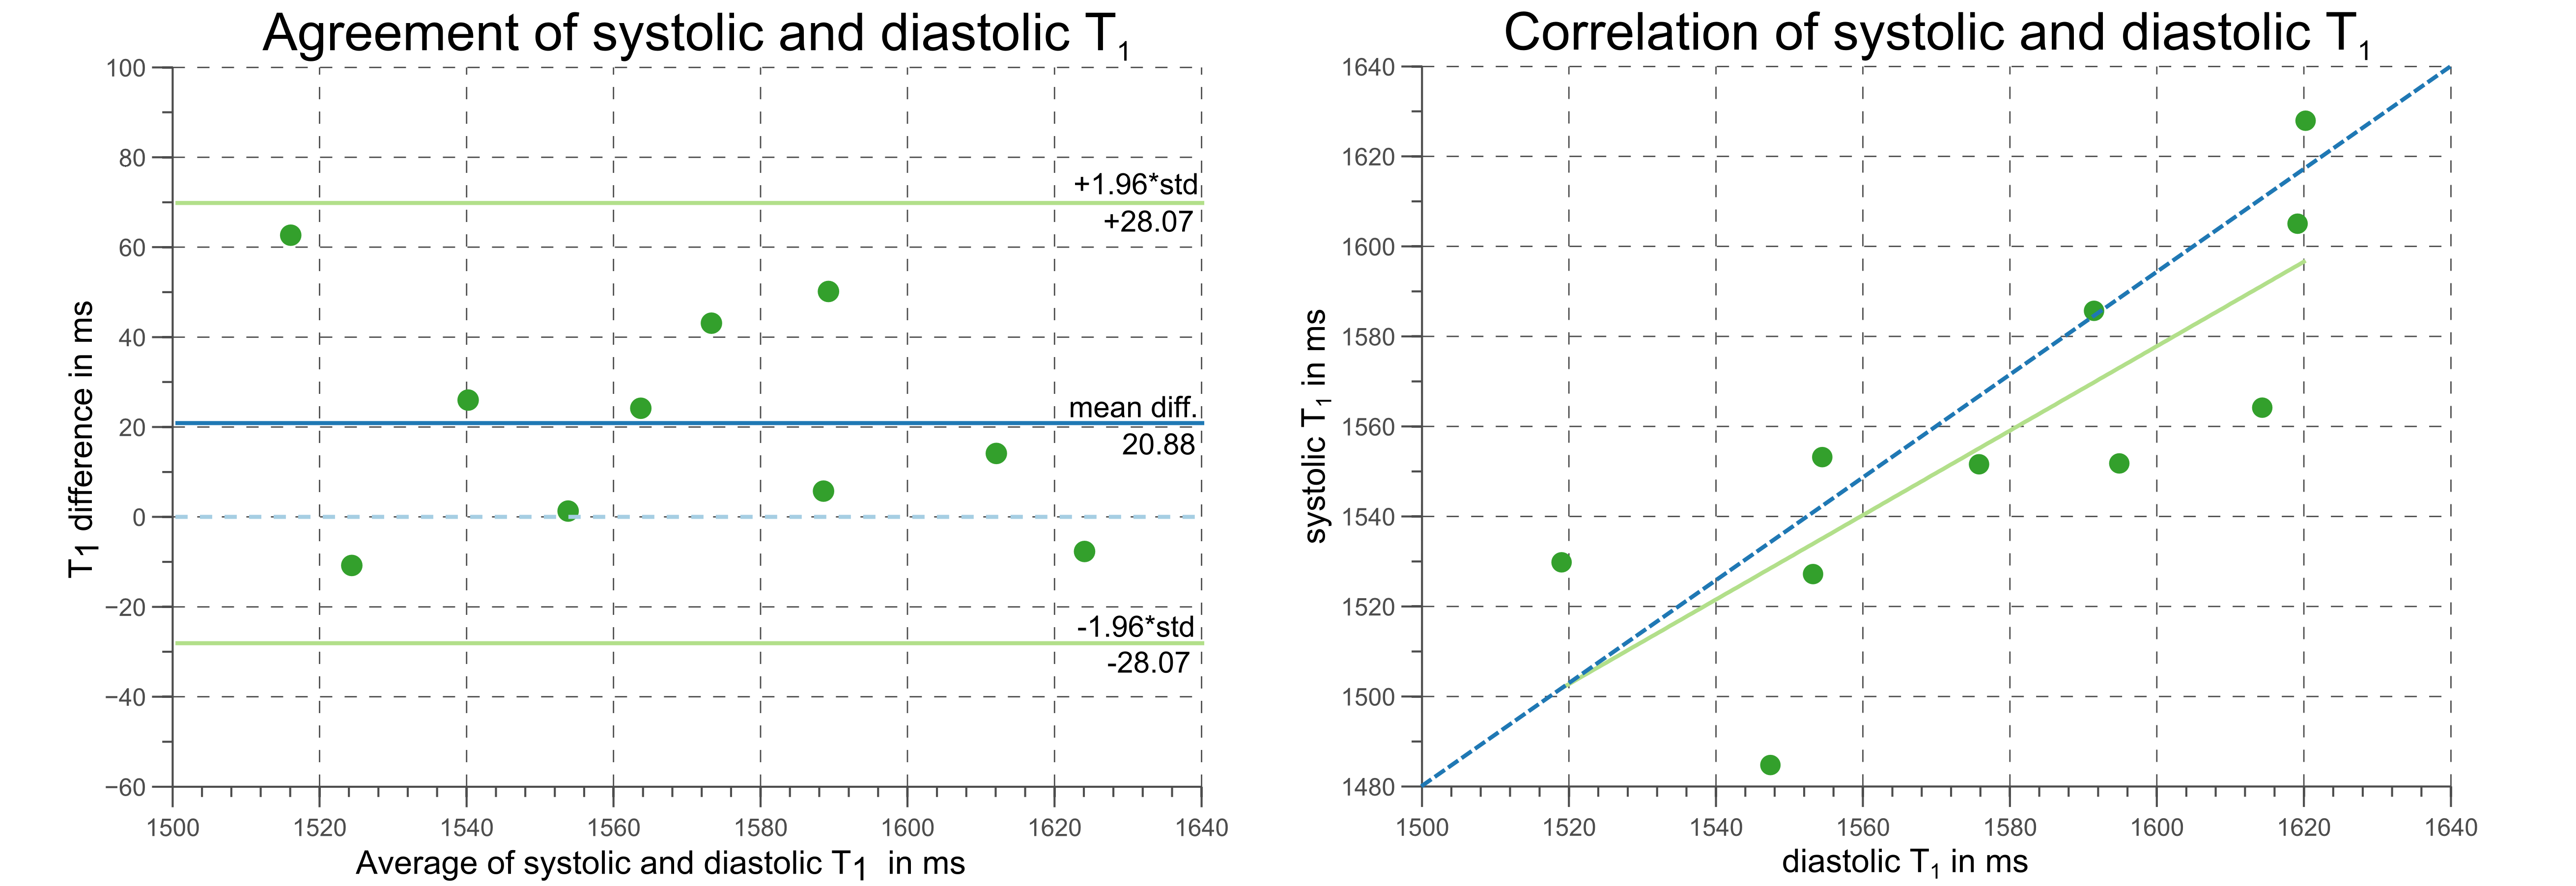
Systolic T1-values show no dependence on arrhythmia (CoV< 1%, Fig.1). In healthy subjects, high T1-map quality is obtained with both systolic and diastolic SAPPHIRE (Fig.2). An increase in apparent myocardial thickness in the T1-maps during systole (mid-ventricular slice: 254±63%) compared to diastole has been measured in average over all volunteers. Systolic SAPPHIRE T1-times (1557±58ms, precision: 56.7ms) are significantly lower than diastolic T1-times (1585±53 ms, precision: 84.4 ms) (p<10-4, Fig.3), which is additionally shown in the agreement and correlation plots (Fig.4), revealing a significant difference and a strong positive correlation between the two methods. Mean systolic and diastolic ECV values (0.212±0.03/0.206±0.03) are significantly different (p=0.035).
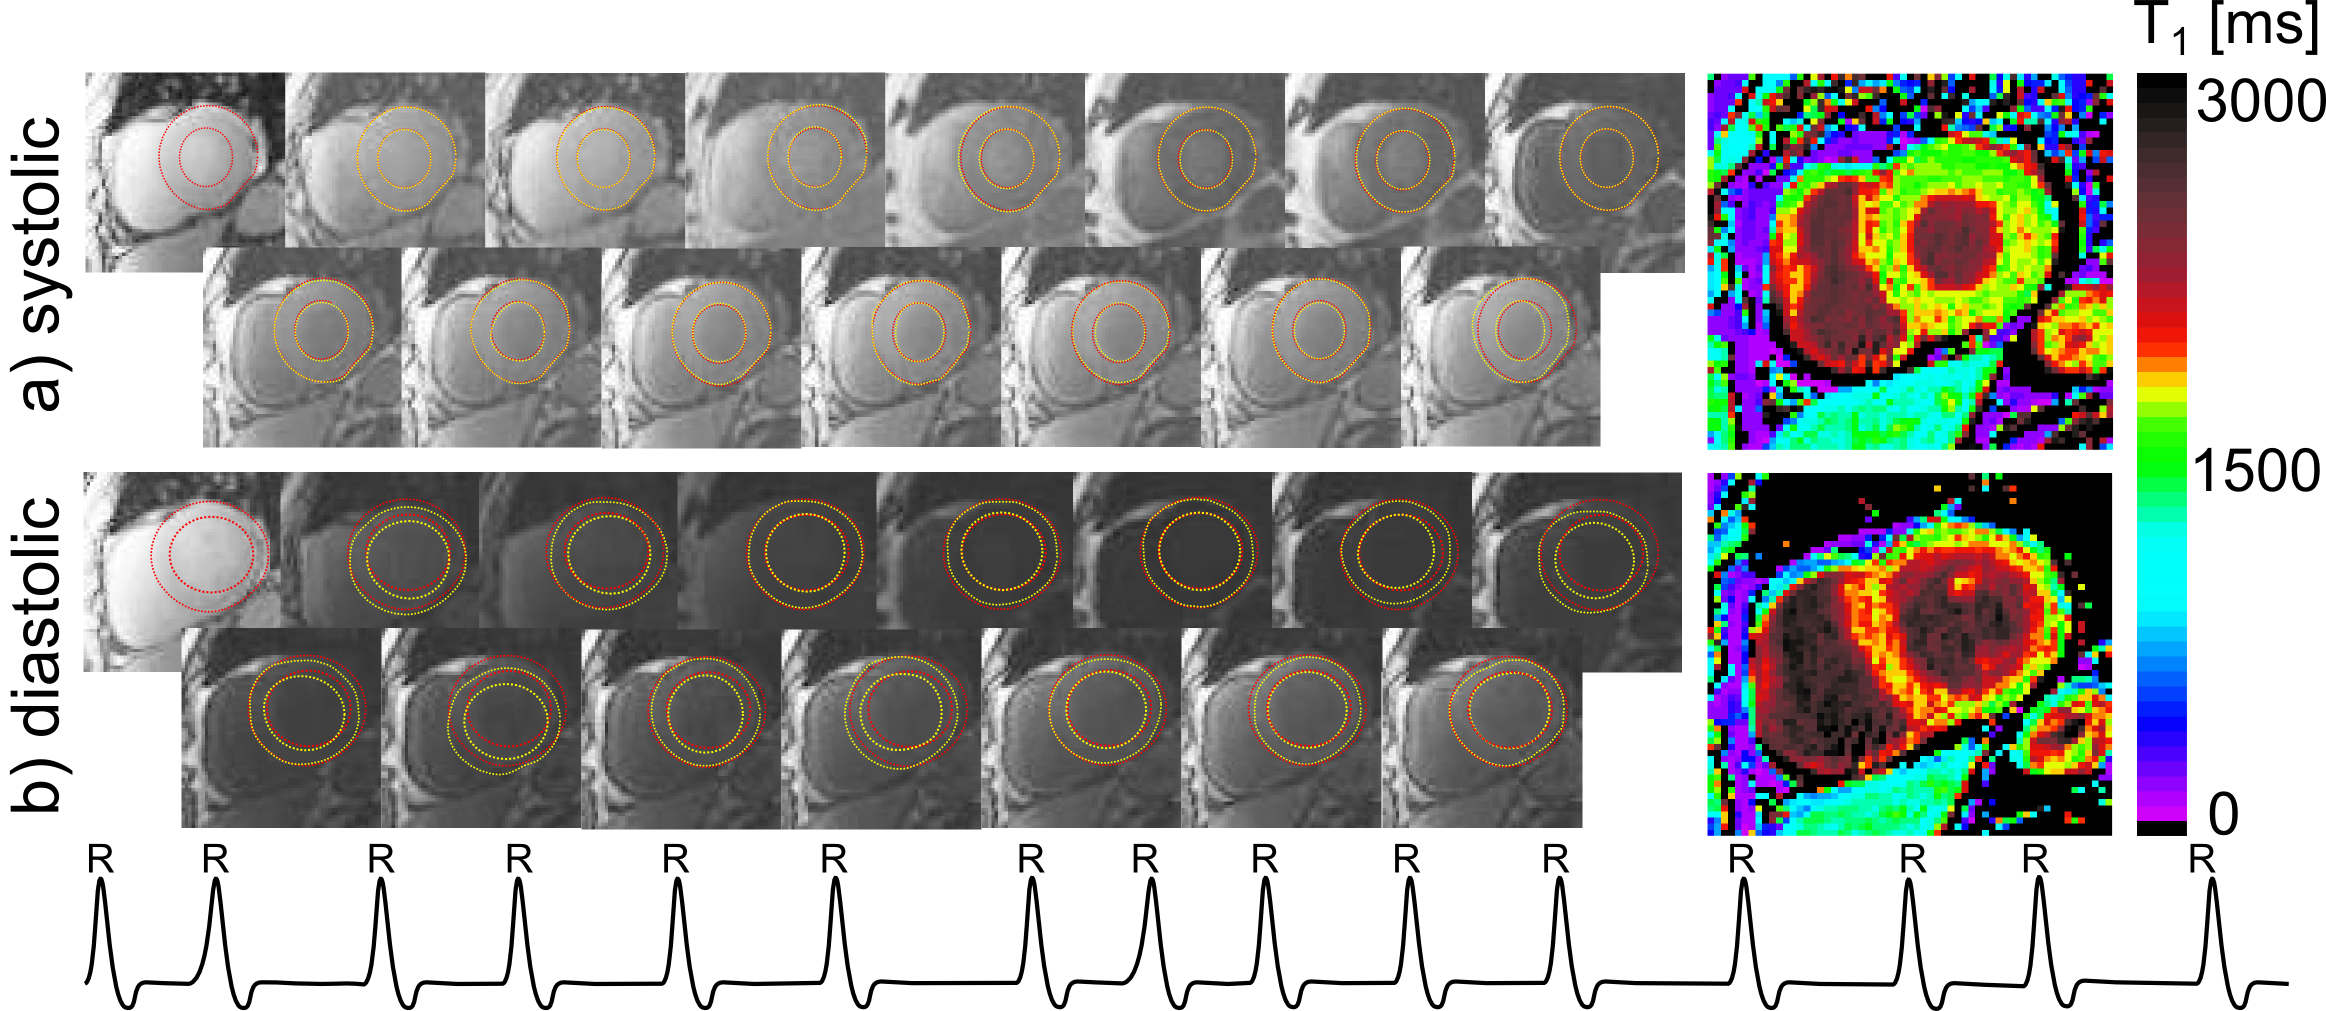
Fig.5 depicts exemplar T1-mapping results of one patient suffering from arrhythmia during the scan (m, 73y). In contrast to the systole, image artifacts in the septum are clearly visible in diastole, caused by mis-triggering due to a high variability in RR-length (RR (mean±std)=816±134 ms; min: 613 ms; max: 1068 ms).
Discussion and Conclusion
In this study, saturation-recovery T1-mapping was adapted to measure myocardial T1 during systole for application in arrhythmic patients. Robustness of the sequence towards arrhythmia could be shown in phantom measurements with a simulated irregular heart-beat.
In healthy volunteers, shorter mean T1-times during systole were found and are probably due to a reduction of partial-voluming artifacts, achieved by image acquisition at increased myocardial thickness. The reported T1-times are in good agreement with a recent study on saturation recovery at 3T8, reporting T1-times of 1578±42 ms and ECV-values of 0.20±0.02. Differences between systolic and diastolic T1- and ECV-values are significant despite the inter-subject variability. This is in agreement with an inversion-recovery study comparing diastolic and systolic T1-values9.
First feasibility tests in patients with arrhythmia showed that major variations in the duration of the diastolic rest-period led to imaging artifacts in diastolic T1-maps. Therefore, superior T1-map quality could be reached during systole, which is commonly not subject to timing variations.
In conclusion, our results show that the systolic saturation-recovery technique SAPPHIRE facilitates robust T1-mapping in arrhythmic patients.
Acknowledgements
We would like to thank Uwe Mattler for the help with data acquisition.
References
1. Sibley CT, Noureldin RA, Gai N, Nacif MS, Liu S, Turkbey EB, et al. T1 Mapping in Cardiomyopathy at Cardiac MR: Comparison with Endomyocardial Biopsy, Radiology. 2012;265(3):724-32.
2. Fontana M, White SK, Banypersad SM, Sado DM, Maestrini V, et al. (2012) Comparison of T1 mapping techniques for ECV quantification. Histological validation and reproducibility of ShMOLLI versus multibreath-hold T1 quantification equilibrium contrast CMR. J Cardiovasc Magn Reson. 2012;14: 88-88.
3. Weingärtner S, Meßner NM, Zöllner FG, Akçakaya M and Schad LR. Black-Blood Native T1 Mapping: Blood Signal Suppression for Reduced Partial-Voluming in the Myocardium. Magn Reson Med. 2016 (in press).
4. Roujol S, Weingärtner S, Foppa M, Chow K, Kawaji K, Ngo LH, et al. Accuracy, Precision and Reproducibility of Four T1 Mapping Sequences: A Head-To-Head Comparison of MOLLI, ShMOLLI, SASHA, and SAPPHIRE. Radiology. 2014;272(3):683-9.
5. Weingärtner S, Akcakaya M, Basha T, Kissinger KV, Goddu B, Berg S, et al. Combined saturation/inversion recovery sequences for improved evaluation of scar and diffuse fibrosis in patients with arrhythmia or heart rate variability. Magn Reson Med. 2014;71(3):1024-34.
6. Sung K, Nayak KS. Design and use of tailored hard-pulse trains for uniform saturation of myocardium at 3 Tesla. Magn Reson Med. 2008;60:997–1002.
7. Kellman P, Herzka DA, Hansen MS. Adiabatic inversion pulses for myocardial T1 mapping. Mag Reson Med. 2014;71(4):1428-34.
8. Weingärtner S, Meßner NM, Budjan J, Loßnitzer D, Mattler U, Papavassiliu T, et al. LR.Myocardial T1-Mapping at 3T using Saturation-Recovery: Reference Values, Precision and Comparison with MOLLI. J Cardiov Magn Reson. 2017 (in press).
9. Ferreira VM, Wijesurendra RS, Liu A, Greiser A, Casadei B, Robson MD, et al. Systolic ShMOLLI myocardial T1-mapping for improved robustness to partial-volume effects and applications in tachyarrhythmias. J Cardiov Magn Reson. 2015;28;17:77.
Figures