2717
Homomorphic determination of noise variance and denoising using a non-local means filter for assessing the accuracy of automated segmentation1CorTechs Labs, San Diego, CA, United States, 2Institute of Biomedical Engineering, Bogazici University, Istanbul, Turkey
Synopsis
Automated segmentation algorithms have been used more and more frequently for research and clinical purposes. There are available software packages that can determine volumes of brain structures and lesions. While signal to noise ratio in volumetric images is one of the determinants in the accuracy of such software, the effect of noise
PURPOSE
Automated segmentation algorithms have been used more and more frequently for research and clinical purposes. There are available software tools that can determine volumes of brain structures and lesions. While signal to noise ratio in volumetric images is one of the determinants in the accuracy of such software, the effect of noise to the output results is usually not well described. Using a homomorphic approach1 we determined the amount of noise variance present in the input images of a commonly available automated segmentation tool (NeuroQuant, CorTechsLabs Inc., San Diego, CA, USA) and used a non-local means filter2,3 to denoise these images. We studied the accuracy of noise variance determination, the effect of increased noise on segmentation of images, and the reproducibility of segmentation results with and without denoising input images.METHODS
We used three different sources of images in our calculations: 1) A synthetic MR phantom where 10 different levels of noise were added to eight different signal levels resulting 80 different signal-to-noise (SNR) conditions where SNR varied from 250 to 0.2 to test the accuracy of noise variance determination, 2) A 3D volumetric MR image dataset of a subject with added noise at eight different levels to test noise dependence of segmentation, 3) 3D volumetric MR imaging data from 46 subjects who are scanned and rescanned to test reproducibility. 12 subjects were scanned in the same scanner in the same imaging session; 12 in the same scanner in the same day after repositioning in between two imaging sessions; 11 in the same scanner but in a different imaging session within a month of the original scan; 11 in different MR scanners within one month of the original scan. Following the work of Aja-Fernandez1, we implemented a Gaussian noise-estimator as: σg(x) = sqrt(2) exp{LPF{log|I(x) – E{I(x)|} + ɣ/2} where ɣ is Euler-Mascheroni constant, E{I(x)} is the expectation value of the MR signal I(x), LPF is low-pass filtering operation and x is the location parameter; and a Rician noise-estimator as: σr(x) = σg(x) exp{ - φ(SNR(x))} where φ(SNR(x)) is an SNR dependent Rician correction factor to Gaussian noise-estimator1,4. Using the noise-estimators (sigmas), we calculated the noise variance from all images and used the nonlocal means filter to denoise all images2,3. Using the automated segmentation tool (NeuroQuant, CorTechsLabs Inc., San Diego, CA, USA) we segmented the brains of all subjects and determined volumes from 42 (21 from right and 21 from left) different brain structures. For quantifying the reproducibility measurements, we correlated the volumes measured in two studies for each subject and calculated the average correlation for all 42 structures for all 46 subjects. We used a t-test to test the difference of the correlations between scan/rescan datasets with and without denoising.RESULTS
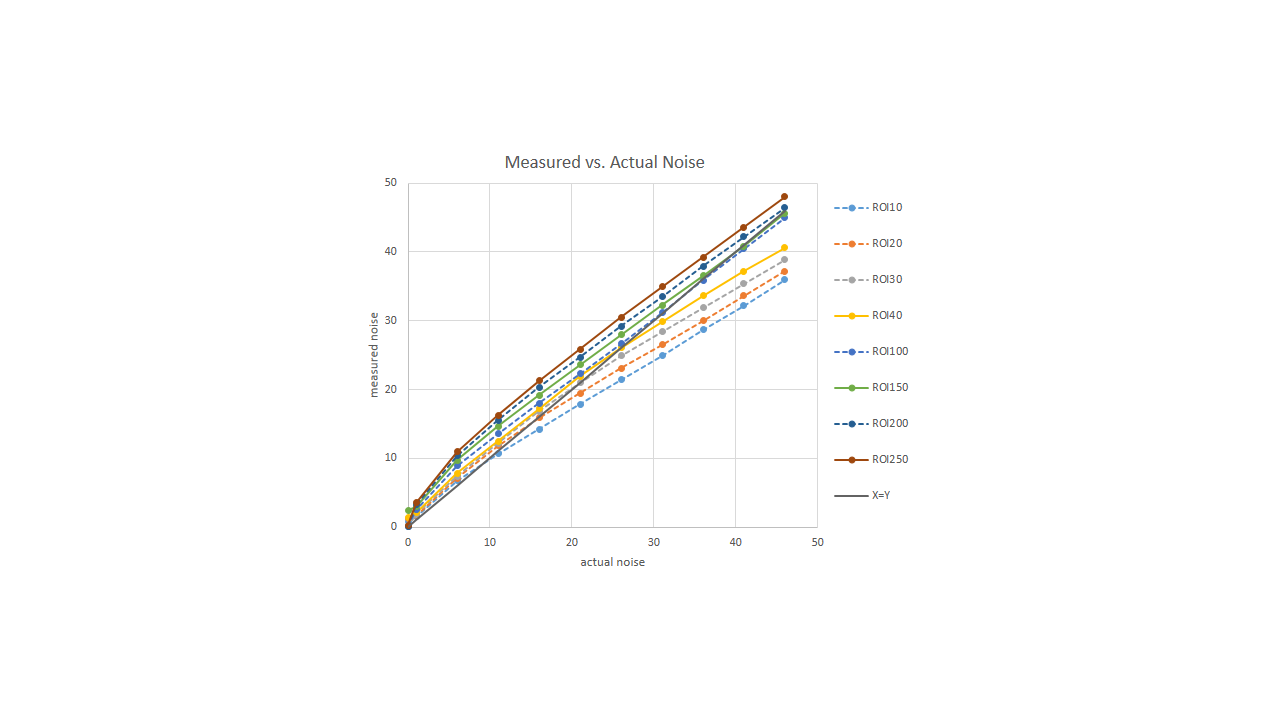
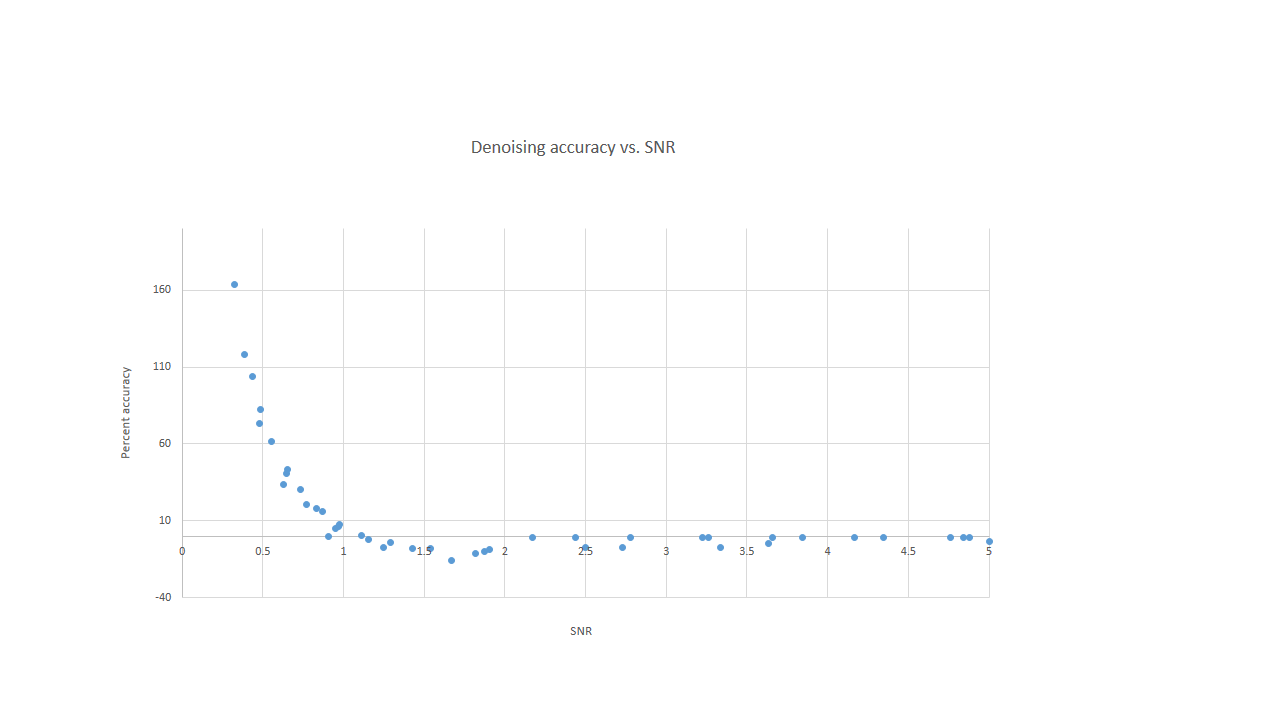
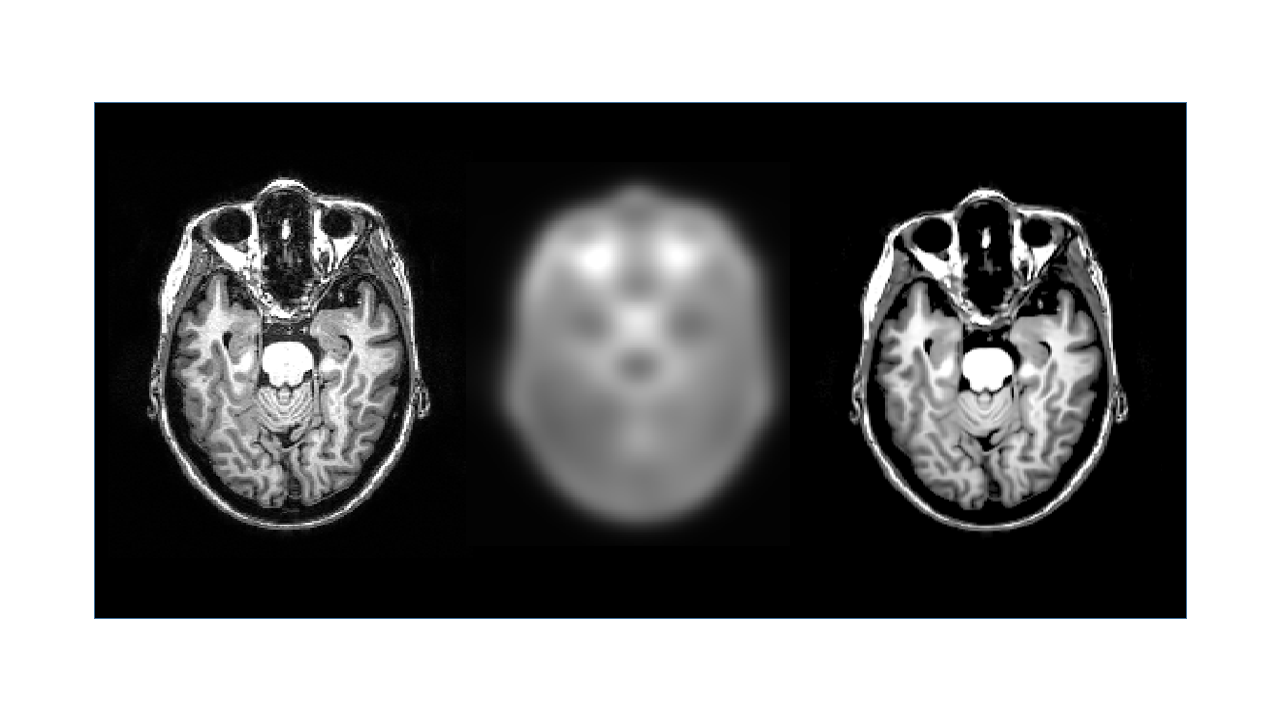
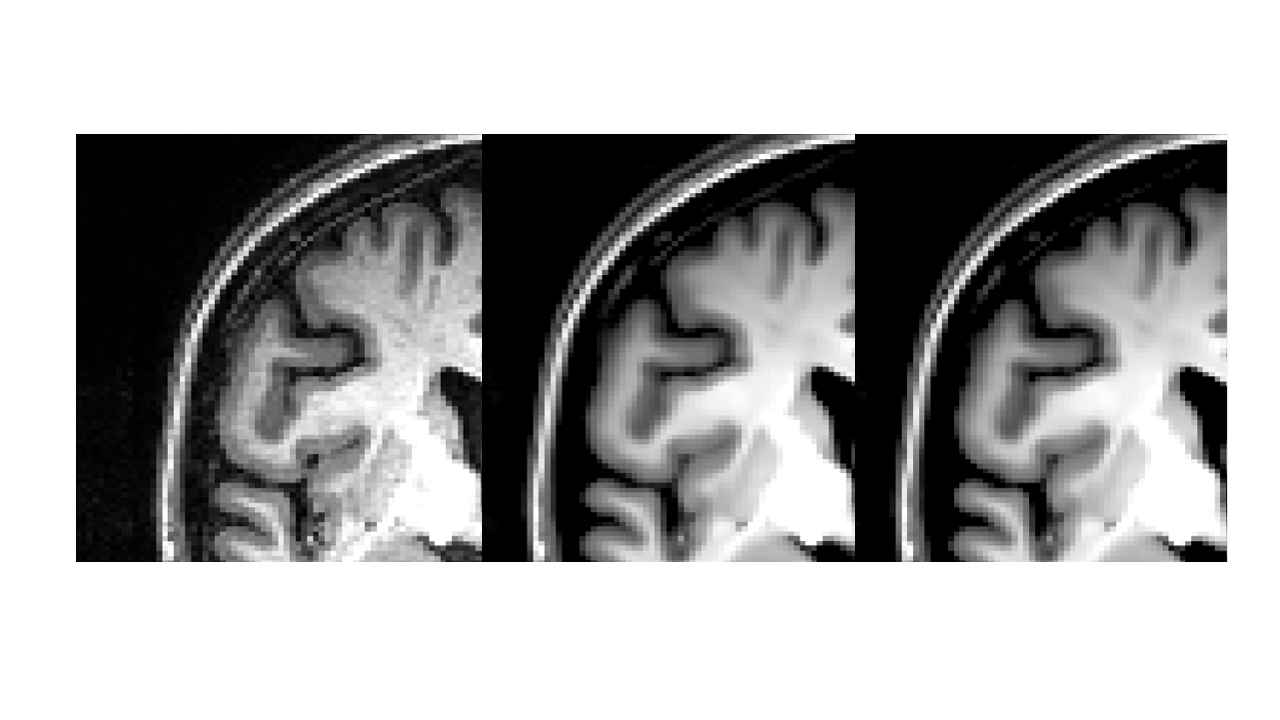
Noise variance measurements on the noised added synthetic dataset showed that noise variance can accurately be estimated from the image data when SNR is above 1. Figure 1 shows measured noise levels versus the added noise from the synthetic dataset. Figure 2 shows the accuracy of denoising algorithm from the dataset with added noise. Figure 3 shows a T1-weighted image of a subject (left), its calculated noise sigma map (middle) and the denoised image (right) using the calculated noise variance and non-local means filter. Figure 4 shows a detail of original image (left), the denoised image (middle) after Gaussian noise variance calculation, and the denoised image with the Rician noise estimation correction.DISCUSSION
Noise variance was accurately determined from the images using homomorphic approach and the denoising using non-local means algorithm utilized this measured noise variance to denoise the images. The accuracy of noise variance determination depends on SNR and is satisfactory above SNR of 1. The accuracy of denoising using the estimated noise variance also depends on SNR and produces excellent results above SNR of 2. The reproducibility results of scan/rescan dataset showed that the Pearson's correlation between scan/rescan determination of volumes using original images and denoised images were not statistically different (2-tail, t-test, p>0.5). Between the first and second MR scan, the original images have an overall correlation of segmented brain volumes with r=0.97 and the denoised images have overall correlation with r=0.98.CONCLUSIONS
Homomorphic approach produces accurate noise variance estimation and can be used for quality assessment for segmentation algorithms. Non-local means filter denoising using the estimated noise variance increased image quality. Although reproducibility results showed that denoising did not significantly improve the automated segmentation results under normal conditions, the denoised images may have better noise immunity than the original images and denoising may help under low signal-to-noise conditions.Acknowledgements
No acknowledgement found.References
1) Aja-Fernandez S, Pieciak T, Vegas-Sanchez-Ferrero G. Spatially variant noise estimation in MRI: A Homomorphic approach. Med Image Anal. 2015 20:184-197.
2) Liu RW, Shi L, Huang W, XU J, et al. Magn Reson Imaging. 2014 32:702-720.
3) Coupe P,
4)
Figures