2710
Automated localization of 55Mn fiducial markers for coil array placement in hyperpolarized 13C MRI: dependence on number of acquired projectionsMichael Ohliger1, Cornelius von Morze1, Jermey Gordon1, Peder EZ Larson1, and Daniel Vigneron1
1Radiology and Biomedical Imaging, University of California San Francisco, San Francisco, CA, United States
Synopsis
Accurate RF coil localization is important for hyperpolarized 13C MRI. Fiducial markers can be constructed from 55Mn and localized using projection imaging. This study examines the minimum number of projections necessary to localize the markers subject to the known distances between markers. This would potentially allow marker localization to be automated as part of prescan.
Introduction
Receiver coil sensitivity calibration is important for hyperpolarized carbon 13 MRI, especially for parallel imaging. Low natural abundance prevents external measurements prior to the study, and acquisition of autocalibrating data cuts into possible acceleration by parallel imaging. Computed sensitivities are potentially useful for sensitivity correction but require precise knowledge of coil location. It has been proposed to apply direct detection of manganese-55 (55Mn) fiducial markers to precisely determine coil position (Ref 1). In this approach, markers are placed in a triangular configuration close to the coil conductor path. 55Mn resonates very close to 13C such that 55Mn images can easily be obtained using 13C coils (Ref 2). The markers can be rapidly localized through a short series of 1D projections, in which markers appear as spectral peaks corresponding to spatial locations along that axis (Figure 1). This approach could facilitate rapid, automated detection of marker location, just prior to 13C scanning, potentially reducing errors due to subject motion. The purpose of this study was to determine the minimum number of projections required for the purpose of 13C receiver coil sensitivity calibration.Methods
A prototype transmit-receive 13C RF coil was designed (Figure 1), with 3 small hollow balls made of high density polyethylene (Precision Plastic Ball Company) affixed and filled with approximately 20 μl of 3M NaMnO4. Projection spectra along the x-axis and y-axis were obtained using a 1D GRE sequence (TR 40ms, 64 averages), with acquisition time 3 s/projection. Although the spatial location of the spectral peaks can be measured from the frequency of the acquired data, it is not possible to know which peak corresponds to which marker. There are, in general, 6 possible permutations for each projection. However, the distance between markers can be measured exactly and used to constrain the possible combinations. In order to test this strategy and determine the number of required projections, we performed simulations using Matlab. Vectors corresponding to the marker positions in Figure 1 were constructed and subject to rotations along three axes (Figure 2). A total of 24,624 possible rotations were considered in order to simulate all possible positions of the coil. For each rotation, the triangle vertices were projected along x-, y-, and z- axes. All possible fiducial marker assignments were made that were consistent with the projections. In general, there were 6 x 6 x 6 = 216 possible configurations for each rotation tested. For each of these potential marker configurations, the distance between markers was constructed and computed with the known values. The optimal candidate was selected by minimizing the root mean square of the computed and known marker distances (Figure 3). Ideally, there should be only one candidate configuration, corresponding to the actual location of the markers. In that case, marker localization (and therefore coil localization) could be completely automated. When more than one candidate configuration was obtained from the algorithm described above, additional projections were incorporated by simulating projections along two additional directions: 1/sqrt(3)[1,1,1] and 1/sqrt(3)[1,-1,1]. Candidate configurations were selected that correctly predicted the projections along those axes.Results
The number of candidate configurations depended on the root mean squared threshold placed on the candidate distance between the markers compared to known marker distances. For a threshold of 0.01 mm, 3 projections yielded 192/24,624 rotations with 4 candidates, 1,410 rotations with 2 candidates, and 23,022 (93%) with only one candidate (Figure 4a). If a 4th projection was incorporated, then 24,608 (99.9%) of possible rotations have only a single candidate configuration. When a 5th projection was incorporated, all rotations had a single candidate configuration. Using a larger or smaller cutoff changes the relative number of rotations that have a single solution.Discussion
The minimum number projections needed to accurately determine coil position was previously unknown. For example, when considering projections onto the three cardinal axes, there are potential reflections that give exactly the same projections and therefore cannot be distinguished. Additional oblique projections could resolve this ambiguity, but each projection increases scan time and so it is important to know the minimum number of projections necessary to achieve accurate localization. Under ideal conditions, five projections completely localized a triangular set of fiducial markers, bringing forward the possibility of automated detection of coil positioning, potentially as part of a prescan. However, achieving this requires very high precision in the measurement of the relative coil positions (0.01 mm), which may be challenging in practice. Furthermore, we have not considered noise effects or the finite resolution of the acquired spectra, which may also impact the number of projections needed.Acknowledgements
Funding NIBIB P41EB013598References
1. Ohliger MA, et al "55Mn Fiducial Markers for Automated Coil Localization and Sensitivity Determination for Use With Hyperpolarized 13C MRI." ISMRM 2016 pg 3620
2. Morze von C, Carvajal L, Reed GD, Swisher CL, Tropp J, Vigneron DB. Magnetic Resonance Imaging. Magn Reson Imaging 2014;32:1165–1170. doi: 10.1016/j.mri.2014.08.030.
Figures
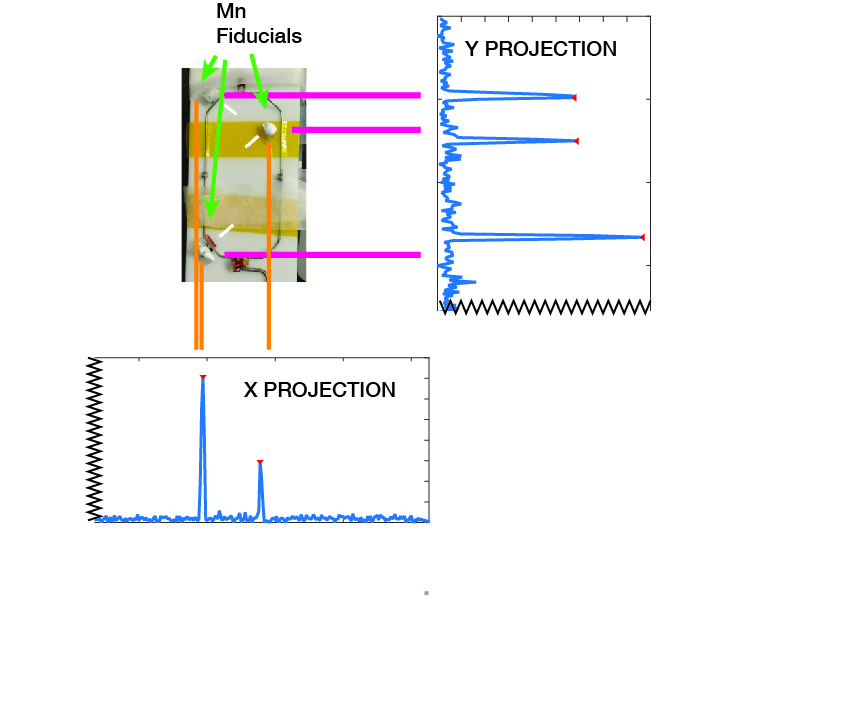
Figure 1. 13C RF coil used to acquire sample spectra. Fiducial location shown with arrows. Projection spectra along the x and y axes are shown, corresponding to the three markers. Note that two peaks are seen on the x projections since both markers project in same location.
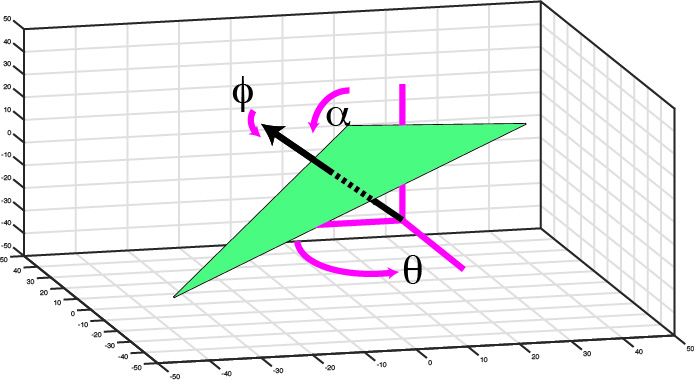
Figure 2. Schematic diagram showing the rotations employed in the simulations. Triangle is shown with vertices corresponding to the fiducial markers. Rotations are performed around three axes as shown. A total of 24,624 possible rotations were considered.
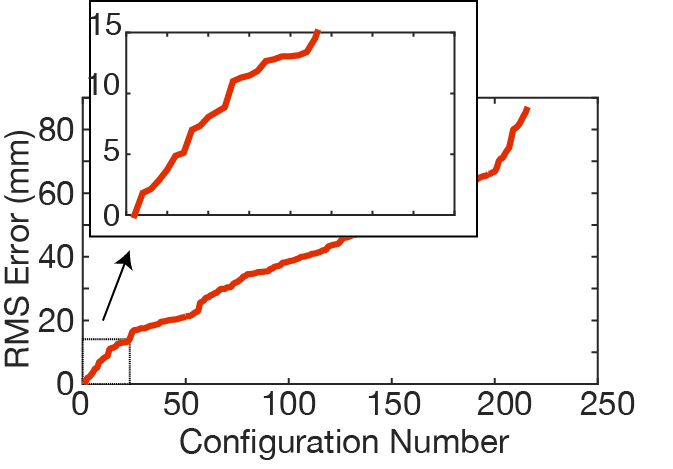
Figure 3. For a single rotational state, root mean sqauared deviation of each possible permutation of peak assignments. The optimal configuration has the lowest root mean square deviation, and corresponds to the actual marker locations.
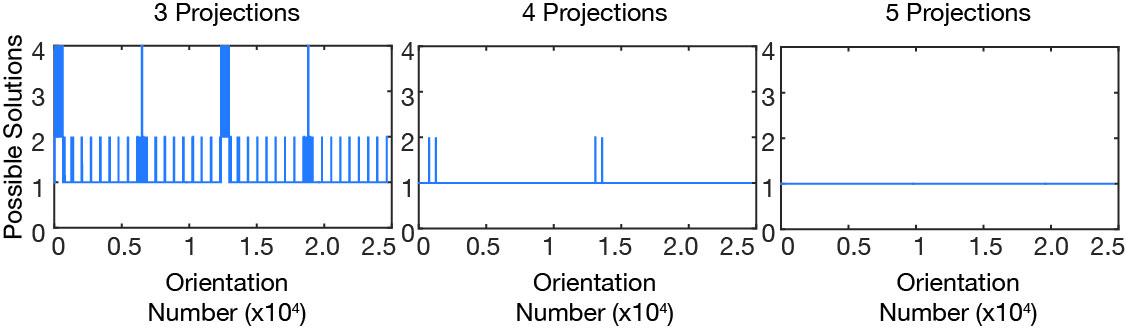
Figure 4. Number of possible candidate configurations that meet the constraint of matching the known relative distances of the markers. In the ideal case, there is only one candidate for each rotation. a) results when 3 projections, b) 4 projections, or c) 5 projections are used.