2695
The effect of Gaussian Filtering in ZTE based Attenuation Correction of PET/MRJ.M. Sousa1, Håkan Ahlström1, Mathias Engström2, and Mark Lubberink1
1Department of Surgical Sciences, Uppsala University, Uppsala, Sweden, 2GE Applied Science Laboratory, GE Healthcare, Sweden
Synopsis
Zero-Echo Time (ZTE) has been proposed as an alternative attenuation method for PET-MR brain imaging. However, the filtering effects on these ZTE AC maps have not been explicitly discussed, in relation to effects on reconstructed and corrected images, and that is what we aim to develop in this study.
Purpose
Pseudo-CT imaged based on Zero-Echo Time (ZTE) has been proposed as an alternative attenuation method for PET-MR1. Previous studies2 have shown that PET-MR data corrected using a ZTE-based AC map, with no filtering, correlates well with an AC gold standard; the transmission scan acquired using rotating 68Ge rod sources. However, the filtering effects on the ZTE attenuation correction map have not been explicitly discussed, in relation to effects on reconstructed and corrected images, and is what we aim to explore in this work.Methods
Four patients
underwent a 10 min 15O-water scan on an integrated time-of-flight
PET/MR (Signa PET/MR, GE Healthcare, Milwaukee, WI). . After generating a ZTE
based attenuation map for each subject, accordingly to the method proposed by
Wisienger et al.3, Gaussian filtering was applied with four
different full widths at half maximum (FWHM) 0, 3, 5, and 10 mm. PET images
were reconstructed using time-of-flight ordered subset expectation maximisation
(OSEM) with 4 iteration, 28 subsets, a reconstruction matrix size of 265 x 256,
5 mm Gaussian post-filter, using both ZTE and atlas-based attenuation maps.
Volumes of interest were defined using a probabilistic template over the
co-registered T1w image and transferred to all PET datasets. Total activity concentration
values were calculated for 4 major brain regions: anterior cortical (ACR -
cingulated and frontal gyrus), posterior cortical (PCR – occipital, parietal
and somatosensory-motor cortex), limbic (LR - amygdala, hippocampus, hypothalamus,
thalamus) and basal ganglia (BG - caudate nucleus, putamen), as well as whole
brain, for each of the four filters.
Relative differences ($Diff = X1 – Xref / Xref
*100$), between the ZTE corrected images with a filtered AC map and with
an unfiltered (0 mm), ZTE corrected with a filter AC and the vendor’s atlas
method (HA), and Bland-Altman analysis were computed.Results
Considering the entire brain and the comparison between ZTE corrected images with a filtered AC and non-filtered, there is a general overestimation (~0.8%) of activity for all volumes and filter sizes. The smallest difference and bias was seen in the 5 mm filtered image (0.50% and 0.51% respectively) while the highest was observed for the 3 mm filtered image (1.10% and 1.09). For both BG and LR, the 5 mm filter exhibited a difference of 1.38 % and 1.56%, respectively, and a bias of around 1.4% (1.37% and 1.55% respectively). In regard to ACR and PCR, the 3 mm filtered image appeared to have the smallest difference (-0.80% and -3.38%) and bias (-0.83% and -3.46% respectively). Even more, when comparing the Diff between the ZTE corrected images, both with filtered and non-filtered AC maps, and the manufacturer’s HA method, we depict a higher Diff (0.56%) for the image in which the 3mm filter was used and the lowest in the one using the 5mm Gaussian filter (-0.03%). All comparisons can be found in Table 1, Table 2, and Figure 1.Discussion/Conclusion
There is a non-significant overestimation between the volumes reconstructed using a filtered and those with an unfiltered AC map, and also between ZTE and HA corrected images. The volume reconstructed using the AC map smoothed with a 5 mm Gaussian filter was the one showing the lowest difference and bias compared to the standard head atlas (HA) approach. We believe this can be explained by the ZTE method giving a thicker skull estimate than HA. Applying a slight smoothing to match the reconstructed resolution might be preferred to mitigate effects of AC map resampling, but optimal values has to be further investigated.Acknowledgements
No acknowledgement found.References
1 - J. M. Sousa, et al., Comparison of zero-echo-time, head-atlas and 68Ge-transmission attenuation correction for 11C-PE2I-PET-MR dopamine transporter imaging, P-89, NRM2016, Boston, USA
2- Delso, G., et al., (2015). Clinical Evaluation of Zero-Echo-Time MR Imaging for the Segmentation of the Skull. Journal of Nuclear Medicine, 56(3), 417–422.
3- Wiesinger F, et al. Zero TE MR bone imaging in the head. Magn Reson Med. 2016;75(1):107-114.
Figures
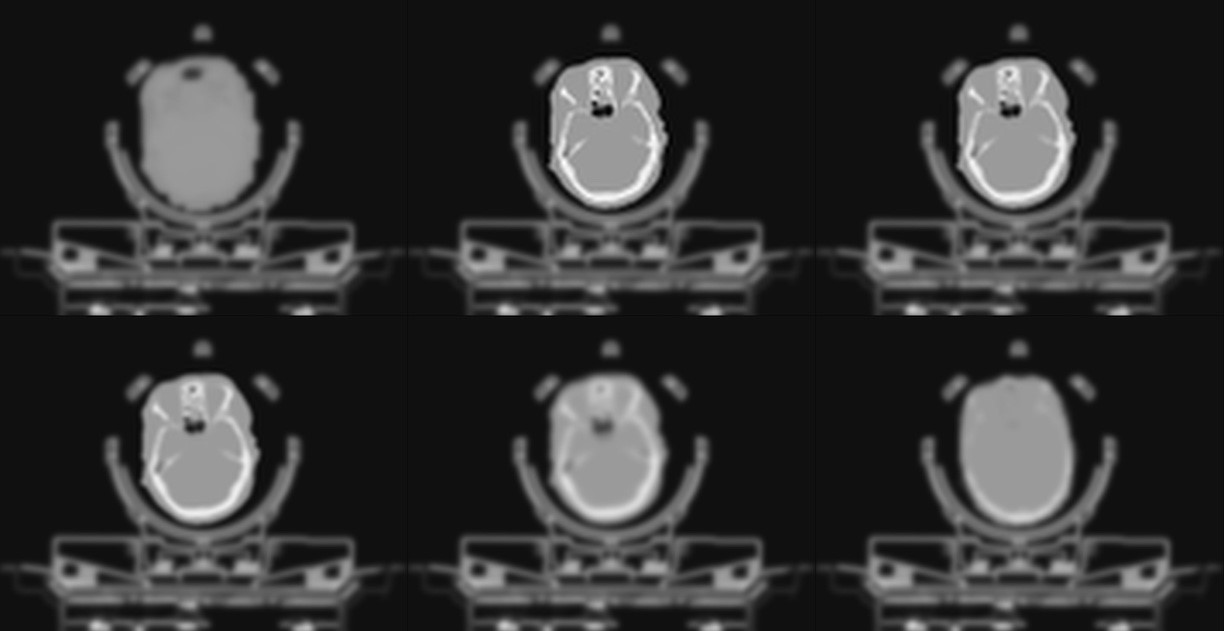
Figure 2 - The figure illustrates the different attenuation
maps ussed to correct for attenuation on PET images. Top row: Dixon 2 point AC
map, 0mm, and 3mm ZTE AC map. Bottom row: 5mm and 10mm ZTE and head atlas AC
map.
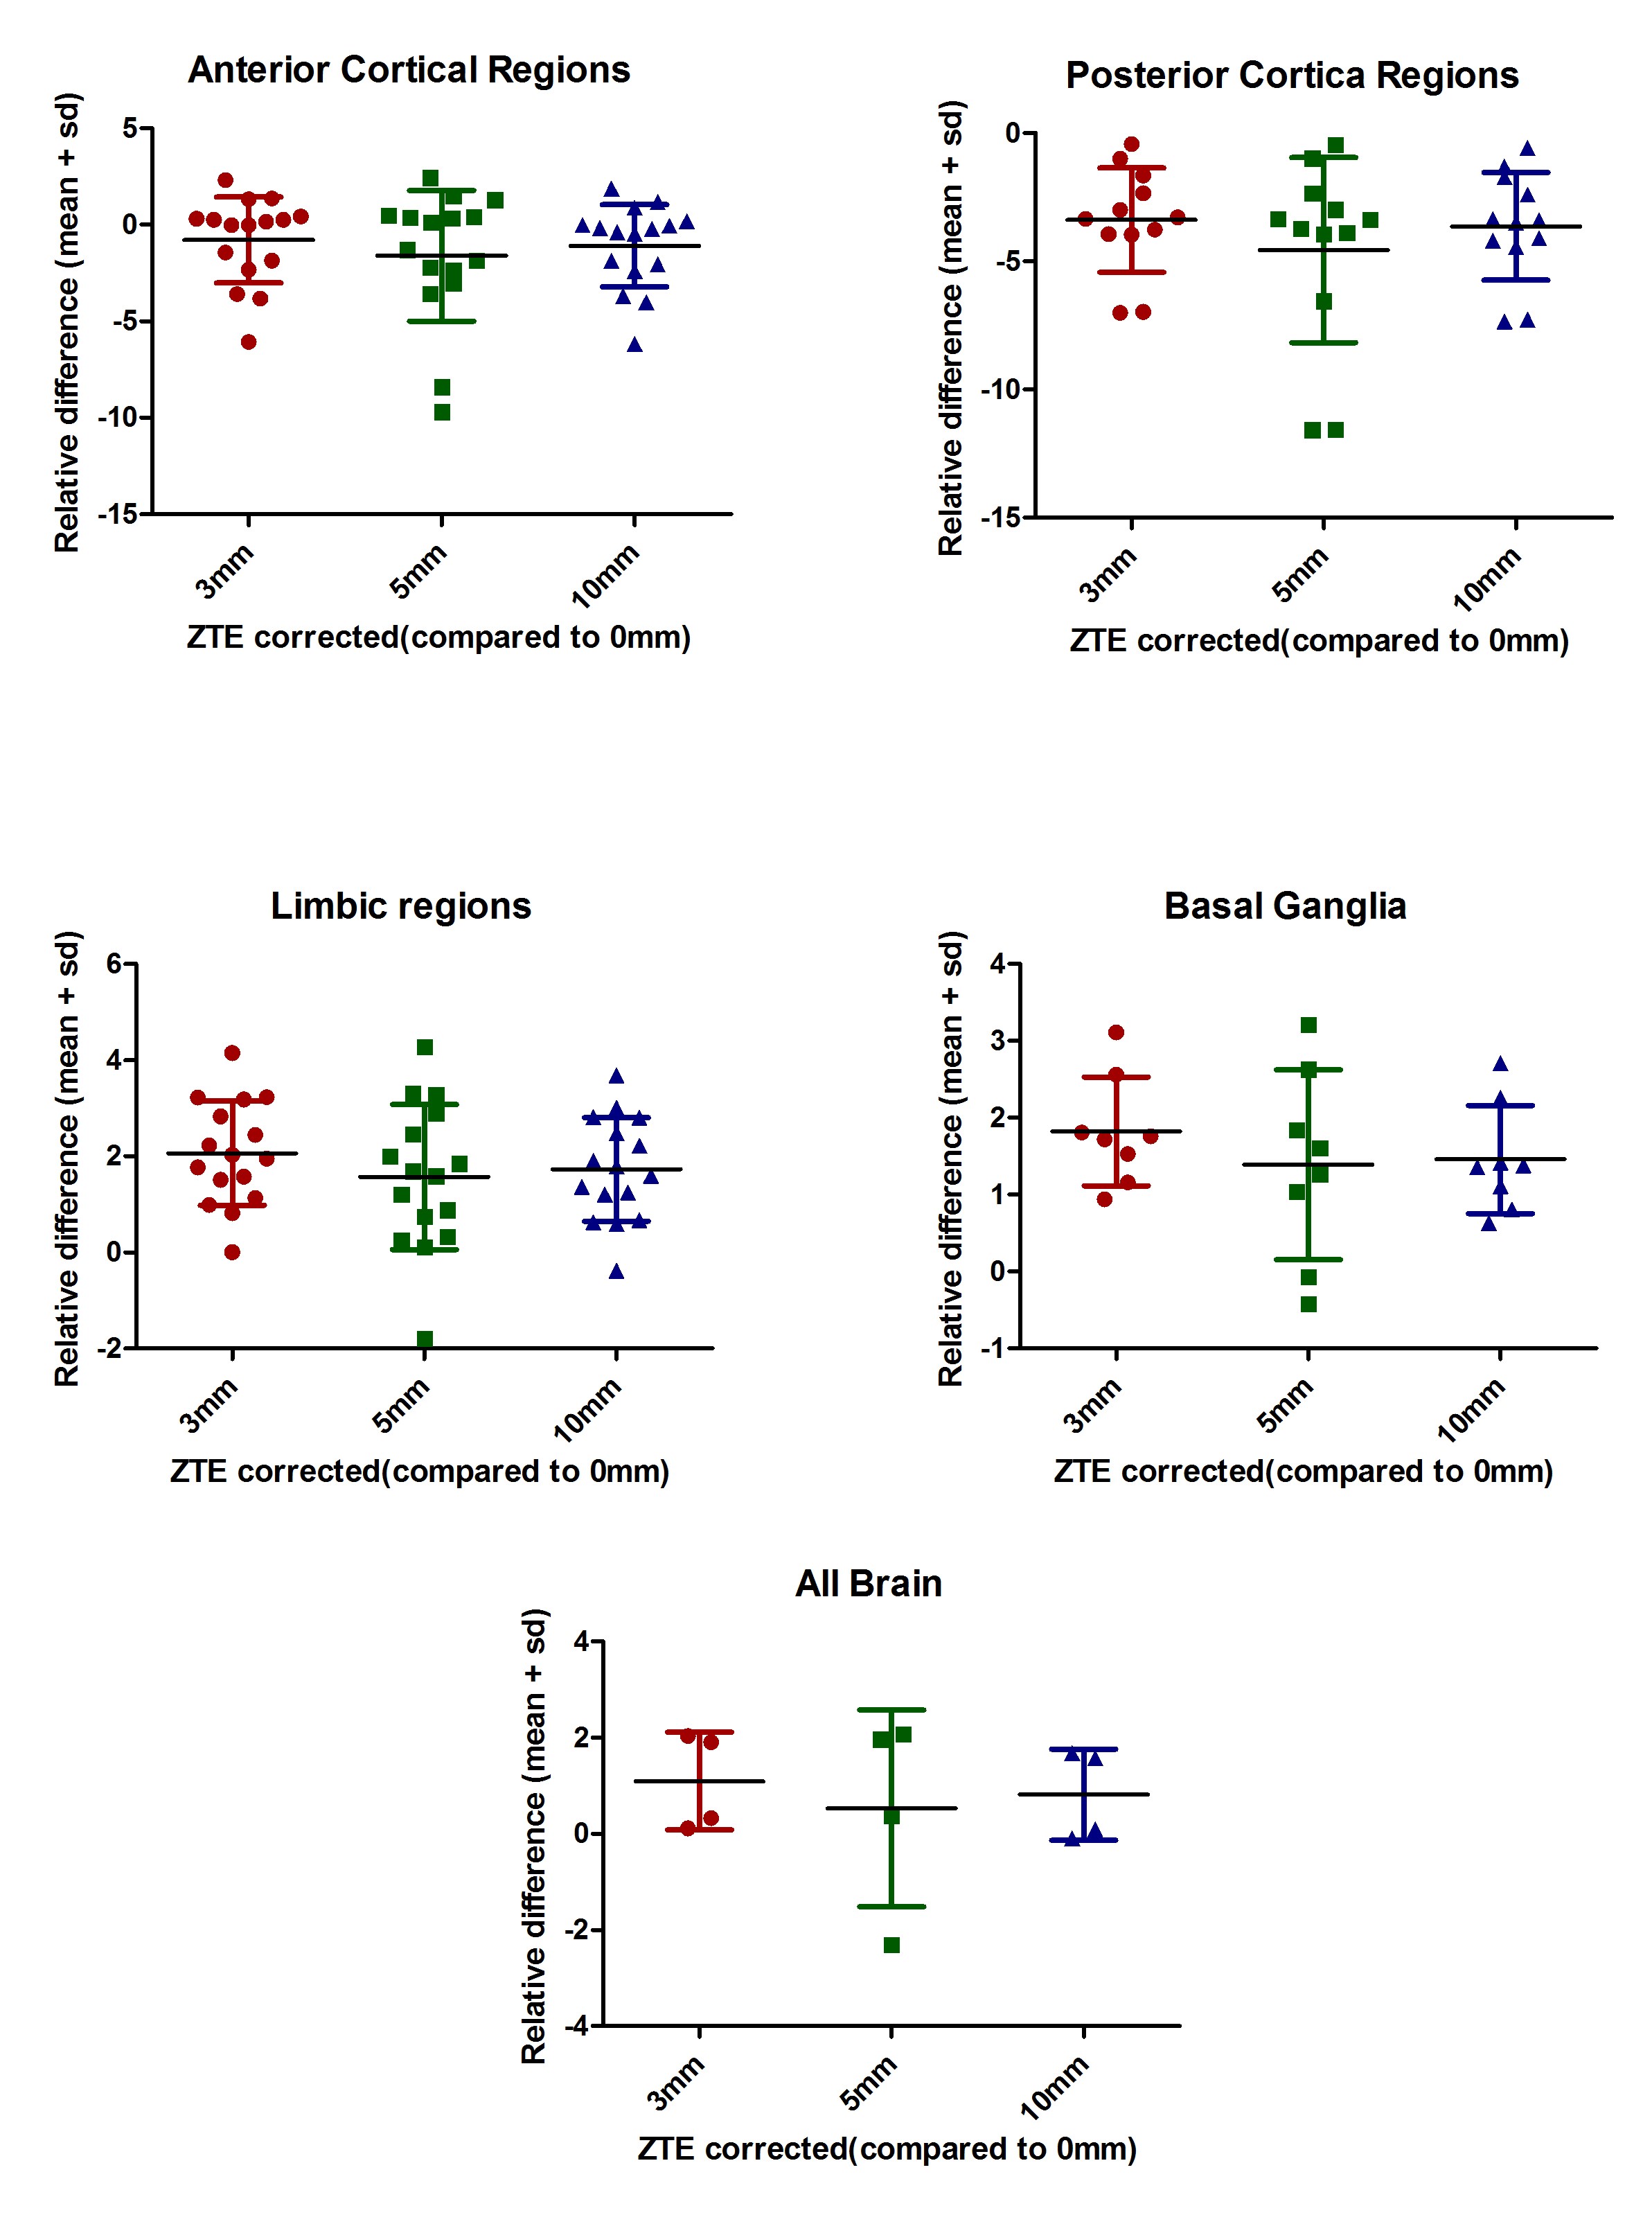
Figure 1 - Relative differences between ZTE corrected images using no filtering and 3, 5,
and 10 mm Gaussian filter on the AC map for four regions and All brain. The
values are given as percentage.
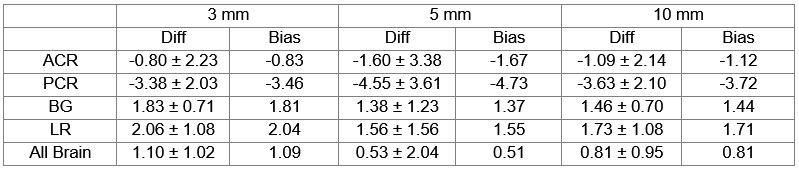
Table 1 - Relative difference
between images corrected using ZTE unfiltered and filtered AC methods with
different Gaussian FWHM values. Values are given as Diff ± standard deviation.
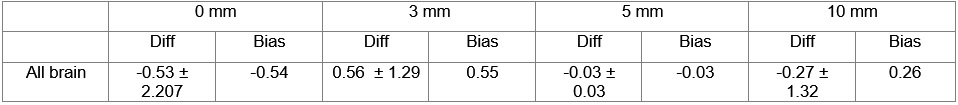
Table 2 - Relative difference between Images
corrected using atlas-based AC and ZTE based AC method using various Gaussian
FWHM values. Values are given as Diff ± standard deviation.