2678
Towards ultimate air-core magnetometer sensitivity for ultra-low field MRI: A design method1Centre for Advanced Imaging, UQ, Brisbane, Australia
Synopsis
Superconducting quantum interference devices (SQUIDs) are highly sensitive magnetometers and they have found application in ultra-low field MRI. However, they require cryogenics and their noise performance is hindered by external noise sources and the strong fields employed in pre-polarised MRI experiments. Air-core magnetometers provide an attractive alternative, as they are highly sensitive, robust and relatively cheap to manufacture. Our goal is to provide of a method to optimise the sensitivity of these devices. In this work we propose an accurate numerical model and the use of a genetic algorithm to consider previously unexplored coil configurations.
Introduction
The inherently low signal-to-noise ratio in ultra-low field MRI necessitates the need for highly sensitive magnetometers for signal detection.1 Superconducting quantum interference devices (SQUIDs) have been used in ultra-low field MRI, however they require cryogenics, are relatively large, and their noise performance is hindered by external noise sources and the strong fields employed in pre-polarised MRI experiments.2 In comparison, air-core magnetometers are robust and can be produced at a comparatively low cost. Additionally, their sensitivity can dramatically be improved by changing their layout.3 We thereby aim to investigate how air-core magnetometer sensitivity can be improved. Existing methods used for the design of air-core magnetometers are based on equations wherein limiting assumptions have been made to reduce the number of design variables, the consequence of which is a compromise in sensitivity. To improve air-core magnetometer sensitivity in the ultra-low field MRI regime (kHz range), we formulate the problem such that the number of assumptions made are reduced at the cost of increasing the number of design variables. The additional complexity introduced using a more complicated model requires the use of a genetic algorithm to optimally resolve air-core magnetometer design variables.Methods
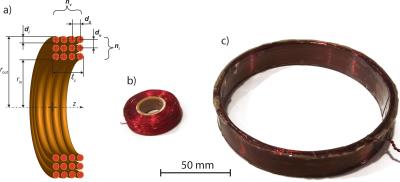
For the coil in Fig 1, AC resistance, inductance, parasitic capacitance and magnetic field to voltage conversion of the coil are obtained by knowing conductor location and diameter.4-6 Assuming wires are equally distributed within the coil winding, individual locations are estimated based on coil outer diameter ($$$r_{out}$$$), number of layers ($$$n_l$$$), turns per layer ($$$n_v$$$), conductor diameter ($$$d_i$$$) and wire spacing ($$$d_0$$$). Multi-strand Litz-wire is considered as well. For the pre-amplifiers, the non-tuned current-to-voltage (Fig 2a) and the tuned voltage-to-voltage (Fig 2b) configurations are evaluated. The losses introduced by capacitors are dependent on their capacitance and the frequency of operation, and are interpolated from a look-up table containing the equivalent series resistance for the specific type of capacitor used. The noise floor is calculated by considering the thermal noise of the coil ($$$e_s$$$), the noise from the pre-amplifier ($$$e_n$$$, $$$i_n$$$, and $$$e_{on}$$$), and the noise due to lumped circuit elements connected to the input of the pre-amplifier, namely tuning capacitors ($$$e_{C1}$$$ and $$$e_{C2}$$$). Body noise is negligible in the kHz range.1 Using the genetic algorithm available in MATLAB® we solve optimally for the following design variables: $$$n_l$$$, $$$n_v$$$, $$$d_i$$$ and $$$d_0$$$. Other parameters such as $$$r_{out}$$$, $$$l_{c-max}$$$, $$$e_n$$$, $$$i_n$$$, $$$e_{on}$$$, and the equivalent series resistance look up table for the tuning&matching ($$$C_1$$$ and $$$C_2$$$) capacitors are user defined. The tuned voltage-to-voltage design has an extra optimisation step to adjust the optimal transformation ratio of the tuning&matching network. Solutions using the self-resonance effect are avoided due to the difficulty associated with producing consistent coil stray capacitances during the manufacturing process.Results
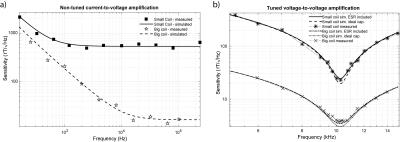
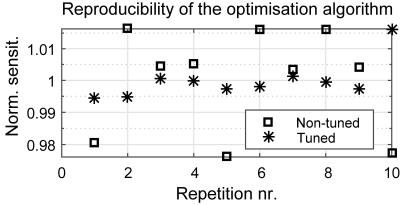
Table 1 provides the error between simulated and measured electrical properties of the prototype coils (see Fig 1b and Fig 1c) and magnetic field sensitivity is shown in Fig 3. Fig 3a plots the sensitivity in the case of the non-tuned current-to-voltage amplifier setup, and Fig 3b is the tuned voltage-to-voltage configuration. We also evaluated reproducibility of results obtained using the optimisation algorithm, see Fig 4. The coefficient of variation for the optimally resolved design sensitivity in the case of the non-tuned current-to-voltage configuration is 0.6%, and the best solution has 2.4% better sensitivity than the average across all solutions. For the tuned voltage-to-voltage configuration the values are 0.5% and 1.5%, respectively.Discussion
Experimental validation of the numerical model has been performed on non-tuned current-to-voltage and tuned voltage-to-voltage air-core magnetometer configurations. Accounting for the losses and noise introduced by the capacitors assure reliable sensitivity estimation and feasible capacitor choice. Besides, the optimisation algorithm appears robust against getting caught in local minima and show good convergence irrespective of values used to initialise design variables. With respect to the optimised average sensitivity achievable with proposed amplification modes, the non-tuned current-to-voltage design only outperforms the tuned voltage-to-voltage counterpart at frequencies below 100 Hz. We were able to predict that an air-core magnetometer design with average sensitivity below 7 fT√Hz at 3.3 kHz (bandwidth = 2 kHz and $$$r_{out}$$$ = 45mm) can be achieved. This is close to the sensitivity of SQUIDs.2Conclusion
Our experimental validation confirms accuracy of the numerical model used for air-core magnetometer design. The results of the optimisation algorithm confer the suitability of a genetic algorithm to solve this complex problem. The optimisation method will be made available via our webpage as open source. We envisage that our method can provide air-core magnetometer designs with unprecedented sensitivity across a range of ULF-MRI applications.Acknowledgements
Alan Pringle and Don Maillet for the technical support, Xiaoyong Xu for the coil winding machine and the The University Of Queensland for granting this study.References
1Edelstein WA, Glover GH, Hardy CJ, Redington RW. The intrinsic signal-to-noise ratio in NMR imaging. Magn. Reson. Med., 1986;3(4):604-18.
2A. N. Matlashov, L. J. Schultz, M. A. Espy, R. H. Kraus, I. M. Savukov, P. L. Volegov, et al., "SQUIDs vs. induction coils for ultra-low field nuclear magnetic resonance: experimental and simulation comparison," IEEE Trans. Appl. Supercond., vol. 21, pp. 465-468, 2011.
3Matlashov AN, Schultz LJ, Espy MA, Kraus RH, Savukov IM, Volegov PL, Wurden CJ. SQUIDs vs. induction coils for ultra-low field nuclear magnetic resonance: experimental and simulation comparison. IEEE Trans. Appl. Supercond., 2011;21(3):465-8.
4Martínez J, Babic S, Akyel C. On Evaluation of Inductance, DC Resistance, and Capacitance of Coaxial Inductors at Low Frequencies. IEEE Trans. Magn., 2014;50(7):1-2.
5Savukov IM, Seltzer SJ, Romalis MV. Detection of NMR signals with a radio-frequency atomic magnetometer. J. Magn. Reson., 2007;185(2):214-20.
6Sullivan CR. Optimal choice for number of strands in a litz-wire transformer winding. IEEE Trans. Power Electron. 1999;14(2):283-91.
Figures


