2674
Optimization via Ultra-high Permittivity Materials of Pad Effects in Dielectric Shimming at 7 Tesla MRI1Aix Marseille Univ, CNRS, Centrale Marseille, Institut Fresnel, Marseille, France, 2Centre Commun de Resources en Micro-ondes, Marseille, France, 3CEA-DAM Le Ripault, Monts F-37260, France, 4Siemens Healthineers, Saint Denis, France, 5CEA, DRF, i2BM, NeuroSpin, UNIRS, Paris-Saclay University, Gif-sur-Yvette, France
Synopsis
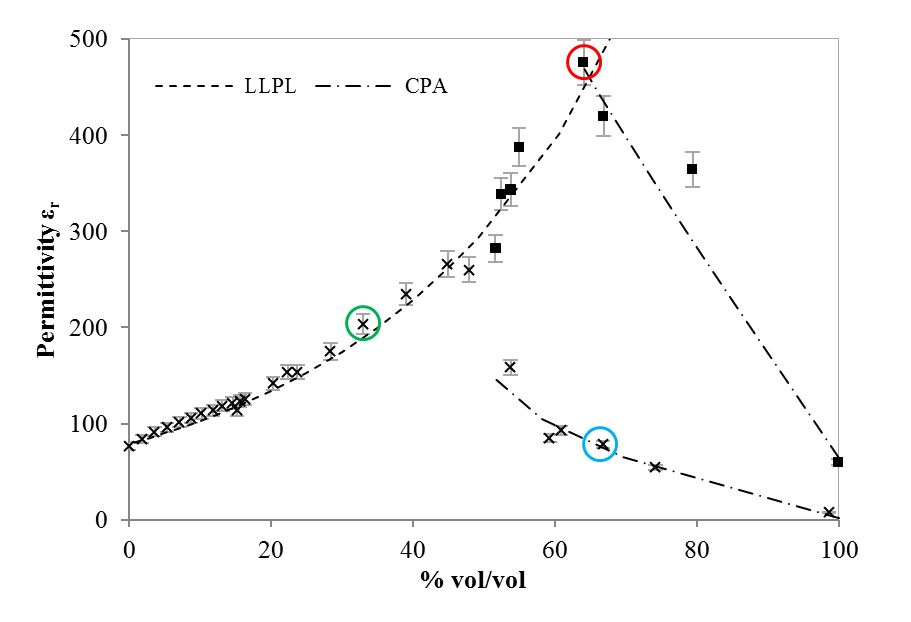
The influence of air fraction on the permittivity of BaTiO3 aqueous mixtures was assessed, with the aim of obtaining high permittivity mixtures. For extremely saturated mixtures (>50%v/v), the air fraction of the mixture plays a great role in determining εr, and by applying high pressure it is possible to go beyond the maximal value described in dielectric shimming literature. A BaTiO3 1cm-thick pad was manufactured (εr =470) and tested in a 7T MRI, as well as a conventional saturated pad (≈40%v/v, εr=200). Results show an overall signal improvement when using higher permittivity pads and the possibility to reduce pad-thickness.
Purpose
High-Dielectric Constant (HDC) materials, especially perovskites like Calcium Titanate Oxide (CaTiO3)1 and Barium Titanate Oxide (BaTiO3)2, have been used in the form of aqueous solutions in dielectric shimming, to locally correct B1+ fields in ultra-high field (UHF) MRI3. Generally, the geometry of these pads in their current form is considered “patient unfriendly”. Thus, the shape, size and geometry of the pad or chain of pads need further optimization4. One approach to do so is to change the permittivity or dielectric constant εr of the pads: with higher permittivity, it is possible to decrease its thickness2. To date, CaTiO3 and BaTiO3 mixed with various water quantities are the most common perovskite solutions being used for the purpose. Nevertheless, such mixtures are reported in the literature not to exceed εr=110 (CaTiO3) and εr=300 (BaTiO3)5,6. Since the maximum permittivity of CaTiO3 is of 150-160 (bulk), this perovskite will not allow greater εr than the values reported for BaTiO3 – which, depending on grain size, may have a bulk εr up to 10,0006. Thus, in this study, we focused on exploring the permittivity of BaTiO3 aqueous solution with varying water content; more specifically, the dielectric influence of the water fraction and of the intrinsic porosity of the mixture. The ability to control the water/air fraction of the mixture allowed the optimization and maximization of εr. We present the preliminary results obtained in MRI on a phantom with a HDC BaTiO3 pad having the maximal permittivity obtained, εr=470.Materials and Methods
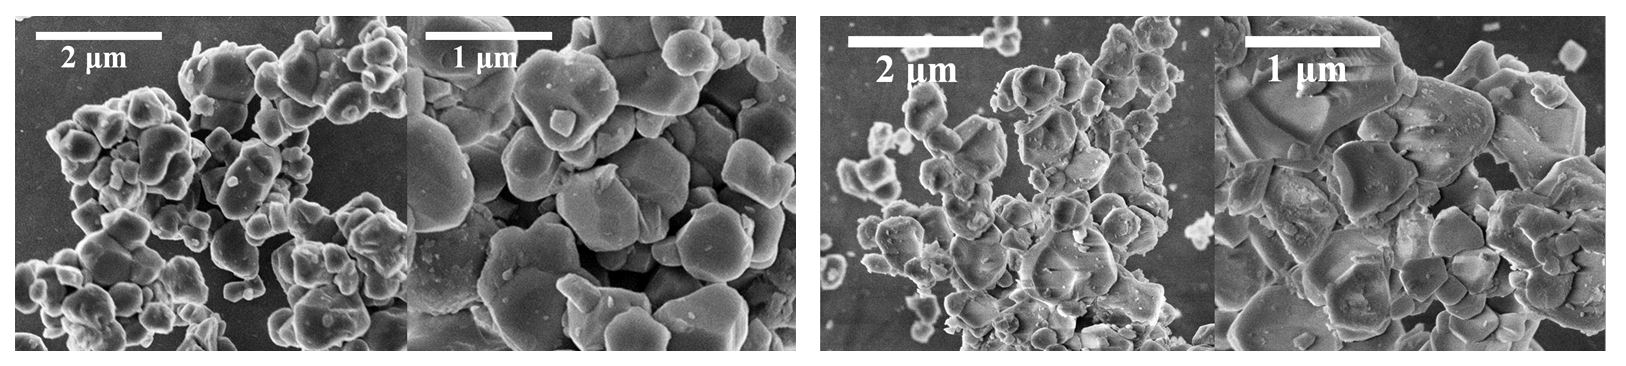
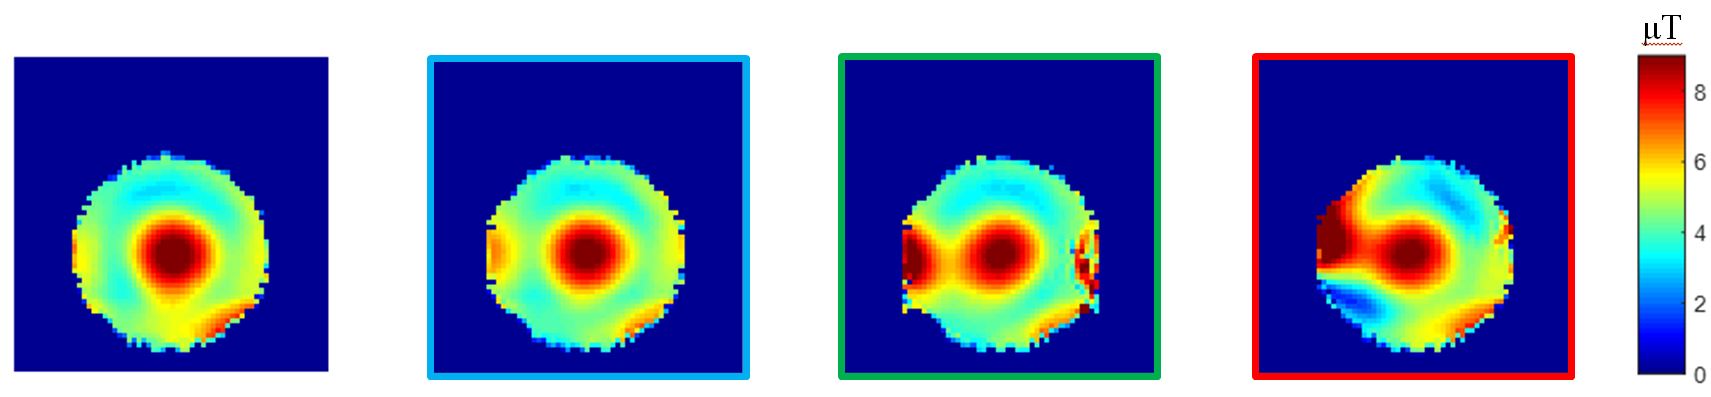
Aqueous solutions of commercially available BaTiO3 were dielectrically characterized with a coaxial measurement cell7, ranging from dry perovskite powder until a very dilute solution, in a microwave frequency range. Firstly, the samples were manually inserted into the confinement area of the cell; then, the same procedure was repeated by highly pressing (2 ton/cm2) with a hydraulic machine press. To microscopically evaluate the effects of compressing the mixtures, Scanning Electron Microscopy (SEM) images were obtained for a compressed and uncompressed case. Two 10cmx12cmx1cm pads of 65% v/v (the mixture having the highest permittivity achieved) were manufactured. The first was machine pressed into a 1cm-thick 3D printed Poly Lactic Acid (PLA, εr≈3) container, having εr=470. The second was left uncompressed, having εr=30. To evaluate their impact on the B1+ distribution, validation experiments were performed using a birdcage head coil 1Tx/1Rx (Invivo Corp., Gainesville, USA) and a home-made spherical 3% agarose phantom on a 7T Magnetom MRI (Siemens Healthineers, Erlangen, Germany). B1+ maps were acquired with an AFI sequence8. A 37 % v/v BaTiO3 pad commonly used in the literature (εr=200), was also imaged for comparison. A 1cm-thick PLA spacer was used between the phantom and the two flexible pads to mimic the pressed-pad PLA container.Results
Figure 1 displays the permittivity results at 300 MHz (Larmor frequency of 1H at 7T) as function of water content for BaTiO3 samples, uncompressed and machine pressed. The Litchteneckers Logarithmic Power Law (LLPL)9 was compared to the permittivity results of the most liquid samples (first increasing stage) and the Coherent Potential Approximation (CPA)10 was compared to the results of the samples having a powdery texture (second decreasing stage). Figure 2 displays SEM images of a 65% v/v BaTiO3-water mixture pressed and uncompressed. Figure 3 presents the B1+ map for the control (no pad), and for the three studied cases.Discussion and Conclusion
The permittivity of BaTiO3 aqueous solutions presents two stages as function of water content; a first stage, from pure water until approximately 50% v/v, where the solution is saturated and a maximal permittivity value can be achieved; and a second stage, where the solution has a powdery consistency and the permittivity is highly dependent not only on the water content but also on the air fraction. In this later stage, it was shown that by pressing, the intrinsic porosity is reduced, and therefore the maximal permittivity value obtained can be considerably higher than the values reported in dielectric shimming literature. Higher permittivity materials offer new possibilities to design thinner pads which are able to efficiently reshape B1+ field in UHF MRI. It was shown that the pressed mixtures can maintain a modest flexibility, non-expanding and non-deforming; thus, future work will be centered on molding the pad directly to the targeted body part on a flexible container and evaluating the effects of reducing pad thickness. This new configuration can be used as an advantage over gel-like pads which deform and cause significant spatial variations when placed under the patient2.Acknowledgements
This work was funded by the Association Institut Carnot Star “CMRI” and the Programme Transversal pour la Santé du CEA, funding the MATHSPIM project.References
1. Teeuwisse WM, Brink WM and Webb AG. Quantitative assessment of the effects of high-permittivity pads in 7Tesla MRI of the brain. Magn Reson Med. 2012; 67(5):1285–1293.
2. Teeuwisse WM, Brink WM, Haines KN, et al. Simulations of high permittivity materials for 7T neuroimaging and evaluation of a new Barium Titanate-base dielectric. Magn Reson Med. 2012; 67:912-918.
3. Brink WM and Webb AG. High permittivity pads reduce Specific Absorption Rate, improve B1 homogeneity and increase contrast-to-noise ratio for functional cardiac MRI at 3T. Magn Reson Med. 2014; 71:1632-1640.
4. De Heer P, Brink WM, Kooij BJ, et al. Increasing signal homogeneity and image quality in abdominal imaging at 3 T with very high permittivity materials. Magn Reson Med. 2012; 68:1317-1324.
5. Haines K, Smith NB and Webb AG. New high dielectric constant materials for tailoring the B1+ distribution at high magnetic fields. J Magn Reson. 2010; 203:323-327.
6. Webb AG. Dielectric Materials in magnetic resonance. Concepts Magn Reson A. 2011; 38A:148-184.
7. Ba D and Sabouroux P. EpsiMu®, a toolkit for permittivity and permeability measurement in microwave domain at real time of all materials: applications to solid and semisolid materials. Microw Opt Technol Lett. 2010; 52:2643-2648.
8. Yarnykh VL. Actual flip-angle imaging in the pulsed steady state: a method for rapid three-dimensional mapping of the transmitted radiofrequency field. Magn Reson Med. 2007; 57:192-200.
9. Simpkin R. Derivation of Lichtenecker's logarithmic mixture formula from Maxwell's equations. IEEE Trans Microw Theory Techn. 2010; 58:545-550.
10. Sen PN, Scala C and Cohen MH. A self-similar model for sedimentary rocks with application to the dielectric constant of fused glass beads. Geophysics. 1981; 45:781-795.
Figures