2670
An SNR Optimized Quadrature Reception Posterior Array for Prostate Imaging at 3 Tesla1Computer Assisted Clinical Medicine, Medical Faculty Mannheim, Heidelberg University, Mannheim, Germany
Synopsis
Increasing signal-to-noise-ratio (SNR) in prostate MRI could facilitate the diagnosis and characterization of prostate cancers. In this work, we built a quadrature posterior surface array that aims to increase local SNR at the prostate. The coil was compared to 3 and 9 channels of the standard spine array using phantom measurements. Respectively, SNR gains of 12 and 9% were obtained using a realistic region-of-interest (ROI). Further work will be undertaken to translate the SNR gains to in-vivo prostate imaging at 3T.
Purpose
MRI is an important tool in the diagnosis and characterization of prostate cancer1. However, prostate cancer remains largely underestimated and its diagnosis could benefit from tailored-hardware that provides high SNR prostate images. This could be, in principle, achieved using endorectal coils but they are invasive and generic surface arrays are often preferred. In this work, we present a surface 3-channel posterior array tailored to the application of prostate imaging. In our approach, quadrature detection is employed to increase SNR locally at the region-of-interest (ROI) as proposed in previous works using EM simulations2. Performance was evaluated and compared to a standard spine array using phantom measurements.Methods
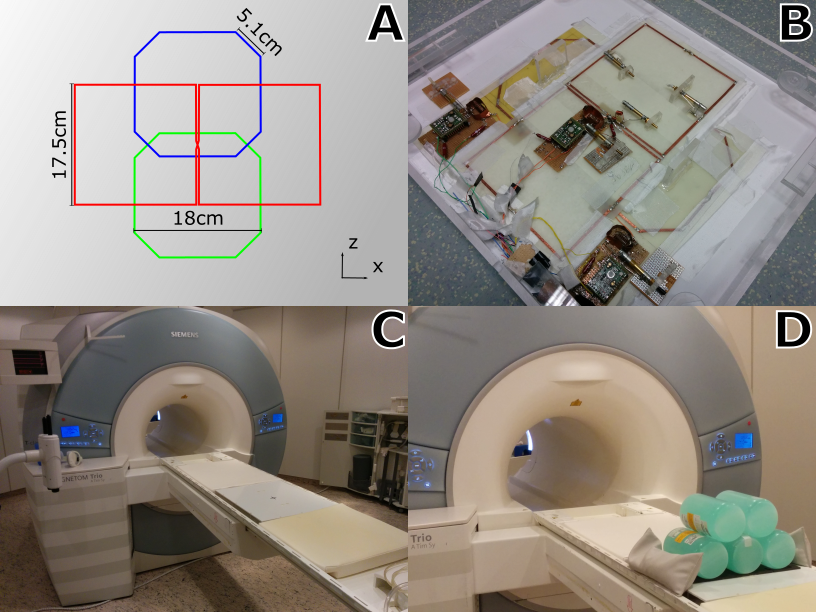
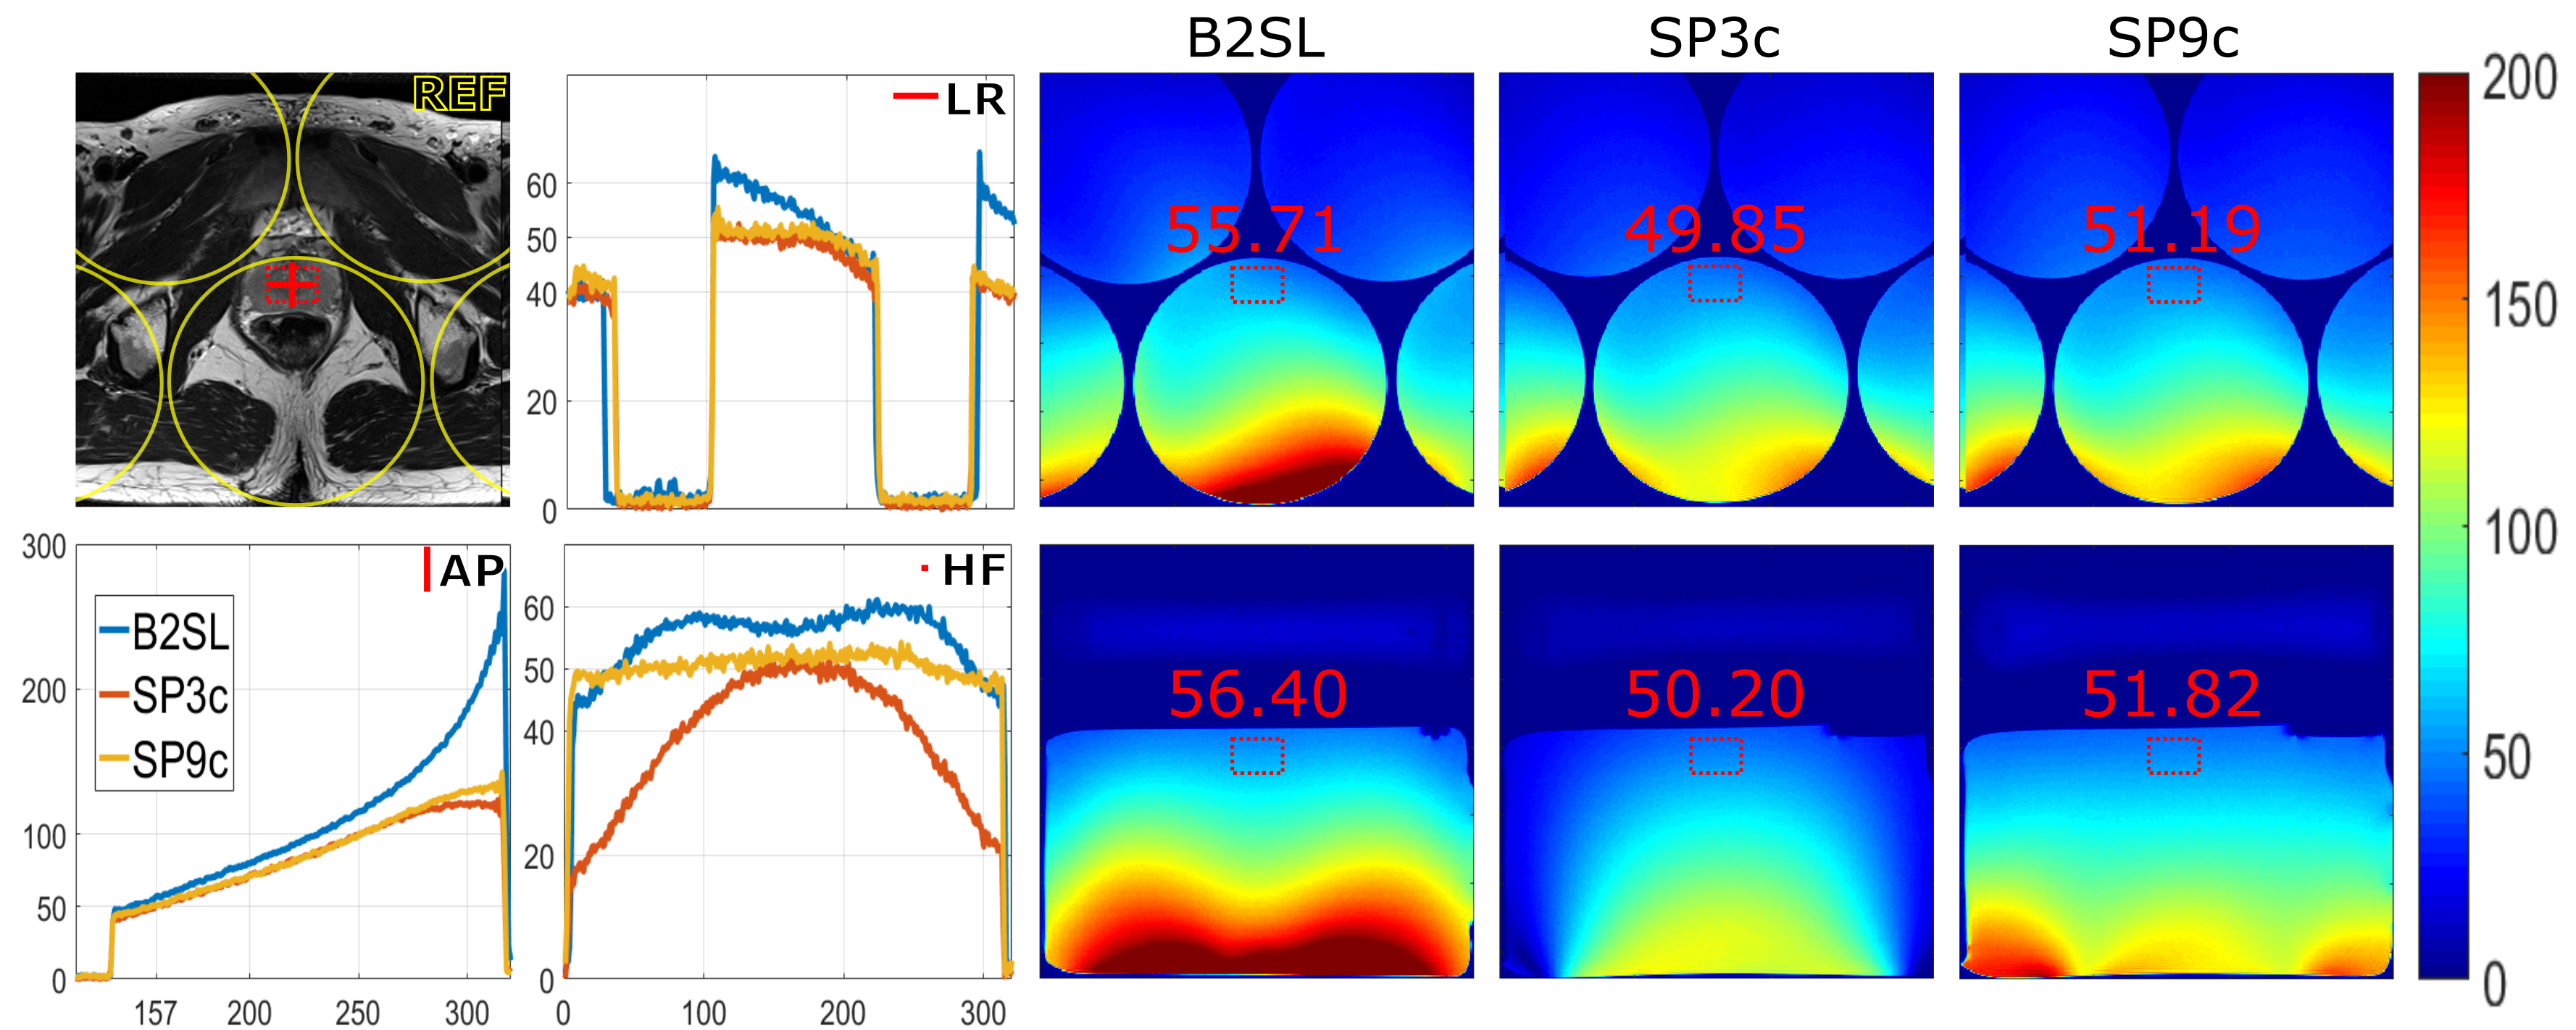
An RF coil array composed of two single loop coils and a butterfly (B2SL) was built using 3mm-wide copper tape. The single loops were octagonal (16cm across, 5.1cm corners). The butterfly was built with two squared lobes of 17.5cm in length. Decoupling between the loops was achieved using overlap and between the loops and the butterfly using magnetic flux compensation. The latter was done by concentric placement of the elements along the x-axis (Fig. 1A). Additionally, a 5mm distance in the y-axis between the loops and the butterfly was added to increase decoupling. All coils were actively decoupled. Additional passive decoupling was also employed in the butterfly due to its large size. Reception paths included cable traps and low-noise pre-amplifiers (Fig 1B). The housing of the array was built with the dimensions 45x50x5.5cm³ (LRxHFxAPcm³) to fit the patient table (Fig. 1C). The thickness of the housing cover was 0.5cm and a distance of 0.4cm was added between the phantom and the coil to simulate a cushion expected to be used for patient comfort. 5 cylindrical containers (radius=57.5mm, length=200mm) with a solution of 3.75g NiSO4x6H2O+5g NaCL per 1000g distilled water were used as phantom (Fig.1D). For comparison, 3 and 9 elements (SP3c and SP9c) of the system’s spine array were used. Measurements were performed in a 3T MAGNETOM Trio system (Siemens Healthcare, Erlangen, Germany). 2D sagittal and coronal scans were acquired using a gradient echo sequence with the parameters: TE/TR=10/100ms, flip angle=90°, field-of-view=200x200mm, matrix size=320x320, thickness=5mm and BW=260Hz/pixel. For the calculation of SNR maps and noise matrices, noise scans were acquired using the same parameters without transmission power. Complex SNR maps were calculated per-channel and combined by adaptive combination3. A reference scan of a healthy male volunteer (186cm, 83kg) was acquired for a realistic determination of the ROI. The scan was acquired using: Siemens spine (12 channels) + Siemens body (6 channels) arrays, sequence: 2D-TSE, parameters: TE/TR=101/3500ms, flip-angle=137°, Turbo-factor=27, field-of-view=200x2200mm, matrix size=320x320, thickness=3mm, Averages=2, GRAPPA4=2, ACS=32. For evaluation, SNR profiles of the three axes were plotted going through the phantoms at positions where the center of the prostate was located in the reference image. Quantitative comparisons were obtained using mean SNR values measured in a rectangular ROI (36x24px²) centered using the prostate in the reference scan.Results
Noise correlations were found to be 51/42% between the upper/lower loop and the butterfly. 28% was found between the single loops. Profiles plotted show increased SNR values in B2SL in comparison to the spine array using 3 and 9 channels. Using the proposed array, mean SNR gains of approximately 1.12 and 1.09-fold were obtained (SP3c and SP9c, respectively) in both planes (transversal and sagittal) at the ROI. Mean SNR values can be observed in Figure 2.Discussion
Prostate MRI is a very particular application where the imaging target is almost an order of magnitude smaller than the field-of-view used for abdominal imaging. Moreover, the central location of the prostate within the abdomen requires adequate local SNR to ensure diagnostic quality of the images. Out experiments showed that quadrature detection is well suited for these purposes. Moreover, SNR gains were found using the proposed array compared to the spine array. However, fuses are yet to be inserted in our design which could decrease the SNR gains and further optimization might be required. The further optimization and the assessment of parallel imaging performance in the scope of our future work. We envision complementing our design with an anterior quadrature array also tailored for the prostate to enhance SNR in-vivo. With these SNR gains we expect increase image quality that could contribute to the diagnostic value of MRI in prostate cancer.Conclusion
SNR gains in the prostatic region were obtained using a quadrature array using phantom measurements. This concept should be further explored to increase diagnostic values of prostate scans at 3T.Acknowledgements
No acknowledgement found.References
1. Shukla-Dave A and Hricak H. Role of MRI in prostate cancer detection. NMR in Biomedicine, 2014. 27.1, 16-24.
2. Chacon-Caldera J, Uranga Solchanga J, Koziol P, and Schad LR. Numerical Comparison of Stacked and Planar Coil Reception Arrays for Prostate MRI at 3 T. In Proceedings of the 24th Annual Meeting of ISMRM, Singapore, 2016. p. 2166.
3. Walsh D.O., Gmitro A.F. and Marcellin M.W. Adaptive reconstruction of phased array MR imagery. Magn. Reson. Med., 2000. 43, 682-690.
4. Griswold, M. A. et al. Generalized autocalibrating partially parallel acquisitions (GRAPPA). Magn. Reson. Med., 2000. 47, 1202-1210.
Figures