2648
On the SAR load of typical head protocols at 7T1Erwin L. Hahn Institute for MRI, University Duisburg-Essen, Essen, Germany, 2Clinic of Pediatrics I, Neonatology, University Hospital Essen, Essen, Germany, 3Medical Physics Group, Institute of Diagnostic and Interventional Radiology, Friedrich Schiller University Jena, Jena, Germany, 4Medical Physics in Radiology, German Cancer Research Center (DKFZ), Heidelberg, Germany, 5High Field and Hybrid MR Imaging, University Hospital Essen, Essen, Germany
Synopsis
In this retrospective study, log files of the RF safety watchdog system were evaluated from 30 head exams performed at 7T in conjunction with the widely available 32-channel Nova Medical head coil. Head local SAR as reported by the PALI and the start/end times of each sequence were compared for eight different sequence types. This study aimed at providing insights into the expected RF exposure in UHF neurological protocols and may become useful in simulations to study realistic exposure scenarios, as well as to determine which sequences may be acceptable if a SAR reduction is required for a 7T exam.
Target Audience:
Radiologists and physicists interested in MR safety and ultra-high field imaging.Purpose:
For safety assessments of radiofrequency (RF) transmit coils or in combination with implanted medical devices (IMD), temperature measurements and thermal simulations are typically performed at maximum specific absorption rate (SAR) levels. While from a conservative point of view this approach is reasonable, it rarely reflects actual imaging procedures in terms of different SAR loads per sequence and run times. In 2015, Langman et al. [1] reported that in neurological exams at 1.5T high SAR sequences (> 2 W/kg) run for approximately 6-12 minutes of a 32-minute exam, with a median head SAR of 1.3 W/kg. Furthermore, the authors reported a median inter-sequence downtime of 23 seconds. At ultra-high fields (UHF) of 7 Tesla and higher, SAR is a limiting factor and large effort is put into in reducing the SAR load of clinically important sequences such as turbo-spin echo (TSE) or time-of-flight (TOF). On the other hand, low flip angle gradient echo sequences, for example susceptibility weighted imaging (SWI), have demonstrated diagnostic value at 7T and have become key components of head protocols, despite typically long acquisition times. Furthermore, workflow at 7T still demands manual adjustments and more interaction from the operator, which prolong inter-sequence downtimes. In this regard, this study aimed at providing insights into the expected RF-exposure in UHF head protocols.Methods:
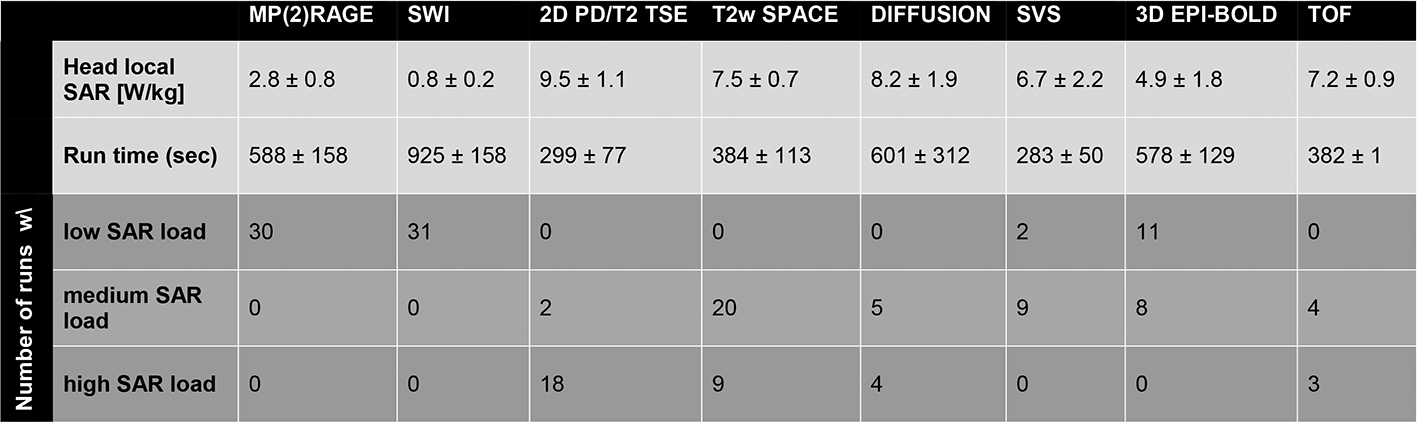
In this retrospective study, log-files of the MR system’s (Magnetom 7T, Siemens Healthcare GmbH, Germany; software version VB17) RF safety watchdog (RFSWD) were evaluated from 30 head exams. All measurements were performed with a widely available 1-channel transmit/32-channel receive head coil (Nova Medical Inc., Wilmington, MA). For each subject, at least one T1-weighted structural scan was included (MP(2)RAGE) while the rest of the protocol varied according to the scope of the individual research study (e.g. vascular diseases, cerebellar development, spectroscopy, fMRI). Table 1 gives an overview of the applied sequences. The log-files were parsed to extract head local SAR (most critical aspect) as reported by the power absorption limiter (PALI) for the 360 s checking interval, as well as the start/end times of each sequence. The PALI values also reflect different coil loading and transmitter adjustments. The sequences were grouped according to their SAR load: low SAR was defined as head local SAR of up to 4 W/kg, medium SAR reflects values greater than 4 W/kg and less than 8 W/kg, and high SAR was defined as head local SAR of 8 W/kg and higher.Results:
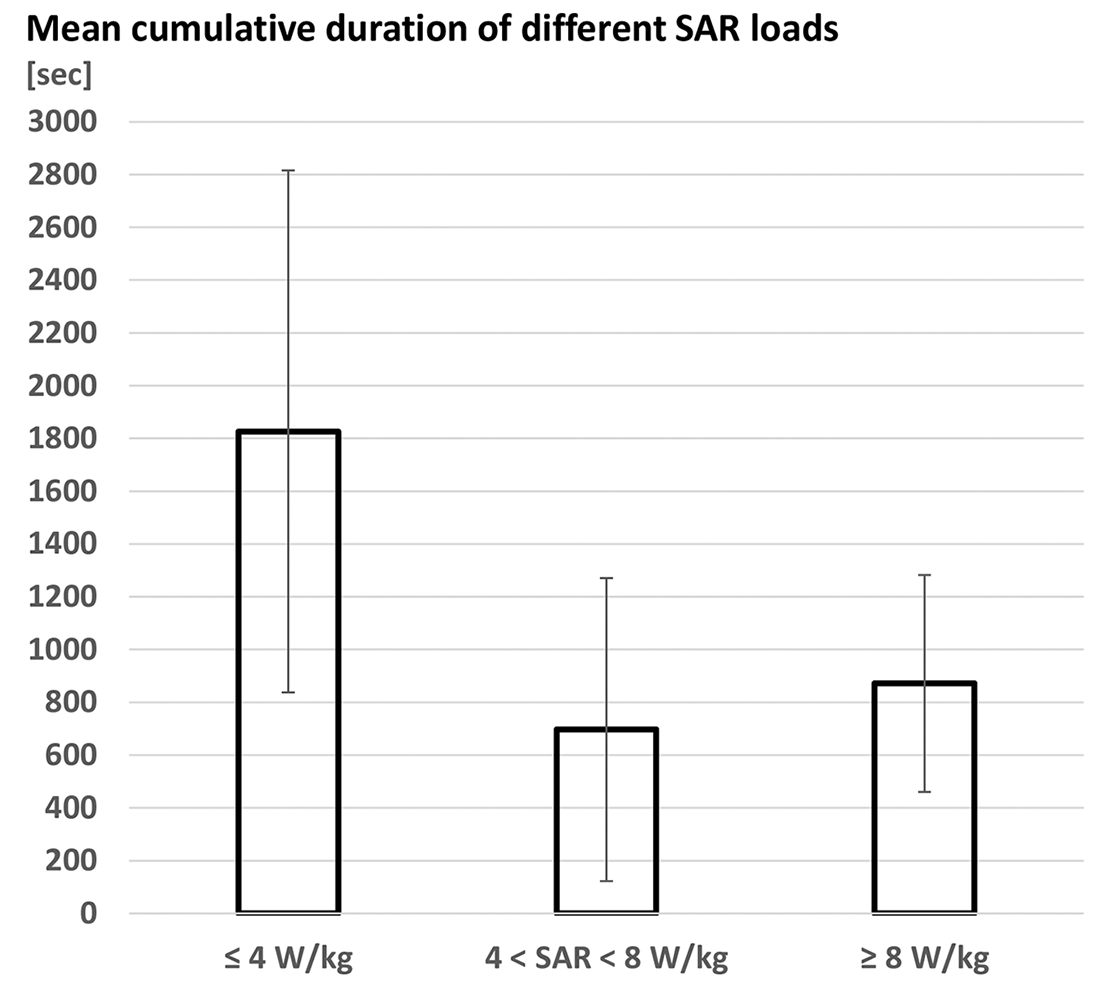
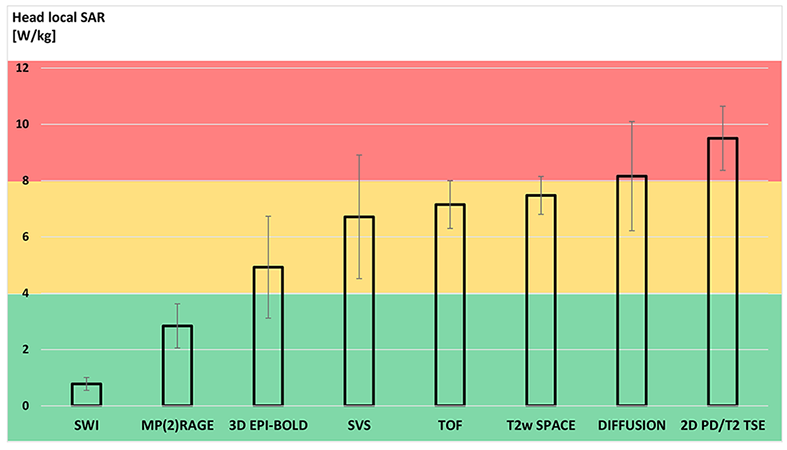
All sequence runs remained within limits set for the normal operating mode, i.e. 10 W/kg local SAR [2]. The mean number of actual (structural, functional, or spectroscopic) sequences per subject was 5.4. On average, 2.5 scans per subject had a low SAR profile, 1.7 had a medium SAR profile, and 1.2 scans were high SAR level (none for spectroscopic and fMRI studies). In 17/30 (57%) datasets at least one high SAR sequence was included. Figure 1 shows the mean cumulative duration for the three levels of SAR load. In detail, Figure 2 provides an overview of the SAR load per type of sequence. The two major constituents of a UHF neurological protocol, SWI and MP(2)RAGE, never exceeded 4 W/kg and had the longest duration. On the other hand, the 2D TSE yielded highest head local SAR values at minimum run times. The mean total acquisition time was 1 h 2 min 9 sec ± 11 min 38 sec, whereof on average 4 min 52 sec ± 1 min 35 sec could be attributed to preparations (adjustments, localizer scans, B1 mapping for transmitter adjustments) prior to the very first structural scan. The mean inter-sequence downtime was 30 seconds, while for MR spectroscopy this was increased to 11 min 51 sec due to repeated B0 shimming.Discussion:
This analysis of the head exams at 7T showed that more than half of the subjects were exposed to at least one high SAR sequence. However, the mean cumulative time of the high SAR load per subject was only a quarter of the total exposure duration. For more than half of the imaging duration low SAR sequences were typically applied. The results obtained at 7T were similar to the results reported by Langman et al. for 1.5T [1]. The presented analysis may become useful in simulations to study realistic exposure scenarios, as well as to determine which sequences may be acceptable for a subject with implants that requires a SAR reduction for a safe 7T exam.Acknowledgements
No acknowledgement found.References
[1] Langman DA, et al., What is the SAR for Routine Clinical MRI Exams at 1.5T?, Proc. 23rd ISMRM (2015), abstract 302.
[2] IEC. 60601-2-22 Medical electrical equipment – Part 2-33. Edition 3.2, 2015.
[3] Wrede KH, et al., Caudal image contrast inversion in MPRAGE at 7 Tesla: problem and solution. Acad Radiol. 2012;19(2):172-8.
[4] Dammann P, et al., The venous angioarchitecture of sporadic cerebral cavernous malformations: a susceptibility weighted imaging study at 7 T MRI. J Neurol Neurosurg Psychiatry. 2013;84(2):194-200.
[5] Poser BA, et al., Three dimensional echo-planar imaging at 7 Tesla. Neuroimage. 2010;51(1):261-6.
[6] Johst S, et al., Time-of-flight magnetic resonance angiography at 7 T using venous saturation pulses with reduced flip angles. Invest Radiol. 2012;47(8):445-50.
Figures