2645
Comparison of High pass and Low pass Radio-Frequency coils in 1.5 T MRI safety assessments of Active Implantable Medical Devices1St. Jude Medical, Sylmar, CA, United States
Synopsis
Active Implantable Medical Device (AIMD) safety assessments in MRI per ISO/TS 10974 may include computer simulations to evaluate radio-frequency (RF) induced heating of tissue and RF induced voltage at the device. It is not known if the differences in assessments between High-Pass (HP) and Low-Pass (LP) RF coils can be ignored. In this work, electric-fields and AIMD related RF induced heating and voltage results from HP and LP coils were compared. It was determined that there is a significant difference in safety assessment results between HP and LP coils (maximum symmetric mean absolute percentage error 50.21 ± 0.68%).
PURPOSE
This work aims to determine if High-Pass (HP) and Low-Pass (LP) RF coils can be considered equivalent when performing computer simulation assessments to determine the safety of Active Implantable Medical Device (AIMDs) in a Magnetic Resonance Imaging (MRI) Radio-Frequency (RF) environment. This will be explored by comparing E-field values and RF-induced heating and voltage results from pacemaker and ICD device models in HP and LP coils separately.METHODS & RESULTS
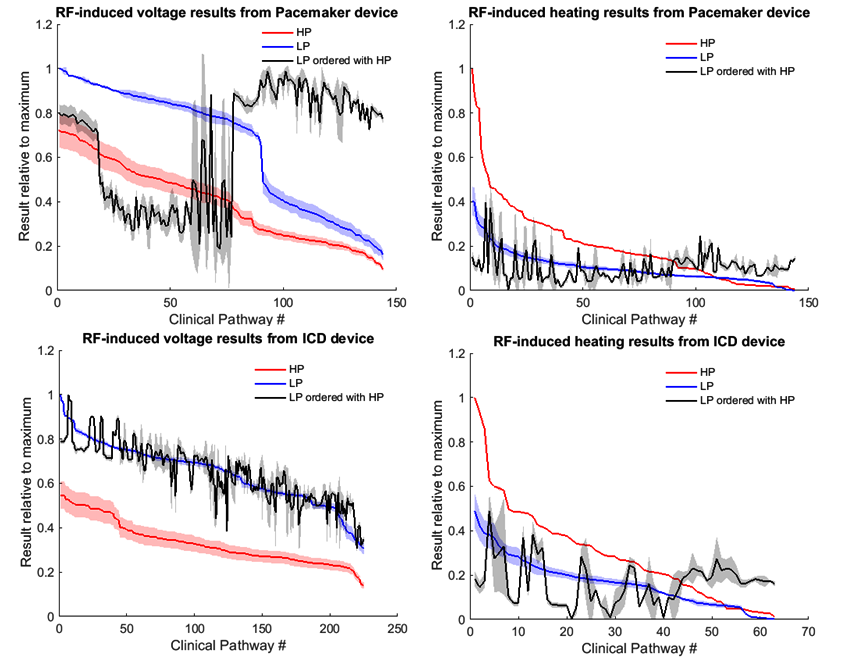
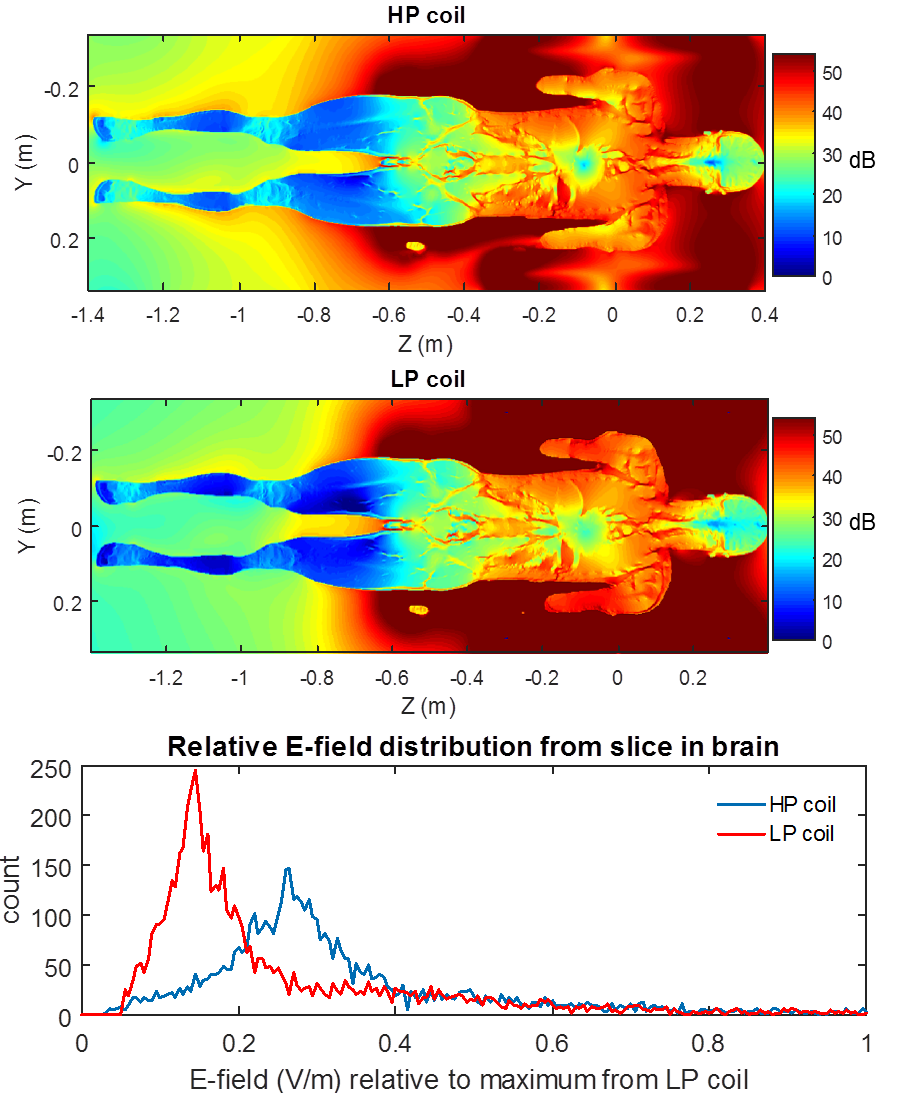
The electric field distributions due to 1.5 T MRI RF fields from HP and LP birdcage coils (with shield) in the adult male virtual human body model were calculated using SEMCAD X software that employs Finite-Difference Time-Domain (FDTD) methods [1]. The HP body coil employed an ideal source inserted in the end rings between equally spaced rungs (n= 16). The amplitude of each source was set to 1 V on one ring and -1 V for sources on the opposite ring. The phase delay of the nth source was set to n/16. The LP coils employed an ideal source inserted in each rung half way along its length. The amplitude of each source was set to 1 V and the phase delay of the nth source was set to n/16. This approach enables modeling an ideal circularly polarized RF body coil [2]. Compared to models using lumped elements with resistors and capacitors, this model does not require tuning and greatly reduces the simulation time as well. The simulation boundaries were enclosed by the Uniaxial Perfectly Matched Layer Absorbing Boundary Condition (UPMLABC) so that impinging waves would not reflect back into the computational domain. The whole body specific absorption rate (SAR) and the head SAR were calculated at an input power of 1 W and corresponding normalization factors were determined to achieve a whole body SAR of 4 W/kg or 2 W/kg and head SAR of 3.2 W/kg. The normalization factors were used to scale E-fields to normal operating mode. Other variables in the simulation analysis included circularly polarized field rotations, body positions inside RF coils (landmark positions, N=3), tissue properties, and RF coil size. AIMD heating and voltage models for two devices (Pacemaker and Implantable cardioverter defibrillator (ICD)) were determined using the approach described in [3,4].The tangential E-fields along cardiac clinical pathways were scaled to normal operating mode and used as inputs into the AIMD models. The temperature rises and induced voltages from each pathway were determined and the values relative to the maximum for the HP and LP coils were compared. The relative RF induced heating and voltage results from the pacemaker and ICD device model as a function of clinical pathway for HP and LP coils is shown in Figure 1. The figure show results in descending order of ordinate value for both HP and LP coils (red and blue lines). Additionally, LP results are also plotted (black line) such that they are arranged with results from HP (same clinical pathways) for comparison. The differences in results were quantified by computing the symmetric mean absolute percentage error (SMAPE) which is defined as $$$SMAPE = \frac{100\%}{N}\sum^{N}_{k=1}\frac{|x_k-y_k|}{x_k+y_k}$$$, where x and y are the two sets of observations with N values. The average SMAPE between HP and LP coils was 50.21 ± 0.68% and 35.34 ± 3.80% for heating and voltage results respectively from three landmark positions. The differences in E-field maps is visualized in figure 2 showing a coronal slice of the HP and LP coils with adult male body model. The E-field distribution (relative to the maximum E-field in the LP coil) in the brain region of these slices is also shown in a plot (at bottom) in figure 2. The relative E-field value (RMS) in the HP and LP coils in the brain region for the slice shown were 0.33 ± 0.17 V/m and 0.24 ± 0.17 V/m respectively. These values are relative to the maximum E-field (RMS) in the brain region of the LP coil for the slice shown.CONCLUSION
HP and LP coils cannot be treated as equivalent during computer simulations for RF safety assessment of AIMDs in an MRI environment due to significant differences in E-field values and RF-induced heating and voltage results from pacemaker and ICD device models.Acknowledgements
No acknowledgement found.References
[1] SEMCAD X Reference Manual, SEMCAD Simulation Platform for Electromagnetic Compatibility.
[2] J. Nyenhuis, Using MRI Simulations and Measurements to evaluate RF heating of Active Implants, chapter 21 in MRI Bioeffects, Safety, and Patient Management, edited by F. Shellock and J. Crues, 2014.
[3] Hayes C. Radio frequency field coil for NMR. U.S. Patent #4,694,255, Sept. IS, 1987.
[4] J. Nyenhuis, J. Jallal, X. Min, S. Sison and G. Mouchawar, Comparison of measurement and calculation of the electric field transfer function for an active implant lead in different media, 2015 Computing in Cardiology Conference (CinC), Nice, 2015, pp. 765-768.
Figures