2642
Clinically Relevant Gradient and RF Field Exposure Levels for General Neuro MRI Protocols at 3.0 T1Department of Physics and Astronomy, Western University, London, ON, Canada
Synopsis
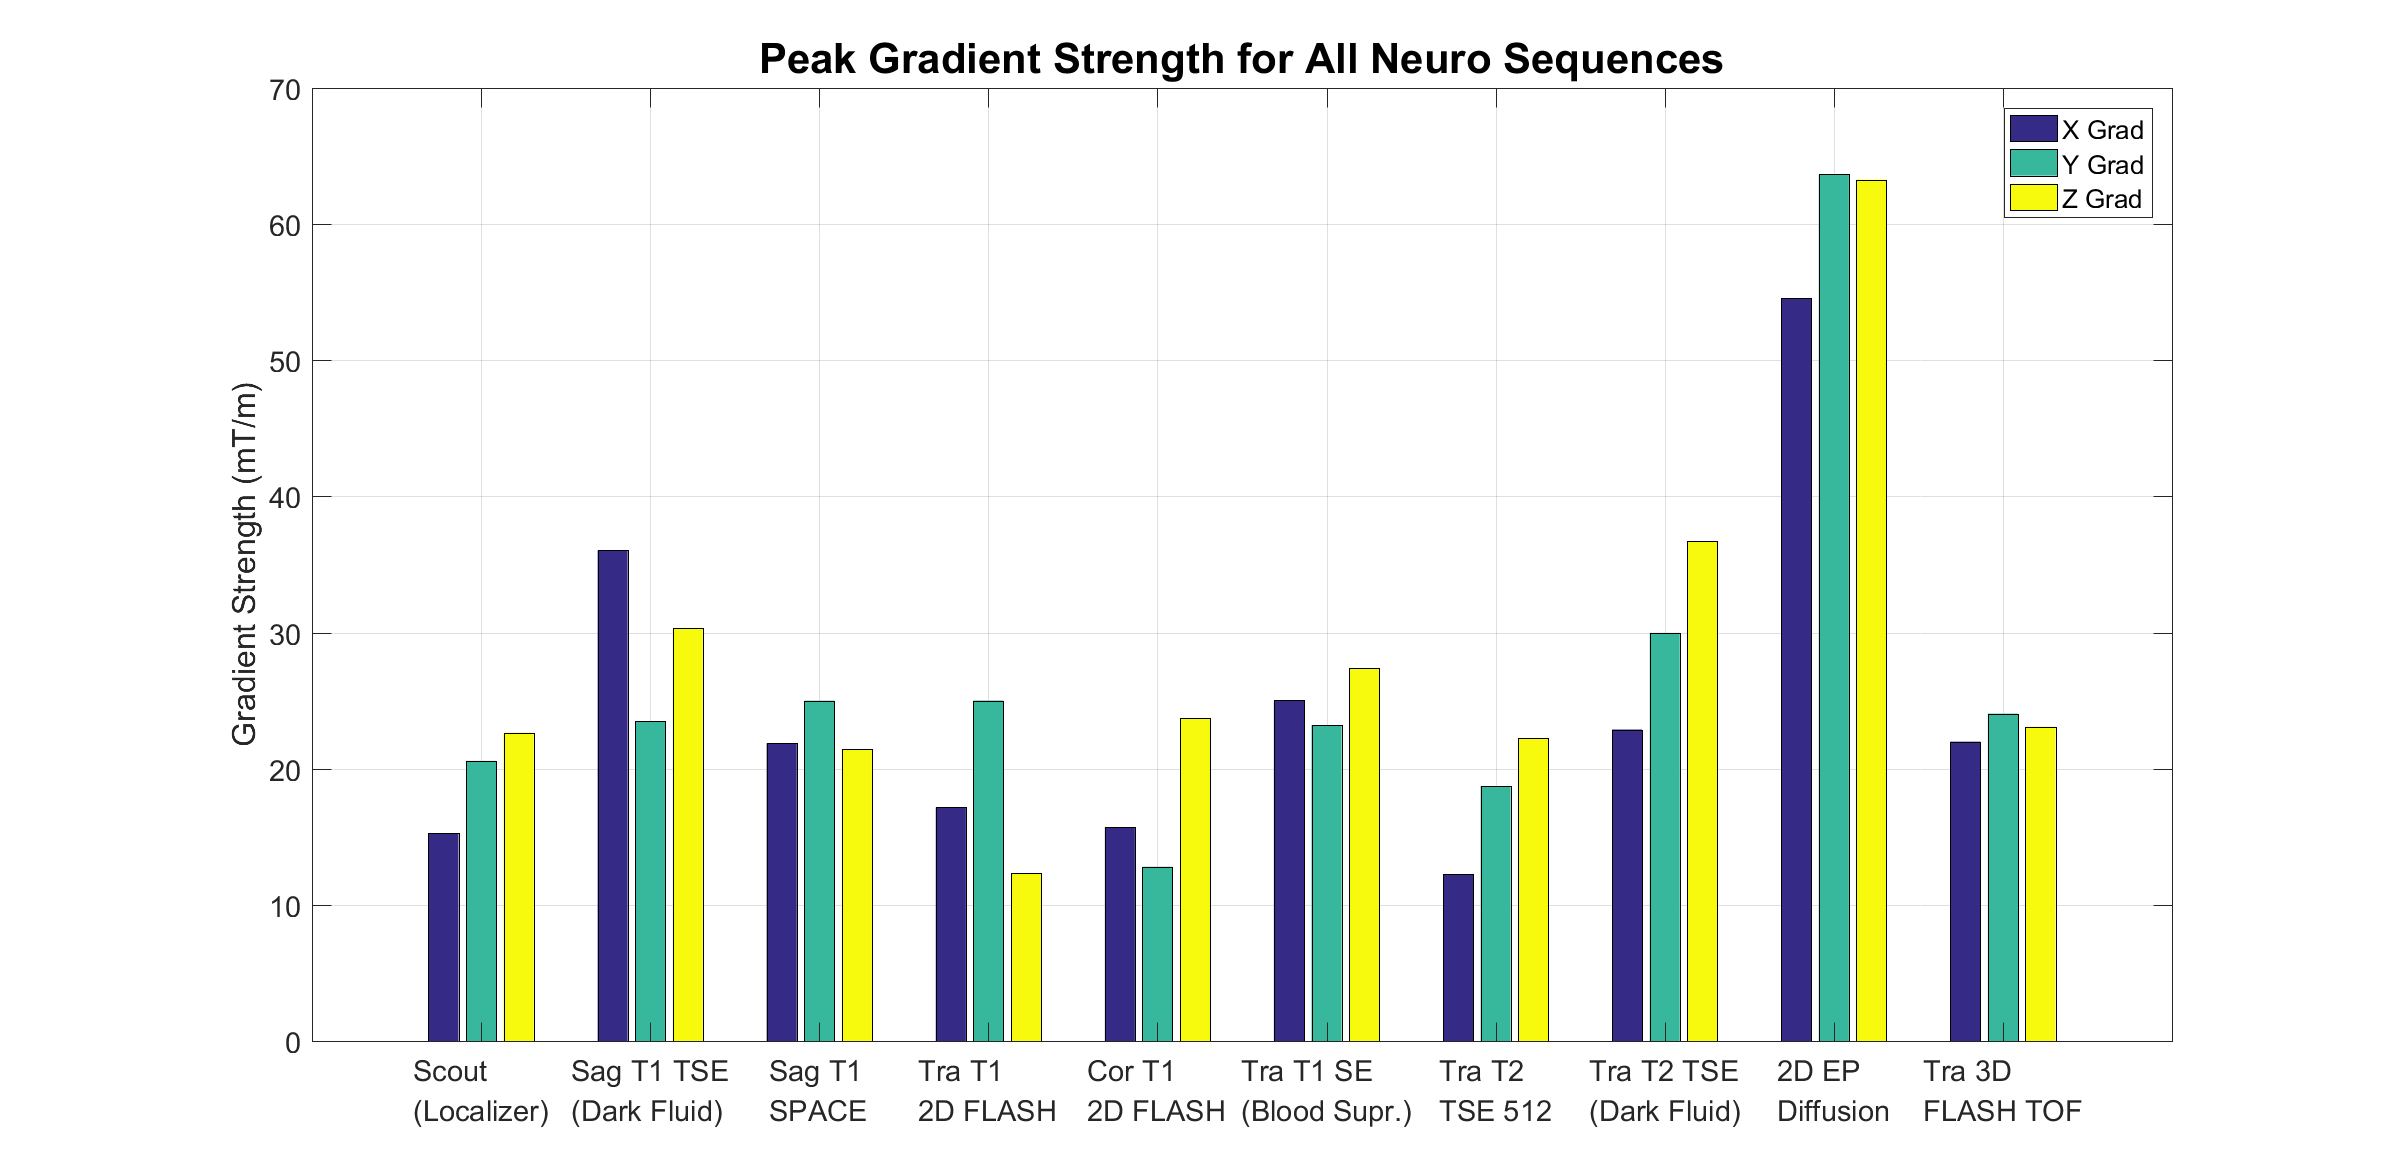
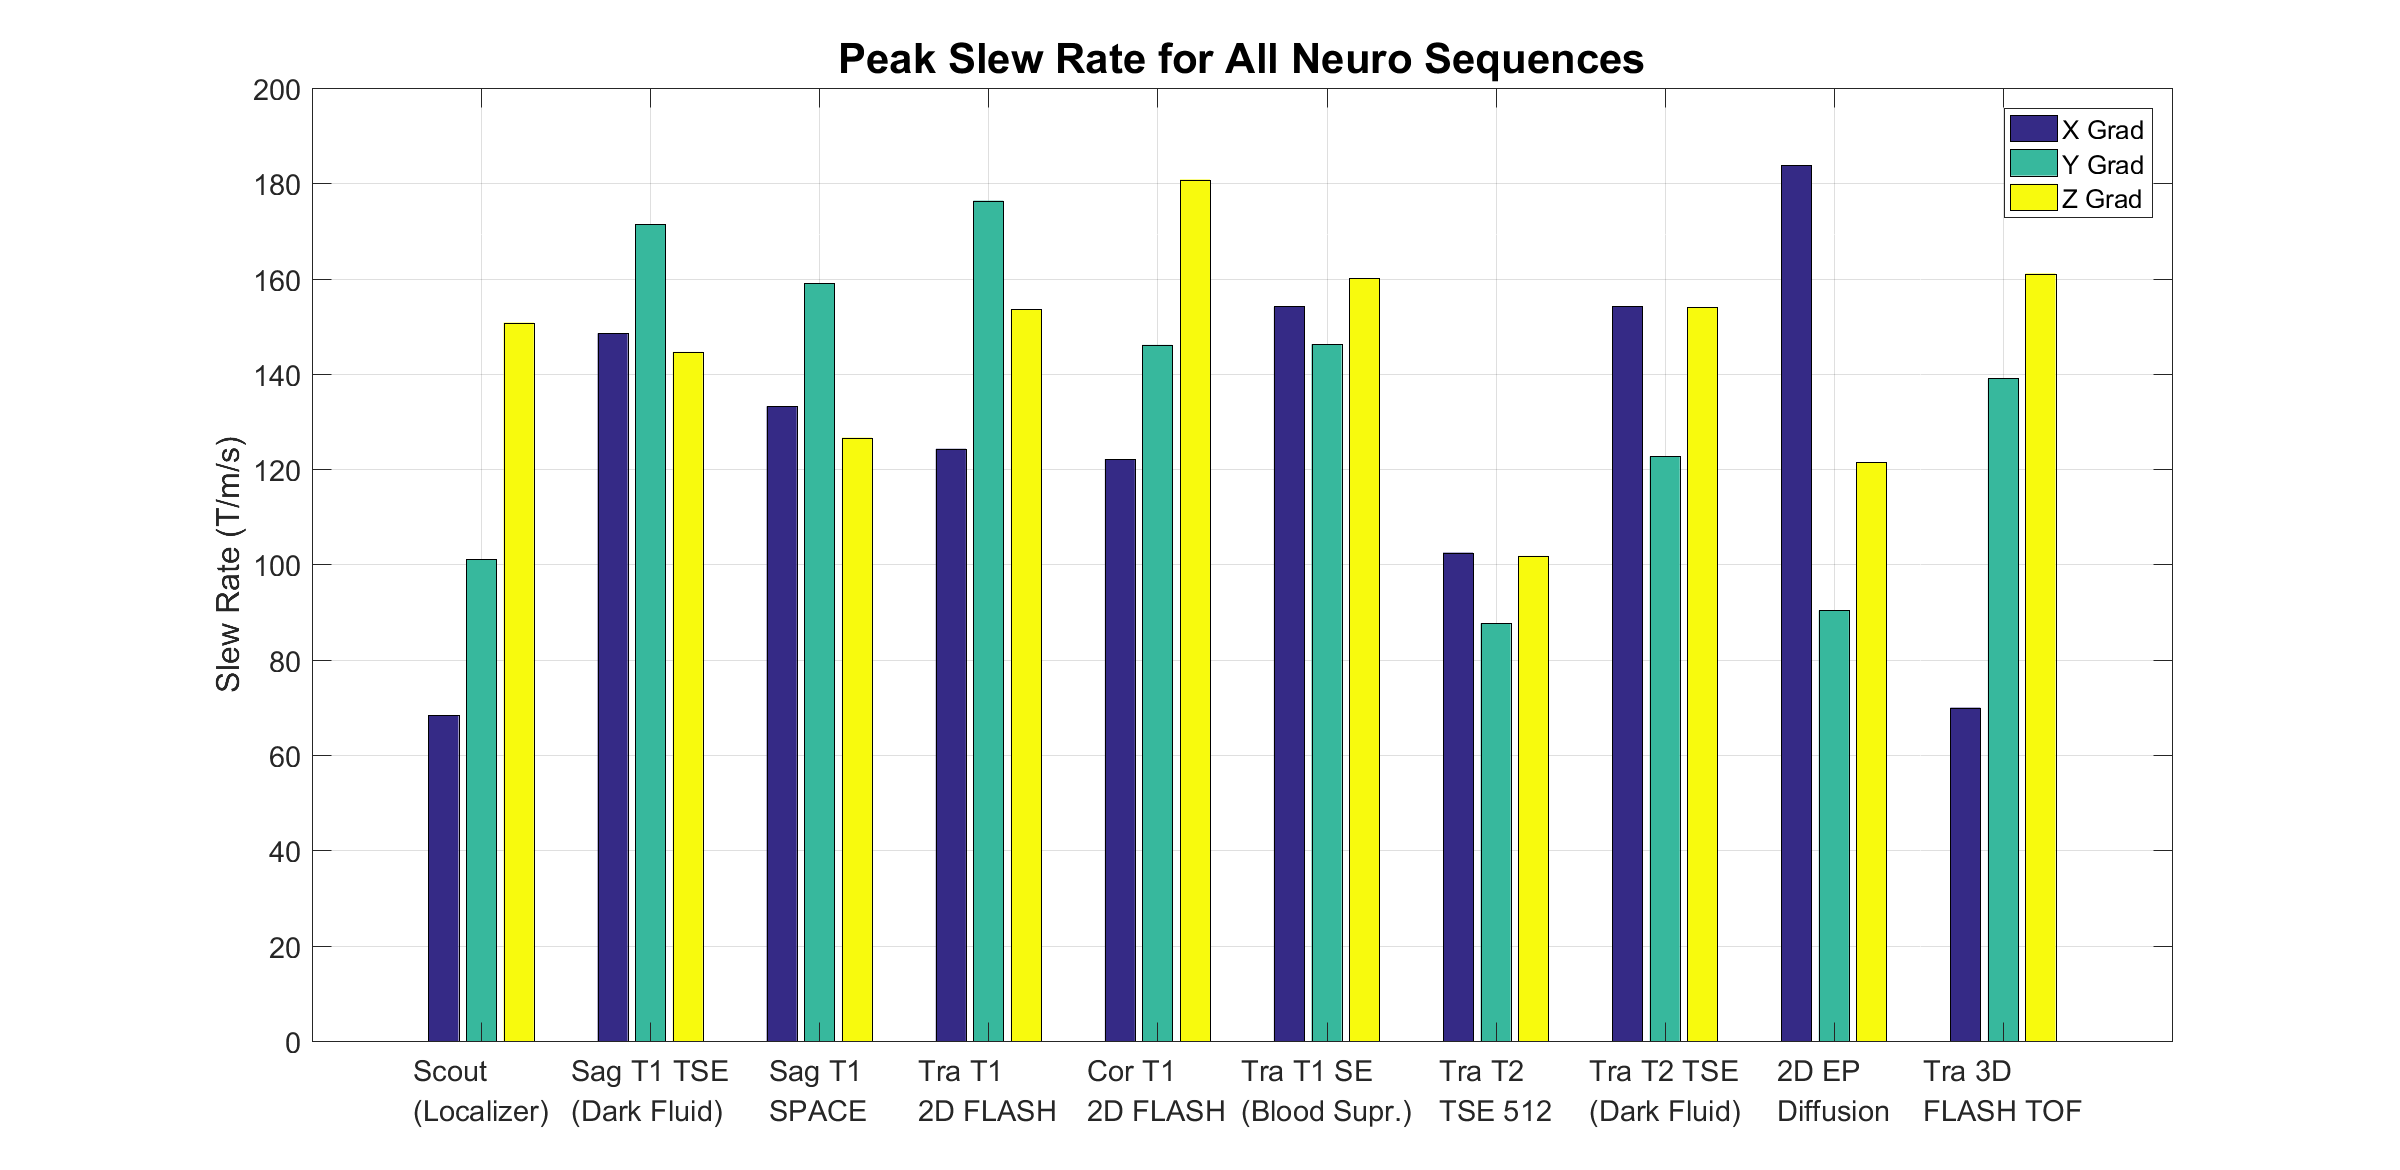
Maximum fields for MRI systems pose overly restrictive guidelines for MR compatible device development. Logging of gradient strengths on a Siemens Prisma 3T MRI showed that during clinically relevant neuro scans, peak gradient strength reached 63.97 ± 0.05 mT/m, lower than the system maximum of 80 mT/m. In addition, peak slew rate during this protocol was measured to be 183.9 ± 0.2 T/m/s, compared to the system maximum of 200 T/m/s. This allows more flexibility for MR compatible device manufacturers due to the large discrepancy between the system maximum, and the practical maximums that the system reaches.
Introduction
MRI Devices require safety precautions to minimize potential risks when used within the MR environment. These additional risks are due to electromagnetic interactions with any or all of the MR sub systems (main field, gradients, RF)1, which can cause heating, vibration, force, torque, and malfunction2. To develop devices that are MR conditional, device manufacturers are provided with system maximums3 for exposure to EM fields and few additional details. These system maximums may put unnecessary restrictions on MR conditional device development. There is little to no information on which sequences may reach these maximums and how long each sequence remains at these levels. In this study, B1, Specific Absorption Rate (SAR), and gradient field exposure data were collected over a range of clinical neuro sequences on a 3.0 Tesla MR System (Siemens Prisma). With more information about clinically relevant MRI sequences, device manufacturers will have more specific and less restrictive guidelines for development.Methods
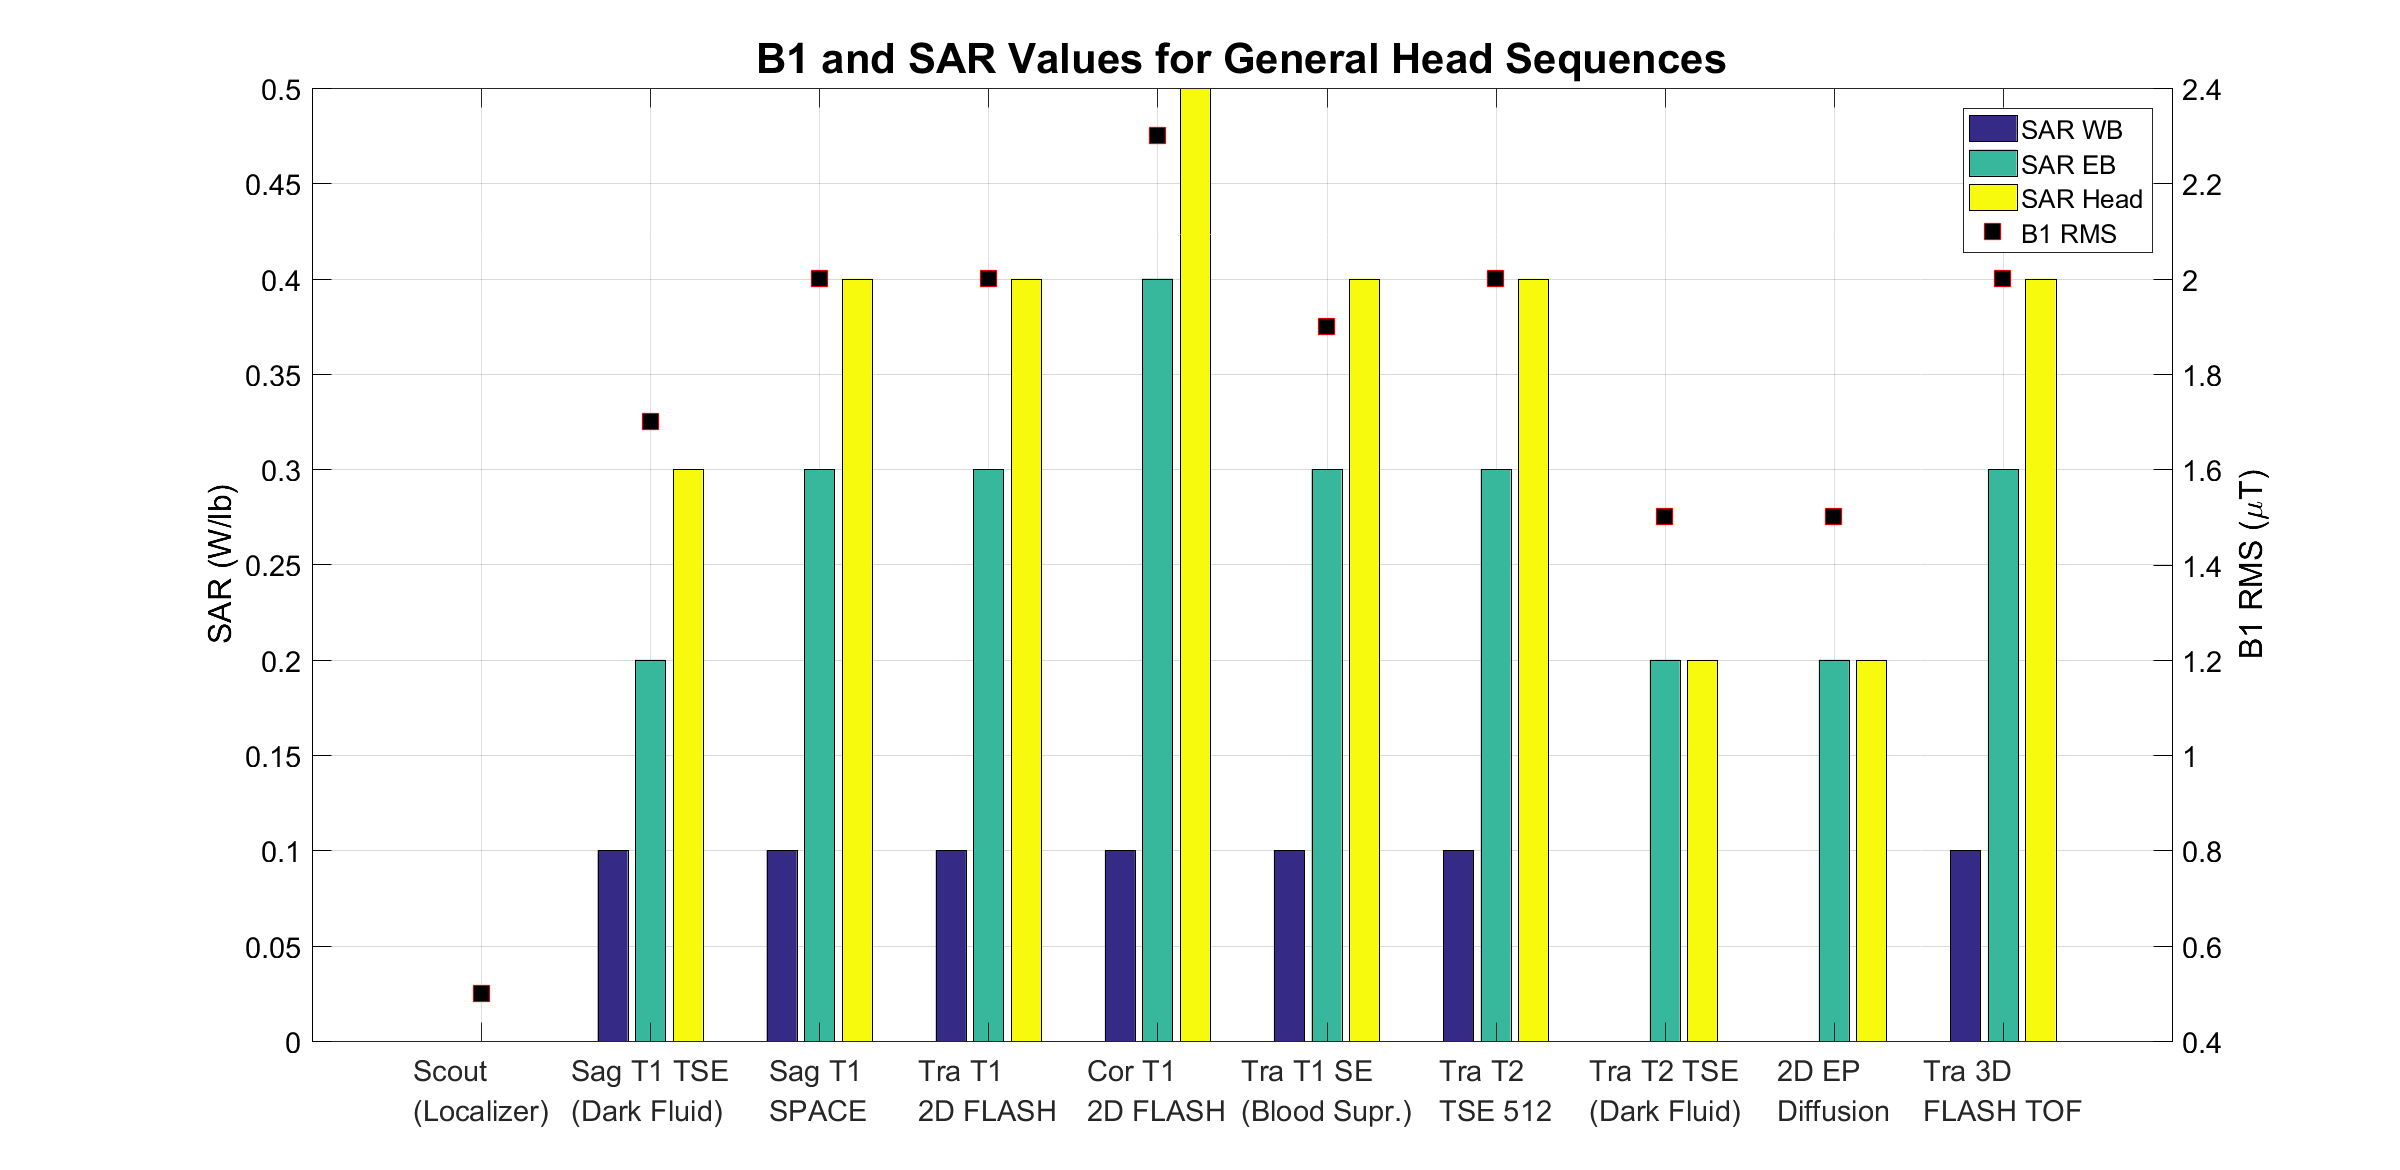
Seven phantoms were placed in the MRI for accurate SAR calculations. Ten exam sequences under the “General – Head” protocol were used. Siemens’ AutoAlign option was used automate selection of the imaging region by aligning to the “Head – Brain”. SAR and B1 were noted through the system monitor using the “current” SAR for Whole Body (WB), Exposed Body (EB), and Head. Gradient strength was collected during the sequence using a National Instruments Data Acquisition (DAQ) Tablet (NI USB-6356, National Instruments) connected to the current monitor outputs for the X, Y and Z gradient coils. The DAQ was set to acquire all three currents at a frequency of 250 kHz each. The data was converted to mT/m in Matlab using a conversion factor calculated with a sequence where the gradient amplitude was set to a specific value. Each sequence was then individually analyzed to determine the peak and RMS of both the gradient strength and the slew rate of the gradients. The sequences were run in both first level and normal mode, to determine if there were any automatic changes to the sequences that need to be accounted for. Combined RMS for slew rate was calculated through adding each axis’ slew rate in quadrature and then calculating the overall RMS. Error was estimated through analyzing the amplitude of the noise.Results
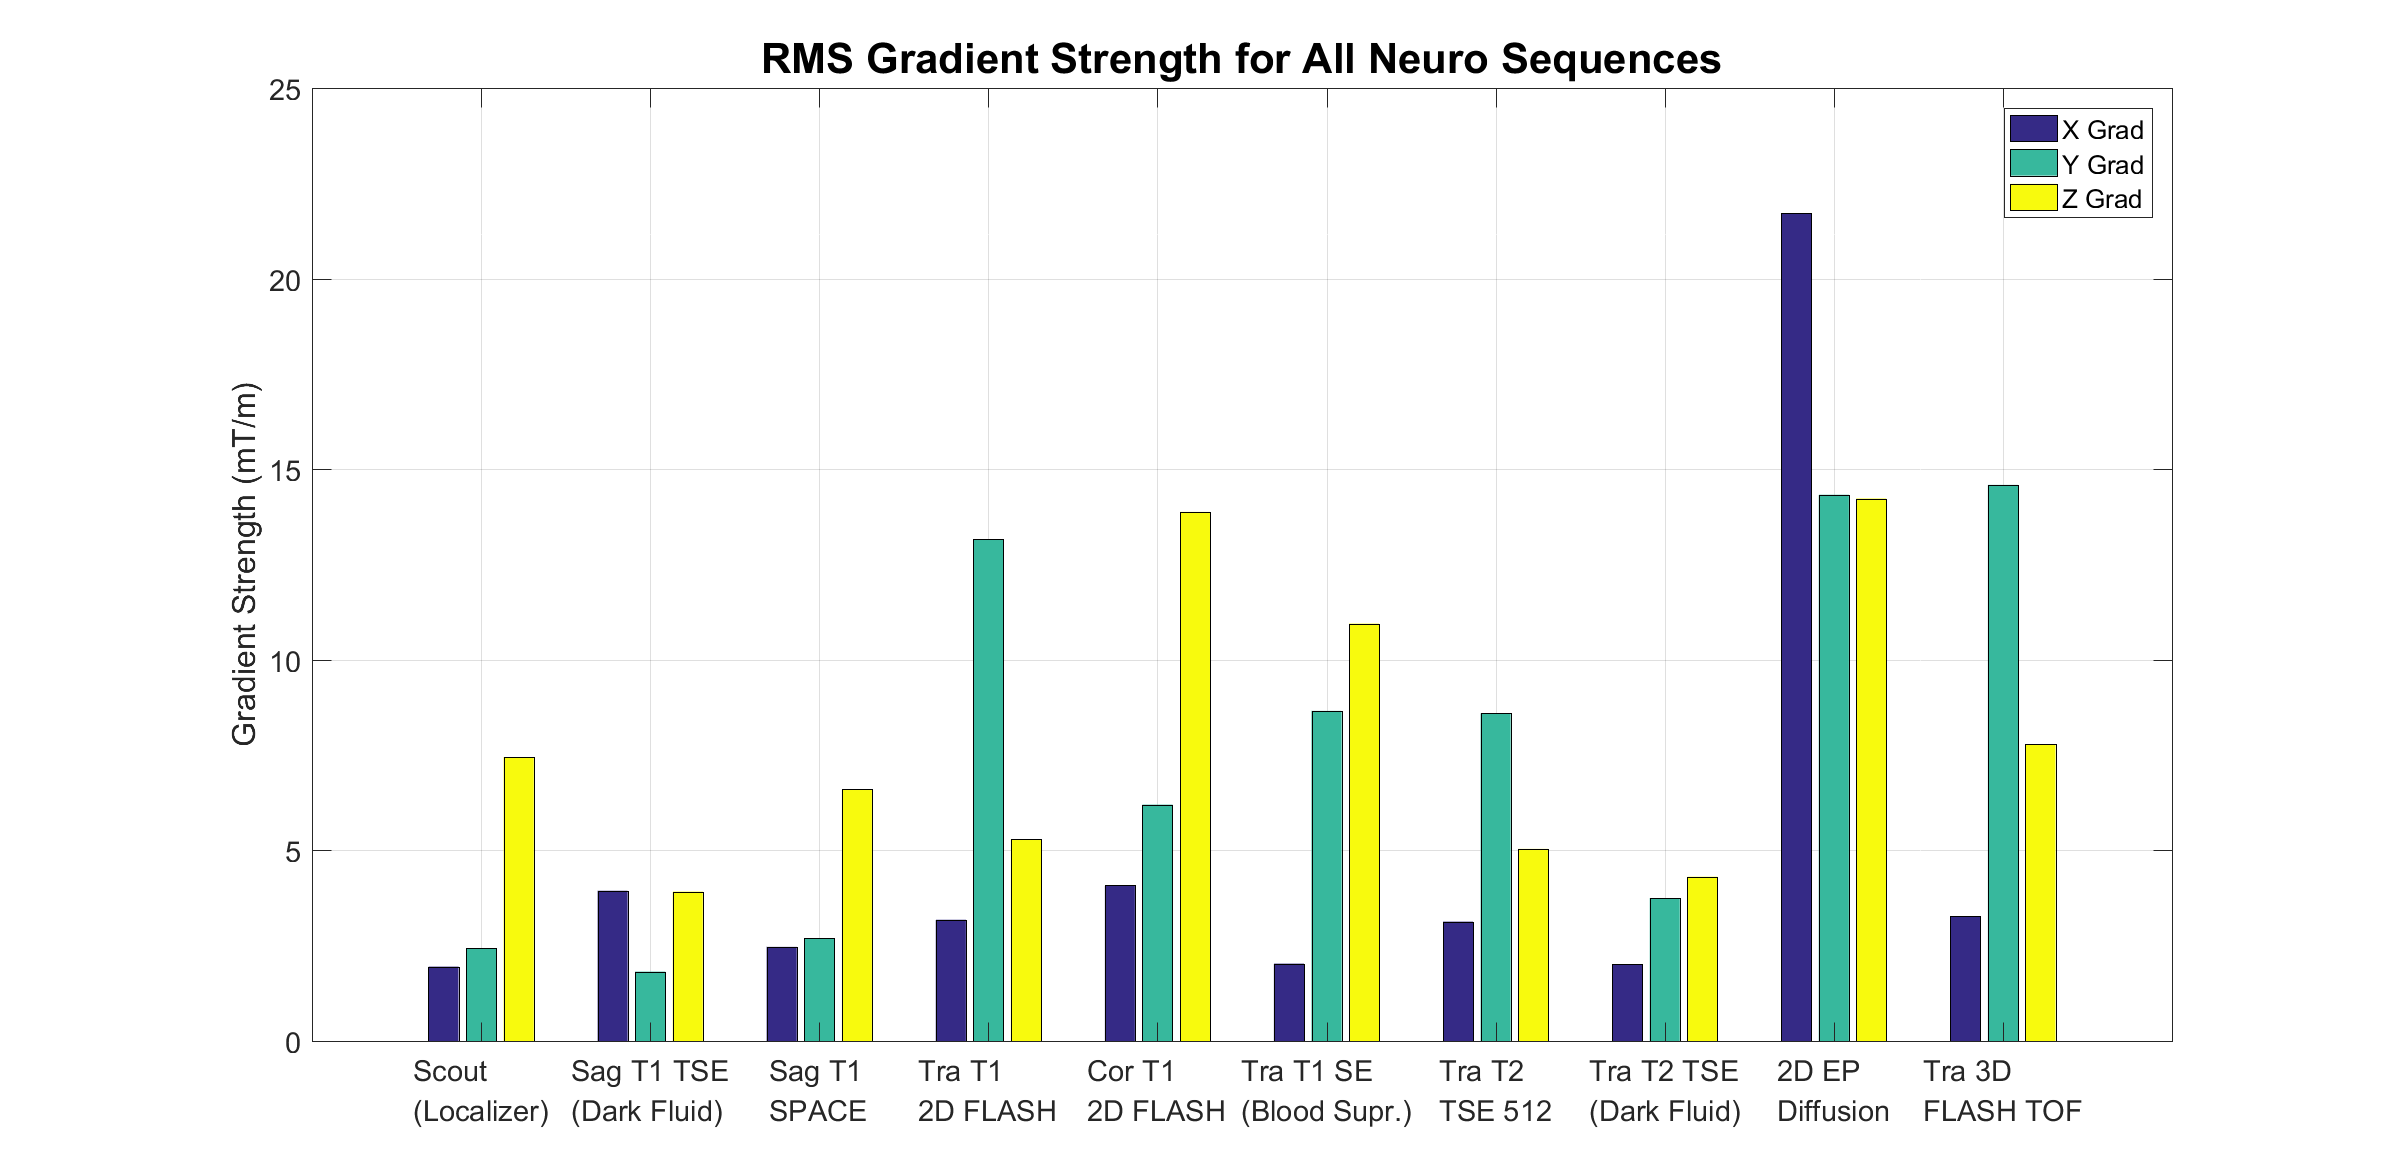
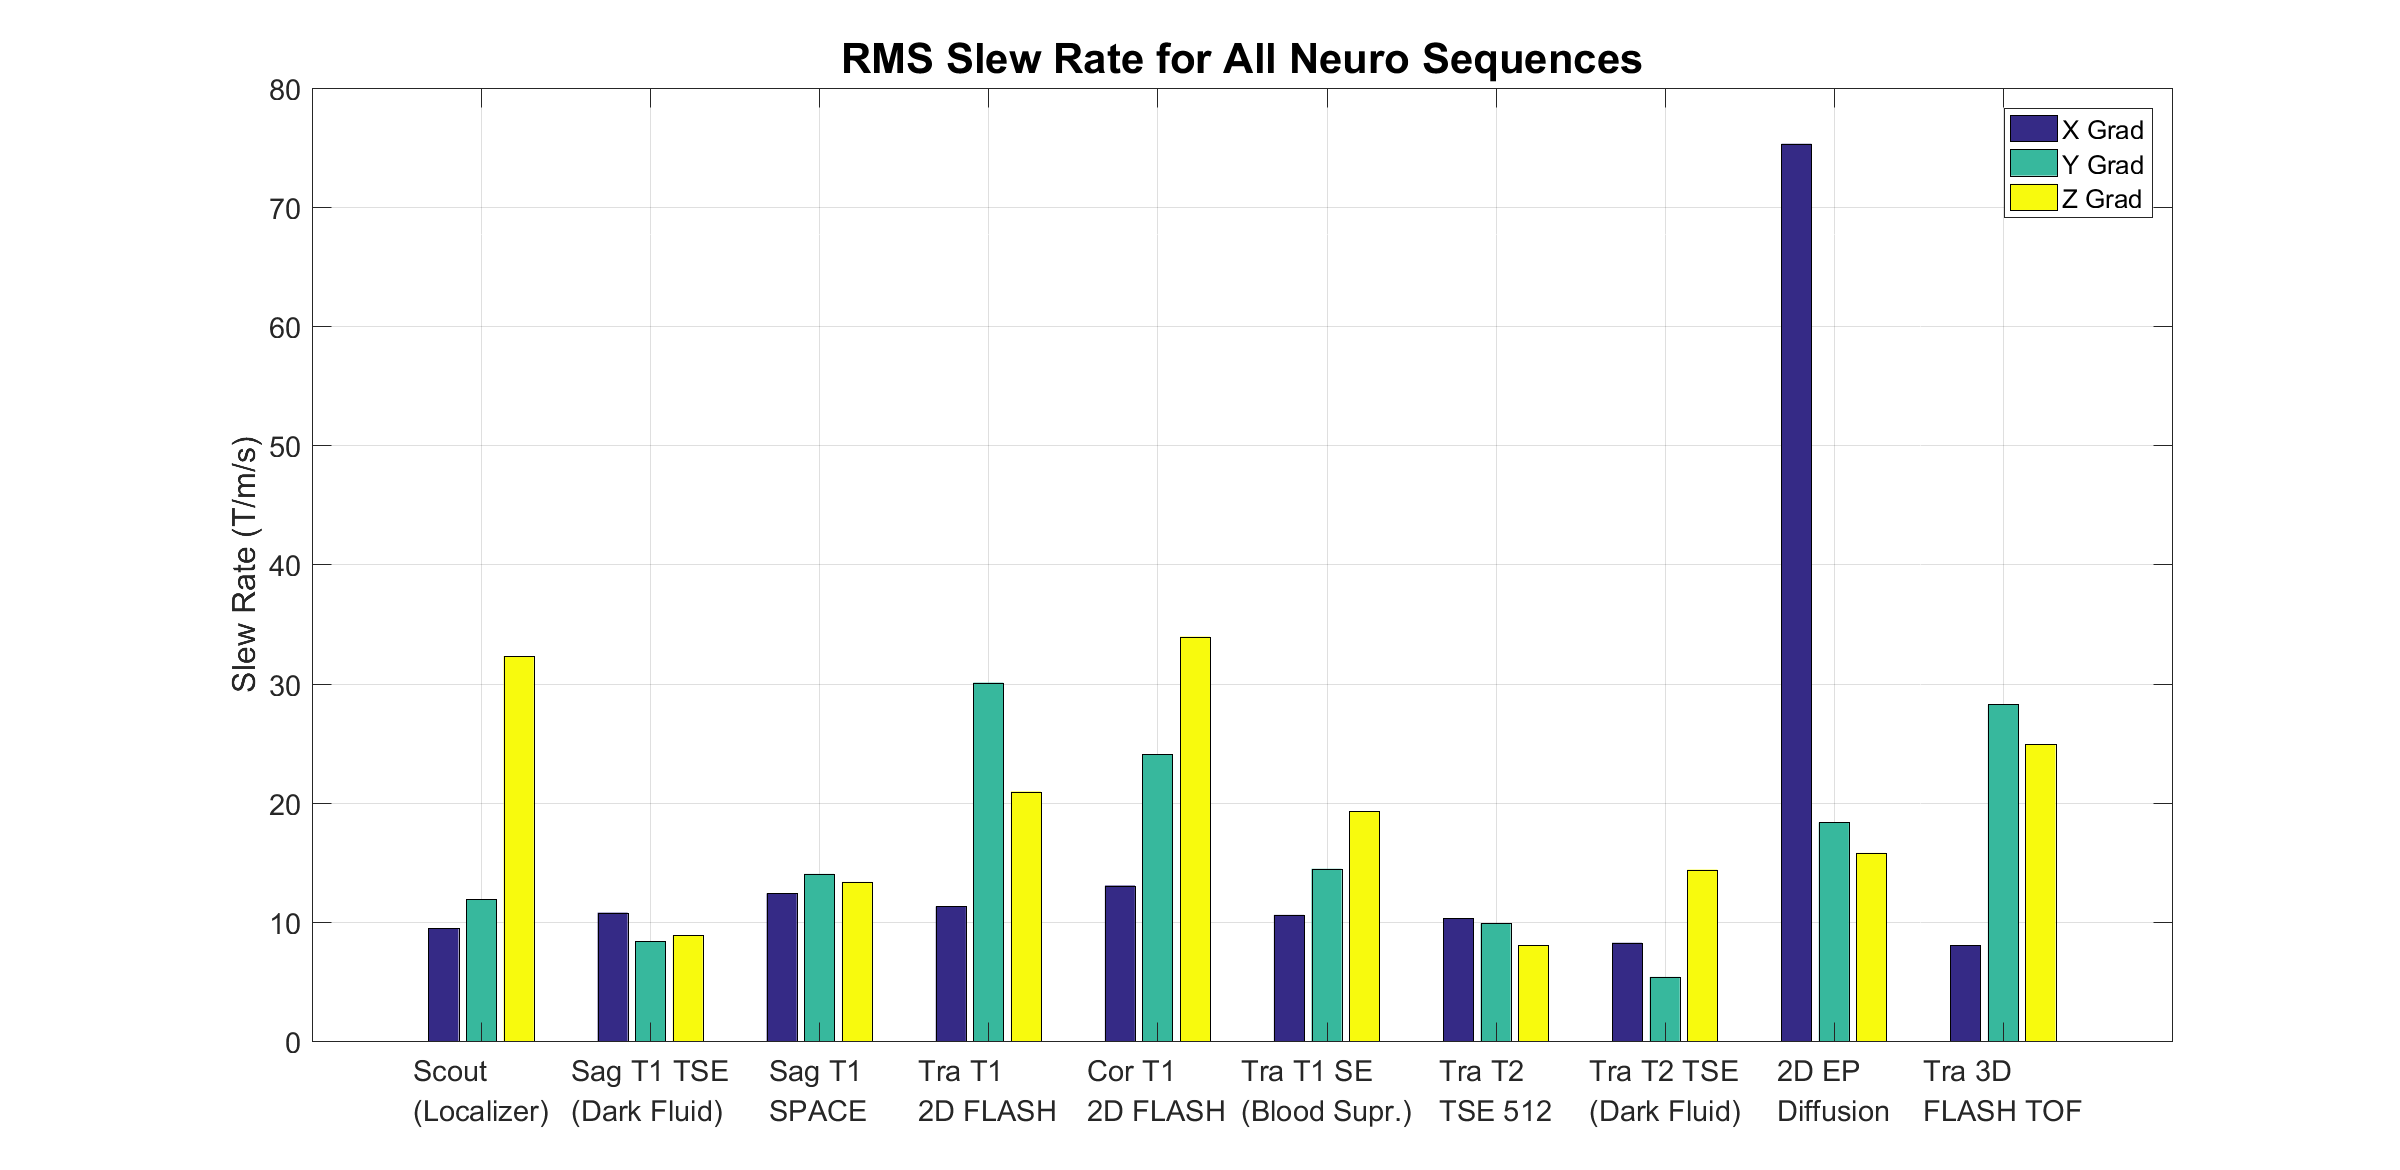
Refer to figures for full results in normal mode. Gradient peaks showed only three sequences over 50 mT/m and the maximum gradient strength was found to be 63.97 ± 0.05 mT/m within a diffusion imaging sequence. Peak RMS gradient strength across all sequences tested was 22.49 mT/m, and peak slew rate was 183.9 ± 0.2 T/m/s. The maximum RMS slew rate was 78.07 T/m/s, and the maximum combined RMS was 82.22 T/m/s. B1 RMS maxed at 2.3 µT on the coronal 2D FLASH sequence (GE SPGR). SAR peaks for WB, EB, and Head were 0.1 W/lb, 0.4 W/lb, and 0.5 W/lb, respectively. No significant gradient differences were observed between the normal and first level modes. Only one sequence had increased exposures in first level with a 0.5 µT increase in B1 RMS, a 0.1 W/lb increase in WB and EB SAR, and a 0.2 W/lb increase in Head SAR.Discussion
During all sequences, peak measured gradient amplitude and slew rate were lower than quoted system maximums (80 mT/m and 200 T/m/s per axis). The diffusion sequence came close at 63 mT/m on a single axis, while all other sequences were over 20 mT/m lower. Perhaps most surprisingly were the low values for the RMS slew-rate, which were typically below 30 T/m/s, and in only one case were over 35 T/m/s. The peak SAR values over all sequences were 4% of the WB maximum, 10% of the EB maximum, and 26% of the head maximum. This is again surprising, as these values were observed to be the same in both normal and first level control mode, with exception to one sequence. These results are consistent with the experience of the authors that this particular system does not in practice produce more than 2 W/kg in any operational mode. The peak B1 RMS was also only 8% of the system maximum of 30 µT. Examining more sequences and protocols will allow a more complete determination of the EM fields that a device would be exposed to. Based on these results, it appears that EM exposure levels for practical MRI sequences are significantly below exposure levels the MR systems are capable of achieving, and this is of great importance in determining testing criteria for the MR-conditional medical device community.Acknowledgements
NSERC Industrial Research Chairs Program, Ontario Research Fund Research Excellence Program, Canadian Foundation for Innovation.References
1. Shellock FG, Crues J V. MR procedures: biologic effects, safety, and patient care. Radiology. 2004;232(3):635-652. doi:10.1148/radiol.2323030830.
2. U.S. Food and Drug Administration. Guidance for Industry and FDA Staff Establishing Safety and Compatibility of Passive Implants in the Magnetic Resonance ( MR ) Environment. 2008.
3. MAGNETOM Prisma. https://www.healthcare.siemens.com/magnetic-resonance-imaging/3t-mri-scanner/magnetom-prisma/features#00271890. Accessed November 7, 2016.
Figures