2639
Evaluation of 50mm vs. 100mm Landmark Step Size for Pacemaker RF MRI Safety Evaluation1MRI Safety/Hardware Development, St. Jude Medical, Sylmar, CA, United States, 2MRI Safety/Hardware Development, St. Jude Medical, Sunnyvale, CA, United States
Synopsis
Pacemakers undergo evaluation per ISO/TS 10974 to determine MRI safety. In a 64 MHz 1.5T RF coil, a quarter wavelength for RF radiation within blood is approximately 130mm, suggesting simulations performed with z-dimensional landmark step size of 100mm might not sufficiently capture RF effects on power deposition at lead electrodes and voltage levels at the generator, requiring a 50mm step size instead. Through simulations using validated transfer functions, human body models, and MRI RF coil models, it is shown that the difference in results between 50mm and 100mm simulations may be incorporated into model uncertainty and 100mm simulations are sufficient.
Purpose
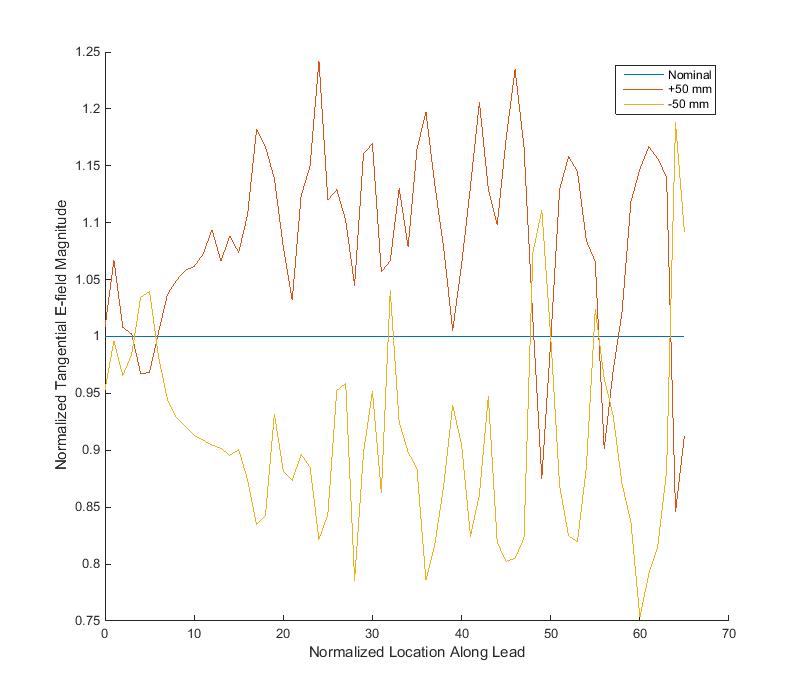
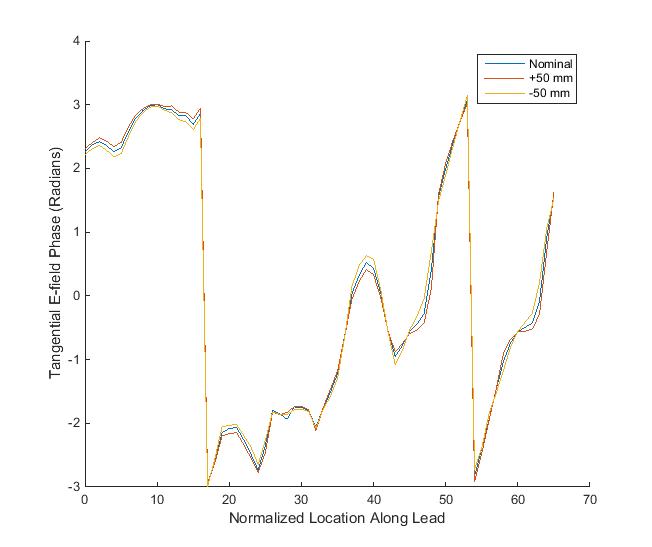
Active implantable medical devices (AIMDs) are required to undergo evaluation per ISO/TS 10974 to determine MRI safety. In vivo simulations of MRI scans using validated transfer functions (TFs), human body models, and MRI RF body coil models are used to predict in vivo power deposition at lead electrodes and voltage levels at the generator. Simulations are performed with the human body placed at different landmarks within the coil. For simulations within a 1.5T RF coil operating at a 64 MHz frequency, a quarter wavelength for RF radiation within blood is approximately 130 mm. Simulations performed with a z-dimensional landmark step size of 100mm, therefore, might not capture the full effect of the RF field, and simulations with a 50 mm step size might be necessary. Preliminary analysis of the tangential electric field (E-tan) along individual implant pathways with the human body model placed at a nominal location at the isocenter of the coil, +50mm location, and -50mm location showed a slight impact to E-tan magnitude and E-tan phase along the lead path, as shown in Figure 1 and Figure 2. Here, an analysis is performed on a representative set of simulations to evaluate the difference in results between 100mm and 50mm landmark step size simulations and determine whether 100mm simulations provide a comprehensive representation of in vivo RF effects for pacemakers.Methods
Simulations were performed using TF models for power deposition at the lead electrode and voltage levels at the generator for two systems: 1) Pacemaker + Pacing Conductor/Tip Electrode Model A and 2) Pacemaker + Pacing Conductor/Tip Electrode Model B. The adult male body model from the Virtual Population Project was used. Implant pathways within this model were designed based on clinically relevant generator implant locations, vascular access sites, and intra-cardiac lead tip locations. Subcutaneous generator implant regions included the pectoral and submammary on the left and right side. The vascular access sites included subclavian, axillary, and jugular locations. The intra-cardiac lead tip location included the right ventricle. SEMCAD X was used to simulate electric fields within the body when exposed to a variety of 1.5T MRI RF body coils. Modeling factors also included polarization of the coil (clockwise vs. counterclockwise), location of the human body within the coil/landmark, and nominal permittivity and conductivity of human tissue.
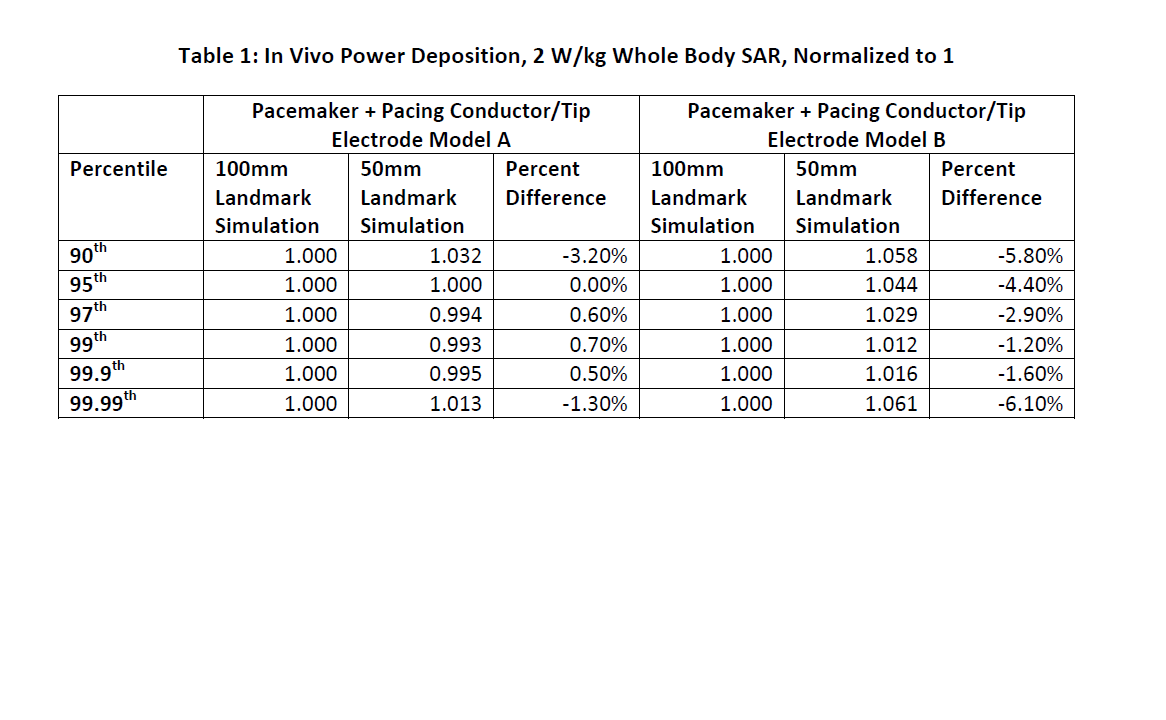
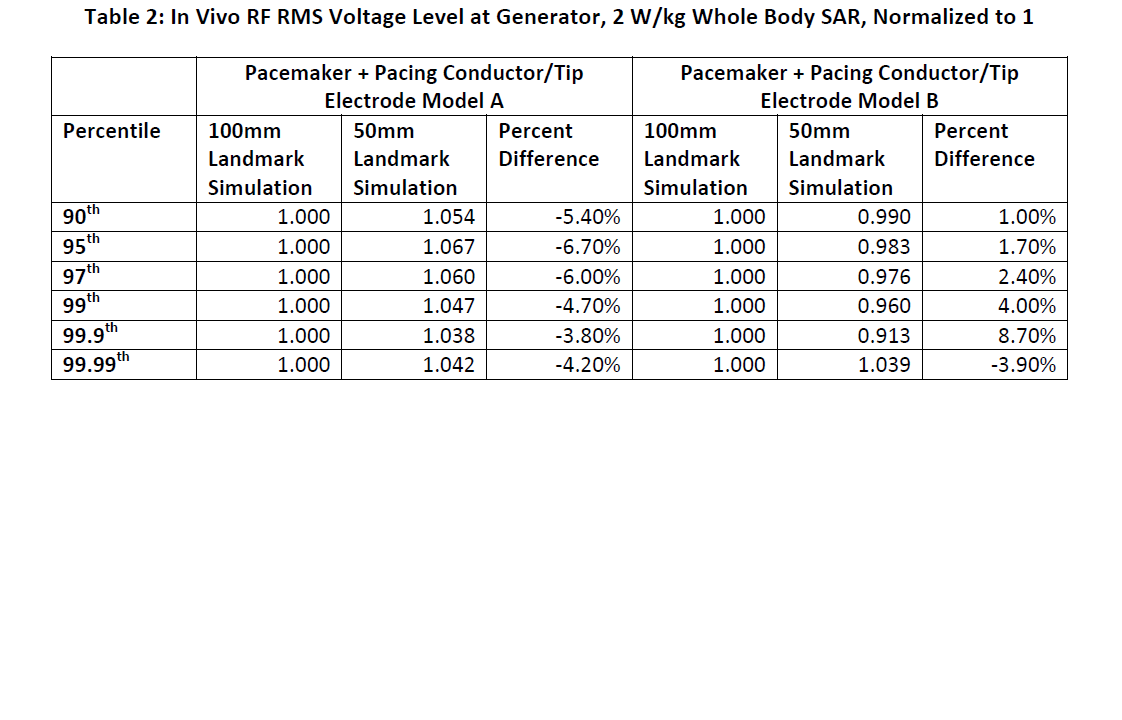
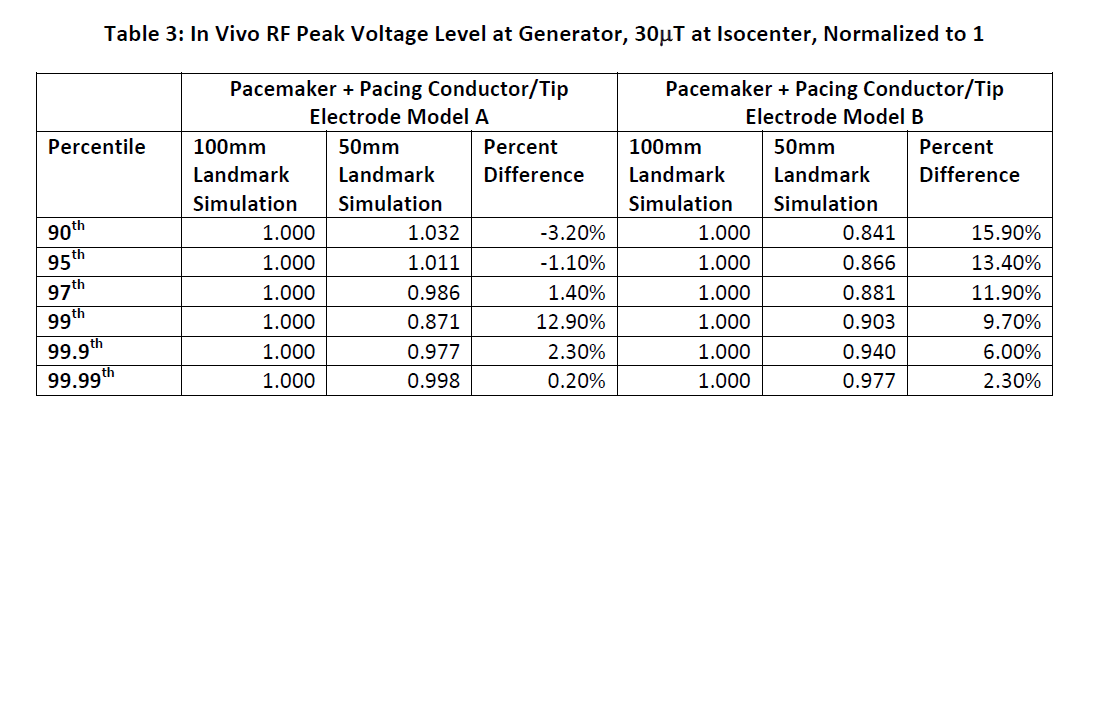
A set of fifty-three (53) combinations of RF coil and 100mm landmark step size simulations was performed for both systems and incorporated model error associated with the TF. A second set of one hundred and eleven (111) combinations of RF coil and 50mm landmark step size simulations was also performed for both systems and again incorporated model error associated with the TF. For both sets of simulations, the 90th, 95th, 97th, 99th, 99.9th, and 99.99th percentile values were calculated for power deposition at the lead electrode and voltage levels at the generator. Power deposition results were scaled to 2 W/kg whole body SAR, peak voltage levels at the generator were scaled to 30μT at the isocenter, and root mean square (RMS) voltage levels at the generator were scaled to 2 W/kg whole body SAR. These percentile values were then normalized to a level of 1 for the 100mm simulations and scaled accordingly for the 50mm simulations. The difference between the 100mm simulation and the 50mm simulations was calculated as $$ Percent Difference =\frac{Result_{100mm} -Result_{50mm}}{Result_{100mm}} $$
Results
See Tables 1, 2, and 3.Discussion
Positive percent differences between 100mm and 50mm landmark results in Tables 1, 2, and 3 indicate that results of the 100mm landmark simulations resulted in higher levels for the given simulation while negative percent differences indicate that 50mm landmark simulations were higher. Across both system types, the maximum negative percent difference across all percentiles for: 1) power deposition was -6.10%, 2) RMS voltage at the generator was -6.70%, and 3) peak voltage at the generator was -3.20%. Overall, 50mm landmark simulation results were not more than 7.00% higher than 100mm simulation results, which may be accounted for through incorporation into model uncertainty.Conclusion
Performing simulations at 100mm landmark step size is sufficient to capture the effects of a 1.5T RF coil operating at 64 MHz on power deposition at the lead tip electrode as well as the voltage at the generator of pacemakers.Acknowledgements
No acknowledgement found.References
No reference found.Figures